Notebookcheck Logo

Intel Core i5-13400F vs Intel Core i9-9900KS vs Intel Core i5-13400

Intel Core i5-13400F

► remove from comparison Intel i5-13400F

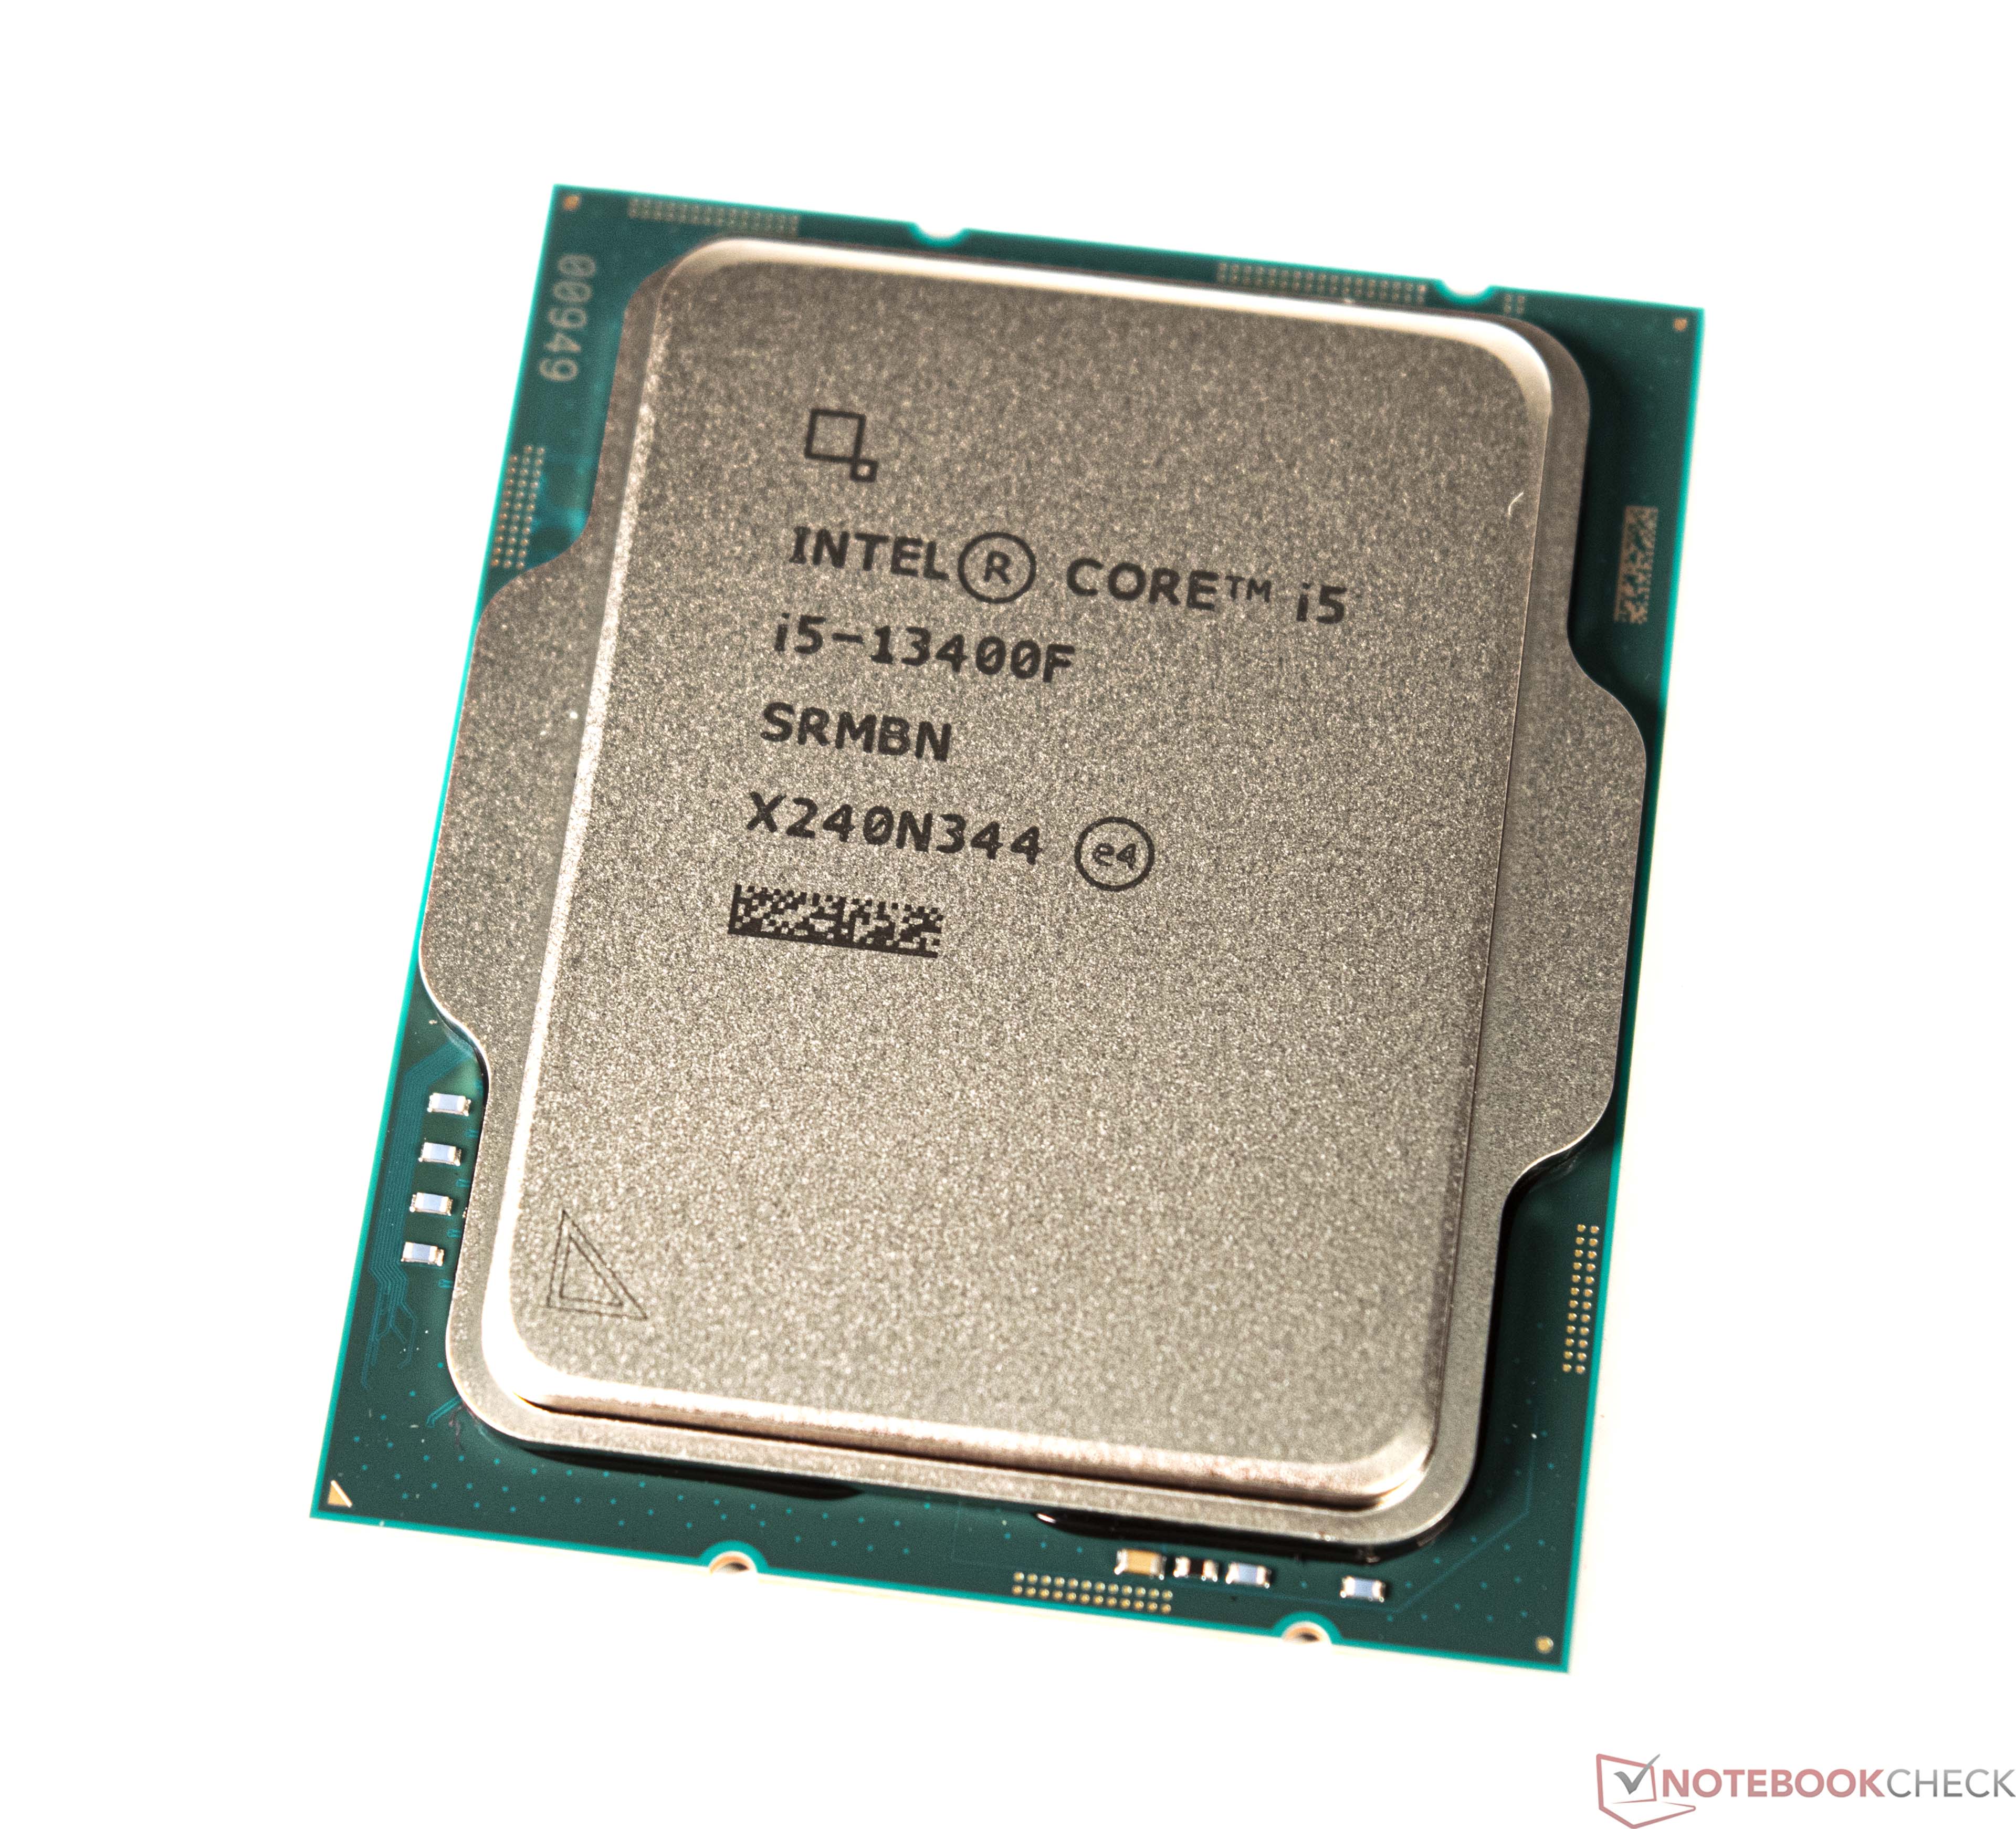
The Intel Core i5-13400F is a mid-range desktop processor of the Raptor Lake series. It includes a hybrid architecture for the CPU cores with combined 10 cores. Six fast Golden Cove / Raptor Cove performance cores (P-cores) with HyperThreading and a clock speed of 3.5 - 5.1 GHz and four Gracemont efficiency cores without HyperThreading and a clock speed of 2.6 - 3.9 GHz. The 13400F can be based on the older Alder Lake chips (at least for early models) or the newer Raptor Lake chips. The F-series of CPUs do not integrate a iGPU.

The performance is clearly higher than the old Core i5-12400F due to the additional four E-cores. These help in multi-threaded workloads and the higher boost core of the p-cores help for single threaded workloads.

The power consumption of the 13400F is rated at 65 Watt for sustained workloads (PL1) and 148 Watt for short bursts (PL2).

Intel Core i9-9900KS

► remove from comparison Intel i9-9900KS

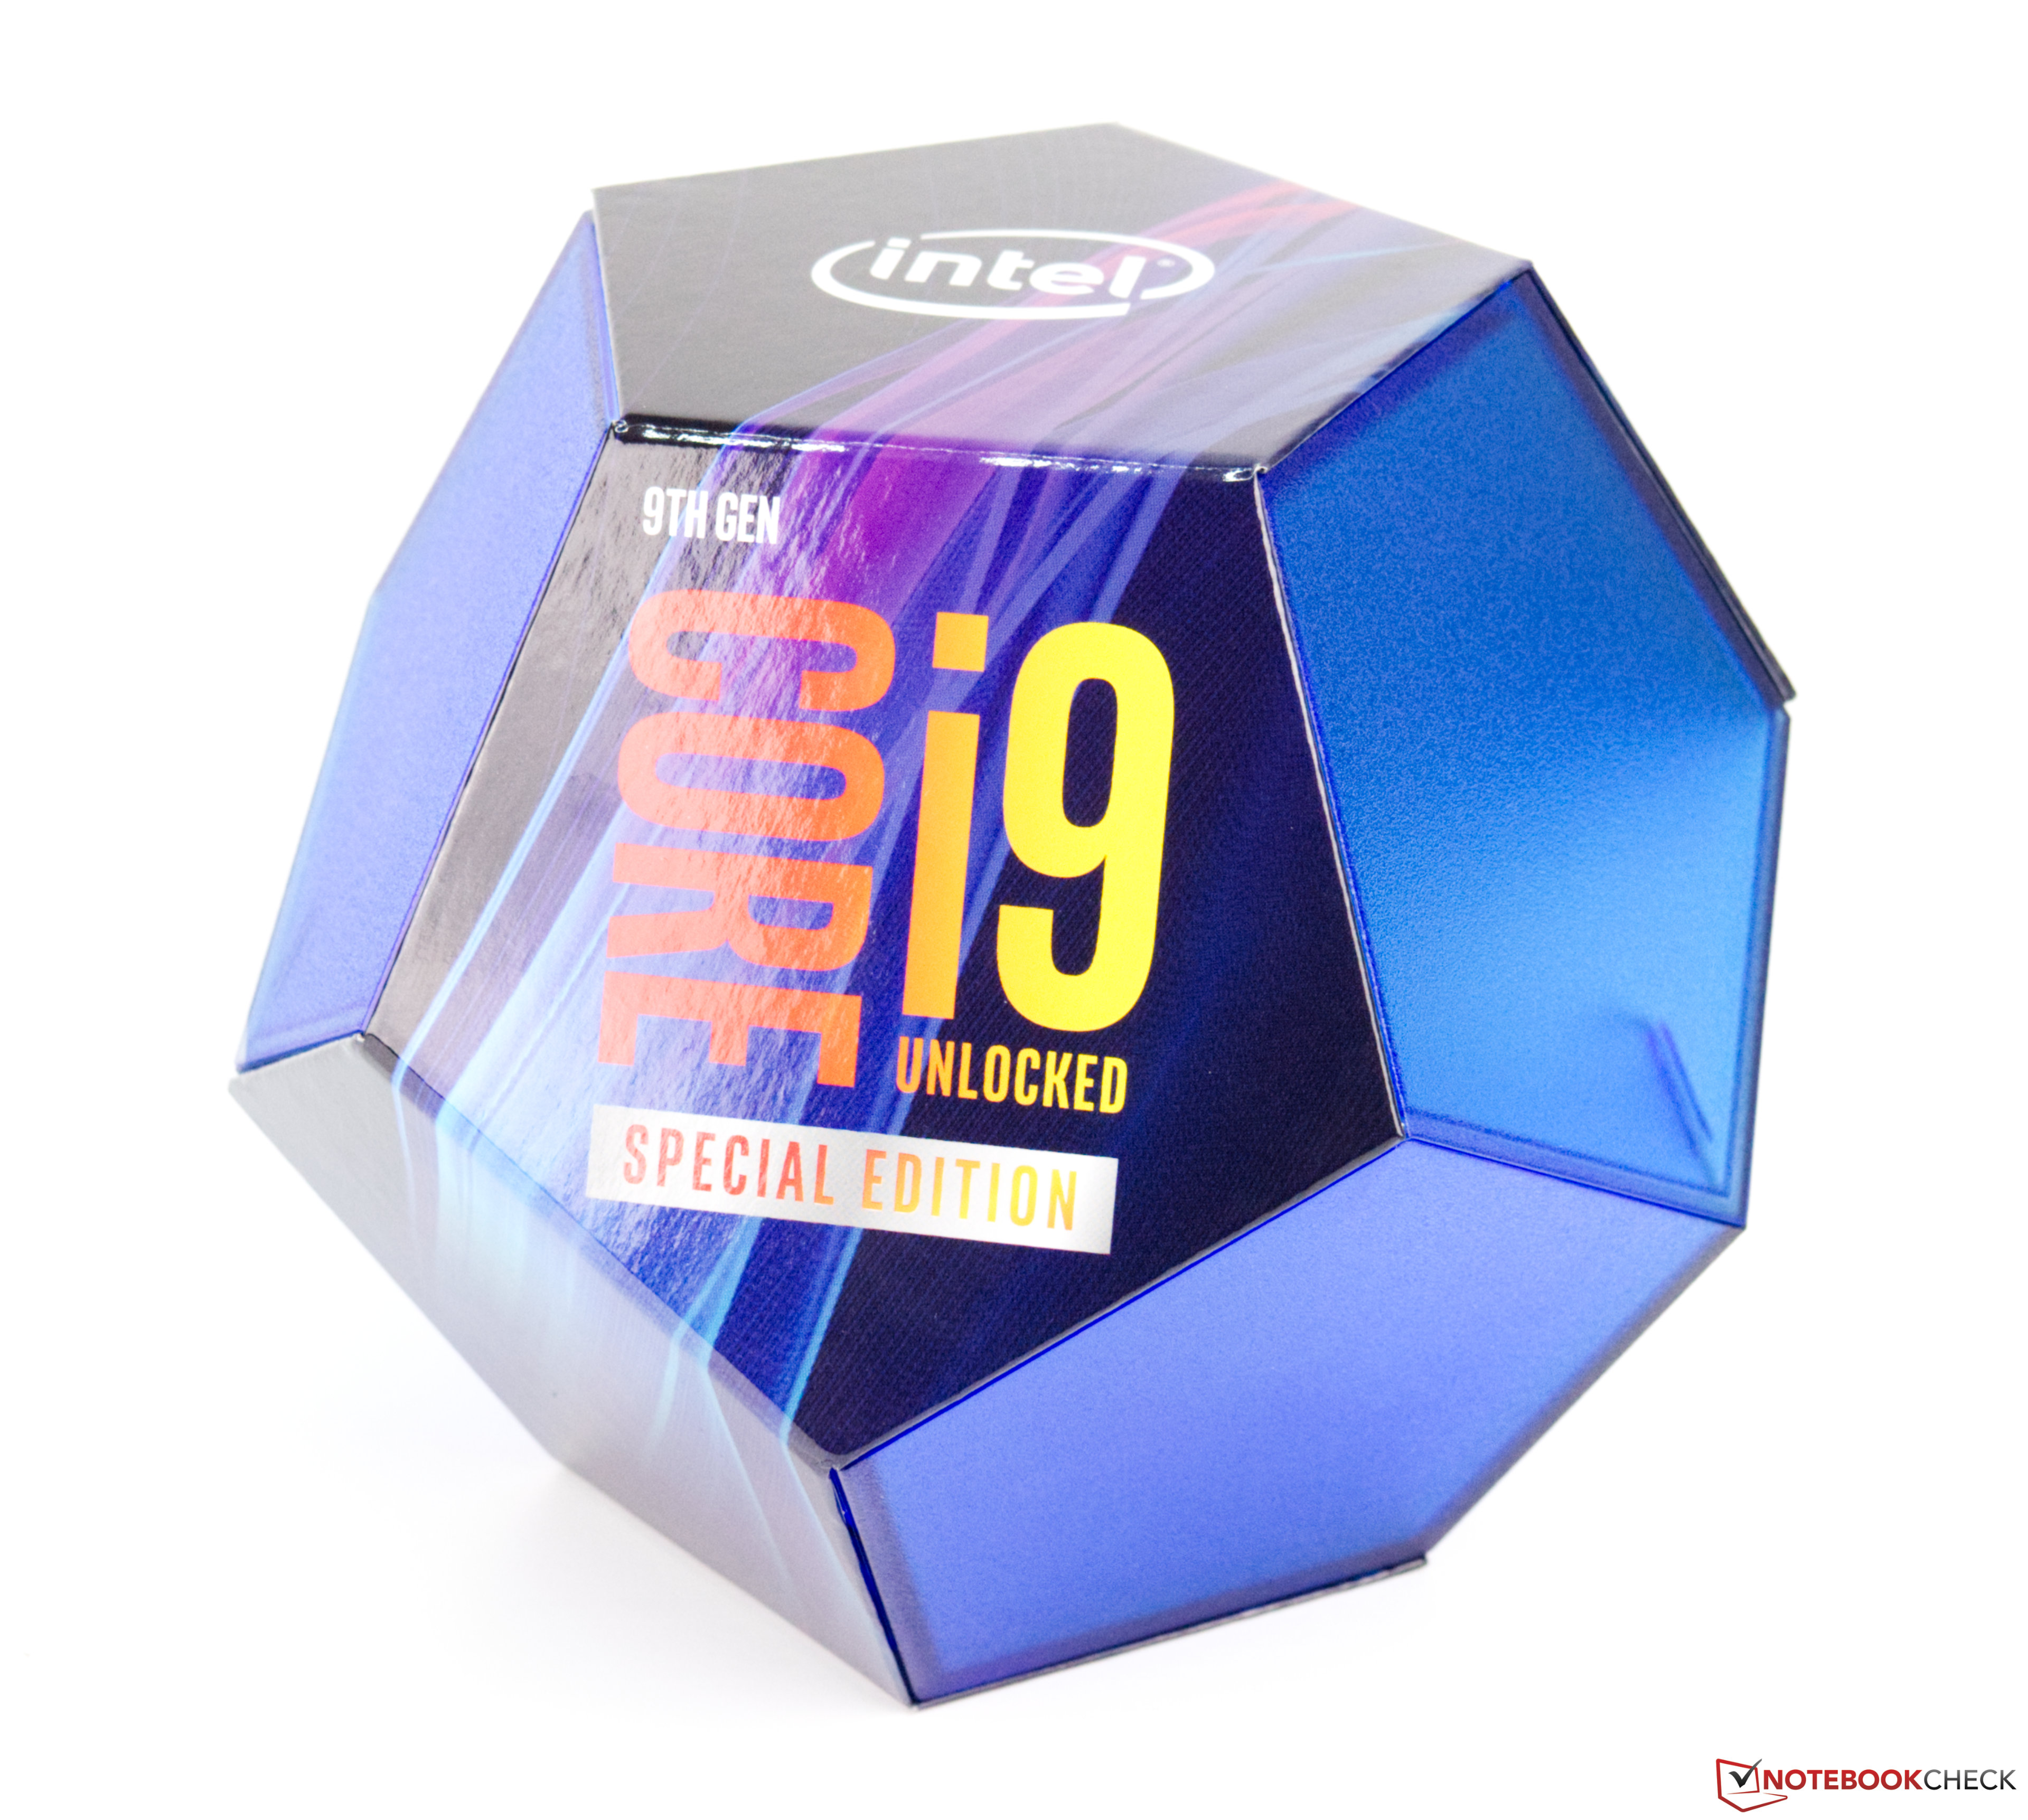
The Intel Core i9-9900KS is a high end desktop processor that includes 8 cores based on the Coffee Lake architecture. It is the fastest Coffee Lake CPU in 2019 and compared to the similar named i9-9900K, the KS offers an all core Turbo of 5 GHz. All cores can clock between 4 GHz and 5 GHz and thanks to Hyperthreading / SMT 16 threads can be executed in parallel. The CPU is still manufactured in the mature 14 nm process (14nm++). Thanks to the open multiplicator, the CPU is rather easy to overclock (if a Z390 based mainboard is used).

With good cooling, the i9-9900KS can be around 10% faster than the older Intel Core i9-9900K (thanks to the 5 GHz all core Turbo). Compare to the old Core i7-8700K, the 9900KS is even 45% faster. Especially for gaming, the 9900KS is currently the fastest option available. The fast Ryzen and Threadripper CPUs from AMD however offer a better multithreaded performance.

The integrated GPU is called Intel UHD Graphics 630 and clocks with up to 1.2 GHz. It is not suited for demanding 3D games and located in the low end.

The TDP is raised to 127 Watt for the additional performance, therefore a good CPU cooler is needed. When overclocking the CPU, more than 200 Watt can be reached unter load.

Intel Core i5-13400

► remove from comparison Intel i5-13400

The Intel Core i5-13400 is a top modern and fast desktop processor and belongs to the current Raptor Lake series. The processor was introduced early 2023 and offers a base clock of 2.5 GHz. It reaches up to 4.6 GHz in Turbo mode. As with Alder Lake-S, Raptor Lake-S is also based on a hybrid design that combines P and E cores. The Intel Core i5-13400 therefore offers 6 P-cores and 4 E-cores, which can process a total of up to 16 threads in parallel. The processor continues to be manufactured using the 10 nm production process (called "Intel 7"). The Intel Core i5-13400 does not have a freely selectable multiplier. The LGA 1700 socket introduced with the Alder Lake series serves as the basis. The Intel Core i5-13400 can be based on either a Raptor Lake or Alder Lake chip. Initially, however, Alder Lake chips will be supplied.

Performance

Compared to the Intel Core i5-12400, the IPC of the new Core i5-13400 has been increased slightly. Nevertheless, there are now also 4 e-cores, which support the processor in terms of multi-thread performance. This puts the Intel Core i5-13400 at the level of an Intel Core i5-12600K, which also offers a total of 16 threads.

Graphics unit

The Intel Core i5-13400 is a processor with an integrated graphics unit, but it is only suited for office use or very old and low demanding games.

Power consumption

The TDP of the Intel Core i5-13400 is 65 watts in PL1. Intel defines the PL2 limit at 148 watts. If the restrictions regarding power consumption are deactivated in the BIOS, the PL2 value can be reached permanently. However, a high-quality and powerful cooling unit should be used for this.

ModelIntel Core i5-13400FIntel Core i9-9900KSIntel Core i5-13400
SeriesIntel Raptor Lake-SIntel Coffee LakeIntel Raptor Lake-S
CodenameRaptor Lake-SCoffee Lake-RRaptor Lake-S
Series: Raptor Lake-S Raptor Lake-S
Intel Core i7-137002.1 - 5.2 GHz16 / 24 cores30 MB L3
Intel Core i5-13400F « 2.5 - 4.6 GHz10 / 16 cores20 MB L3
Intel Core i5-134002.5 - 4.6 GHz10 / 16 cores20 MB L3
Intel Core i9-9900KS « 4 - 5 GHz8 / 16 cores16 MB L3
Intel Core i9-9900K3.6 - 5 GHz8 / 16 cores16 MB L3
Intel Core i7-9700K3.6 - 4.9 GHz8 / 8 cores12 MB L3
Intel Core i7-97003 - 4.7 GHz8 / 8 cores12 MB L3
Intel Core i5-9600K3.7 - 4.6 GHz6 / 6 cores9 MB L3
Intel Core i9-9900T2.1 - 4.4 GHz8 / 16 cores16 MB L3
Intel Core i5-9400F2.9 - 4.1 GHz6 / 6 cores9 MB L3
Intel Core i3-9100F3.6 - 4.2 GHz4 / 4 cores6 MB L3
Intel Core i7-137002.1 - 5.2 GHz16 / 24 cores30 MB L3
Intel Core i5-13400F2.5 - 4.6 GHz10 / 16 cores20 MB L3
Intel Core i5-13400 « 2.5 - 4.6 GHz10 / 16 cores20 MB L3
Clock2500 - 4600 MHz4000 - 5000 MHz2500 - 4600 MHz
L1 Cache0.1 MB512 KB0.1 MB
L2 Cache9.5 MB2 MB9.5 MB
L3 Cache20 MB16 MB20 MB
Cores / Threads10 / 168 / 1610 / 16
TDP65 Watt127 Watt65 Watt
Technology10 nm14 nm10 nm
Die Size257 mm2178 mm2257 mm2
max. Temp.100 °C100 °C100 °C
SocketLGA 1700FCLGA1151LGA 1700
FeaturesIntel SSE4.1, Intel SSE4.2, Intel AVX2Dual-Channel DDR4-2666 Memory Controller, HyperThreading, AVX, AVX2, AES-NI, TSX-NI, Quick Sync, Virtualization, vProIntel SSE4.1, Intel SSE4.2, Intel AVX2
Architecturex86x86x86
$196 U.S.$513 U.S.$221 U.S.
Announced
Manufacturerark.intel.comwww.intel.dewww.intel.de
iGPUIntel UHD Graphics 630 (350 - 1200 MHz)Intel UHD Graphics 730 (Rocket Lake) (300 - 1550 MHz)

Benchmarks

Performance Rating - CB R15 + R20 + 7-Zip + X265 + Blender + 3DM11 CPU - i5-13400F
42.5 pt (59%)
Performance Rating - CB R15 + R20 + 7-Zip + X265 + Blender + 3DM11 CPU - i9-9900KS
38.4 pt (53%)
Performance Rating - CB R15 + R20 + 7-Zip + X265 + Blender + 3DM11 CPU - i5-13400
42.9 pt (60%)
Cinebench R23 - Cinebench R23 Multi Core
15911 Points (15%)
15953 Points (15%)
Cinebench R23 - Cinebench R23 Single Core
1744 Points (74%)
1786 Points (76%)
Cinebench R20 - Cinebench R20 CPU (Single Core)
672 Points (75%)
min: 509     avg: 512     median: 511.5 (57%)     max: 514 Points
688 Points (76%)
Cinebench R20 - Cinebench R20 CPU (Multi Core)
6091 Points (15%)
min: 4463     avg: 4820     median: 4819.5 (12%)     max: 5176 Points
6135 Points (15%)
Cinebench R15 - Cinebench R15 CPU Multi 64 Bit
2364 Points (15%)
min: 1962     avg: 2058     median: 2058 (13%)     max: 2154 Points
2358 Points (15%)
Cinebench R15 - Cinebench R15 CPU Single 64 Bit
252 Points (76%)
min: 215     avg: 216     median: 216 (65%)     max: 217 Points
257 Points (77%)
Cinebench R11.5 - Cinebench R11.5 CPU Multi 64 Bit
27.5 Points (36%)
min: 22.31     avg: 23.2     median: 23.1 (30%)     max: 23.98 Points
27.4 Points (36%)
Cinebench R11.5 - Cinebench R11.5 CPU Single 64 Bit
3.1 Points (76%)
min: 2.43     avg: 2.4     median: 2.4 (61%)     max: 2.46 Points
3.1 Points (77%)
Cinebench R10 - Cinebench R10 Rend. Single (32bit)
8689 Points (52%)
min: 8143     avg: 8183     median: 8183 (49%)     max: 8223 Points
8721 Points (53%)
Cinebench R10 - Cinebench R10 Rend. Multi (32bit)
51113 Points (37%)
min: 50462     avg: 51779     median: 51778.5 (38%)     max: 53095 Points
51095 Points (37%)
Cinebench R10 - Cinebench R10 Rend. Multi (64bit)
82988 Points (58%)
69169 Points (48%)
83214 Points (58%)
Cinebench R10 - Cinebench R10 Rend. Single (64bit)
13947 Points (17%)
10759 Points (13%)
14142 Points (17%)
wPrime 2.10 - wPrime 2.0 1024m *
367.9 s (4%)
min: 82     avg: 87.9     median: 87.9 (1%)     max: 93.8 s
452.3 s (5%)
wPrime 2.10 - wPrime 2.0 32m *
3.3 s (1%)
min: 3.232     avg: 3.6     median: 3.6 (1%)     max: 3.969 s
3.5 s (1%)
WinRAR - WinRAR 4.0
8602 Points (14%)
min: 8156     avg: 8353     median: 8353 (13%)     max: 8550 Points
7979 Points (13%)
7-Zip 18.03 - 7-Zip 18.03 Multli Thread 4 runs
60048 MIPS (34%)
min: 55064     avg: 55735     median: 55735 (32%)     max: 56406 MIPS
59510 MIPS (34%)
7-Zip 18.03 - 7-Zip 18.03 Single Thread 4 runs
5743 MIPS (69%)
min: 5674     avg: 5734     median: 5734 (69%)     max: 5794 MIPS
5829 MIPS (70%)
X264 HD Benchmark 4.0 - x264 Pass 2
136.9 fps (48%)
min: 116     avg: 122.5     median: 122.5 (43%)     max: 129 fps
135.8 fps (47%)
X264 HD Benchmark 4.0 - x264 Pass 1
314.5 fps (73%)
min: 276.2     avg: 278.9     median: 278.9 (64%)     max: 281.5 fps
311 fps (72%)
HWBOT x265 Benchmark v2.2 - HWBOT x265 4k Preset
19.2 fps (34%)
min: 15.31     avg: 16.3     median: 16.3 (29%)     max: 17.2 fps
19.1 fps (34%)
TrueCrypt - TrueCrypt Serpent
1.1 GB/s (0%)
1.2 GB/s (0%)
1.2 GB/s (0%)
TrueCrypt - TrueCrypt Twofish
2 GB/s (34%)
2.1 GB/s (36%)
2 GB/s (34%)
TrueCrypt - TrueCrypt AES
12.2 GB/s (32%)
min: 12.1     avg: 12.2     median: 12.2 (32%)     max: 12.2 GB/s
11.8 GB/s (31%)
Blender - Blender 3.3 Classroom CPU *
336 Seconds (4%)
336 Seconds (4%)
Blender - Blender 2.79 BMW27 CPU *
206 Seconds (1%)
min: 205.1     avg: 224.6     median: 224.6 (2%)     max: 244 Seconds
206 Seconds (1%)
R Benchmark 2.5 - R Benchmark 2.5 *
0.5 sec (10%)
0.5 sec (10%)
3DMark 06 - CPU - 3DMark 06 - CPU
13989 Points (30%)
min: 14825     avg: 14884     median: 14883.5 (32%)     max: 14942 Points
13632 Points (29%)
Super Pi mod 1.5 XS 1M - Super Pi mod 1.5 XS 1M *
8 s (2%)
min: 7.405     avg: 7.4     median: 7.4 (2%)     max: 7.436 s
8 s (2%)
Super Pi mod 1.5 XS 2M - Super Pi mod 1.5 XS 2M *
17.9 s (1%)
min: 16.45     avg: 16.5     median: 16.5 (1%)     max: 16.59 s
18 s (1%)
Super Pi Mod 1.5 XS 32M - Super Pi mod 1.5 XS 32M *
420.5 s (2%)
min: 412.2     avg: 414.2     median: 414.2 (2%)     max: 416.1 s
427.2 s (2%)
3DMark Vantage - 3DM Vant. Perf. CPU no Physx
77937 Points (68%)
79573 Points (70%)
3DMark 11 - 3DM11 Performance Physics
23820 Points (64%)
min: 18531     avg: 18914     median: 18694 (51%)     max: 19517 Points
23120 Points (63%)
3DMark - 3DMark Ice Storm Physics
77765 Points (63%)
min: 75473     avg: 75482     median: 75482 (61%)     max: 75491 Points
83302 Points (68%)
3DMark - 3DMark Ice Storm Extreme Physics
76636 Points (62%)
min: 75946     avg: 76061     median: 76060.5 (62%)     max: 76175 Points
82671 Points (67%)
3DMark - 3DMark Ice Storm Unlimited Physics
80273 Points (68%)
min: 74085     avg: 75802     median: 75508 (64%)     max: 77813 Points
89999 Points (76%)
3DMark - 3DMark Cloud Gate Physics
19846 Points (50%)
min: 19068     avg: 19770     median: 20049 (51%)     max: 20193 Points
19608 Points (50%)
3DMark - 3DMark Fire Strike Standard Physics
28087 Points (50%)
min: 24327     avg: 25511     median: 26016 (46%)     max: 26191 Points
27135 Points (48%)
3DMark - 3DMark Time Spy CPU
12669 Points (53%)
min: 11017     avg: 11358     median: 11375 (48%)     max: 11683 Points
12948 Points (55%)
Geekbench 5.5 - Geekbench 5.1 - 5.4 64 Bit Single-Core
1792 Points (76%)
1372 Points (58%)
1795 Points (76%)
Geekbench 5.5 - Geekbench 5.1 - 5.4 64 Bit Multi-Core
12095 Points (22%)
9100 Points (16%)
12107 Points (22%)
Geekbench 5.0 - Geekbench 5.0 64 Bit Single-Core
1721 Points (7%)
1706 Points (7%)
Geekbench 5.0 - Geekbench 5.0 64 Bit Multi-Core
12009 Points (38%)
11801 Points (37%)
Geekbench 4.4 - Geekbench 4.1 - 4.4 64 Bit Single-Core
7684 Points (77%)
6308 Points (63%)
7683 Points (77%)
Geekbench 4.4 - Geekbench 4.1 - 4.4 64 Bit Multi-Core
43856 Points (48%)
35586 Points (39%)
42509 Points (47%)
Geekbench 4.0 - Geekbench 4.0 64 Bit Single-Core
6313 Points (86%)
Geekbench 4.0 - Geekbench 4.0 64 Bit Multi-Core
35932 Points (88%)
Mozilla Kraken 1.1 - Kraken 1.1 Total Score *
535 ms (1%)
883 ms (1%)
535 ms (1%)
Octane V2 - Octane V2 Total Score
44538 Points (39%)
WebXPRT 4 - WebXPRT 4 Score
254 Points (73%)
251 Points (72%)
WebXPRT 3 - WebXPRT 3 Score
294 Points (61%)
306 Points (64%)
CrossMark - CrossMark Overall
1941 Points (74%)
1877 Points (72%)
Power Consumption - Prime95 Power Consumption - external Monitor *
214 Watt (37%)
259.6 Watt (45%)
229 Watt (39%)
Power Consumption - Cinebench R15 Multi Power Consumption - external Monitor *
184.2 Watt (34%)
min: 219.3     avg: 269.1     median: 292.7 (53%)     max: 295.4 Watt
196.6 Watt (36%)
Power Consumption - Idle Power Consumption - external Monitor *
76.3 Watt (50%)
Power Consumption - Idle Power Consumption 150cd 1min *
82.8 Watt (92%)
Power Consumption - Cinebench R15 Multi Power Efficiency - external Monitor
min: 7.29     avg: 8.1     median: 8.1 (6%)     max: 8.95 Points per Watt

Average Benchmarks Intel Core i5-13400F → 100% n=38

Average Benchmarks Intel Core i9-9900KS → 92% n=38

Average Benchmarks Intel Core i5-13400 → 101% n=38

- Range of benchmark values for this graphics card
- Average benchmark values for this graphics card
* Smaller numbers mean a higher performance
1 This benchmark is not used for the average calculation

v1.28
log 04. 17:13:58

#0 checking url part for id 14966 +0s ... 0s

#1 checking url part for id 11553 +0s ... 0s

#2 checking url part for id 14996 +0s ... 0s

#3 redirected to Ajax server, took 1720106038 +0s ... 0s

#4 did not recreate cache, as it is less than 5 days old! Created at Thu, 04 Jul 2024 05:15:21 +0200 +0s ... 0s

#5 composed specs +0.005s ... 0.005s

#6 did output specs +0s ... 0.005s

#7 getting avg benchmarks for device 14966 +0.004s ... 0.009s

#8 got single benchmarks 14966 +0.005s ... 0.014s

#9 getting avg benchmarks for device 11553 +0.004s ... 0.017s

#10 got single benchmarks 11553 +0.005s ... 0.022s

#11 getting avg benchmarks for device 14996 +0.003s ... 0.025s

#12 got single benchmarks 14996 +0.004s ... 0.03s

#13 got avg benchmarks for devices +0s ... 0.03s

#14 min, max, avg, median took s +0.075s ... 0.104s

#15 return log +0s ... 0.104s

Please share our article, every link counts!
> Expert Reviews and News on Laptops, Smartphones and Tech Innovations > Benchmarks / Tech > Processor Comparison - Head 2 Head
Redaktion, 2017-09- 8 (Update: 2023-07- 1)