Intel Core i5-13400F vs Intel Core i7-13700HX vs Intel Core i5-13450HX
Intel Core i5-13400F ► remove from comparison
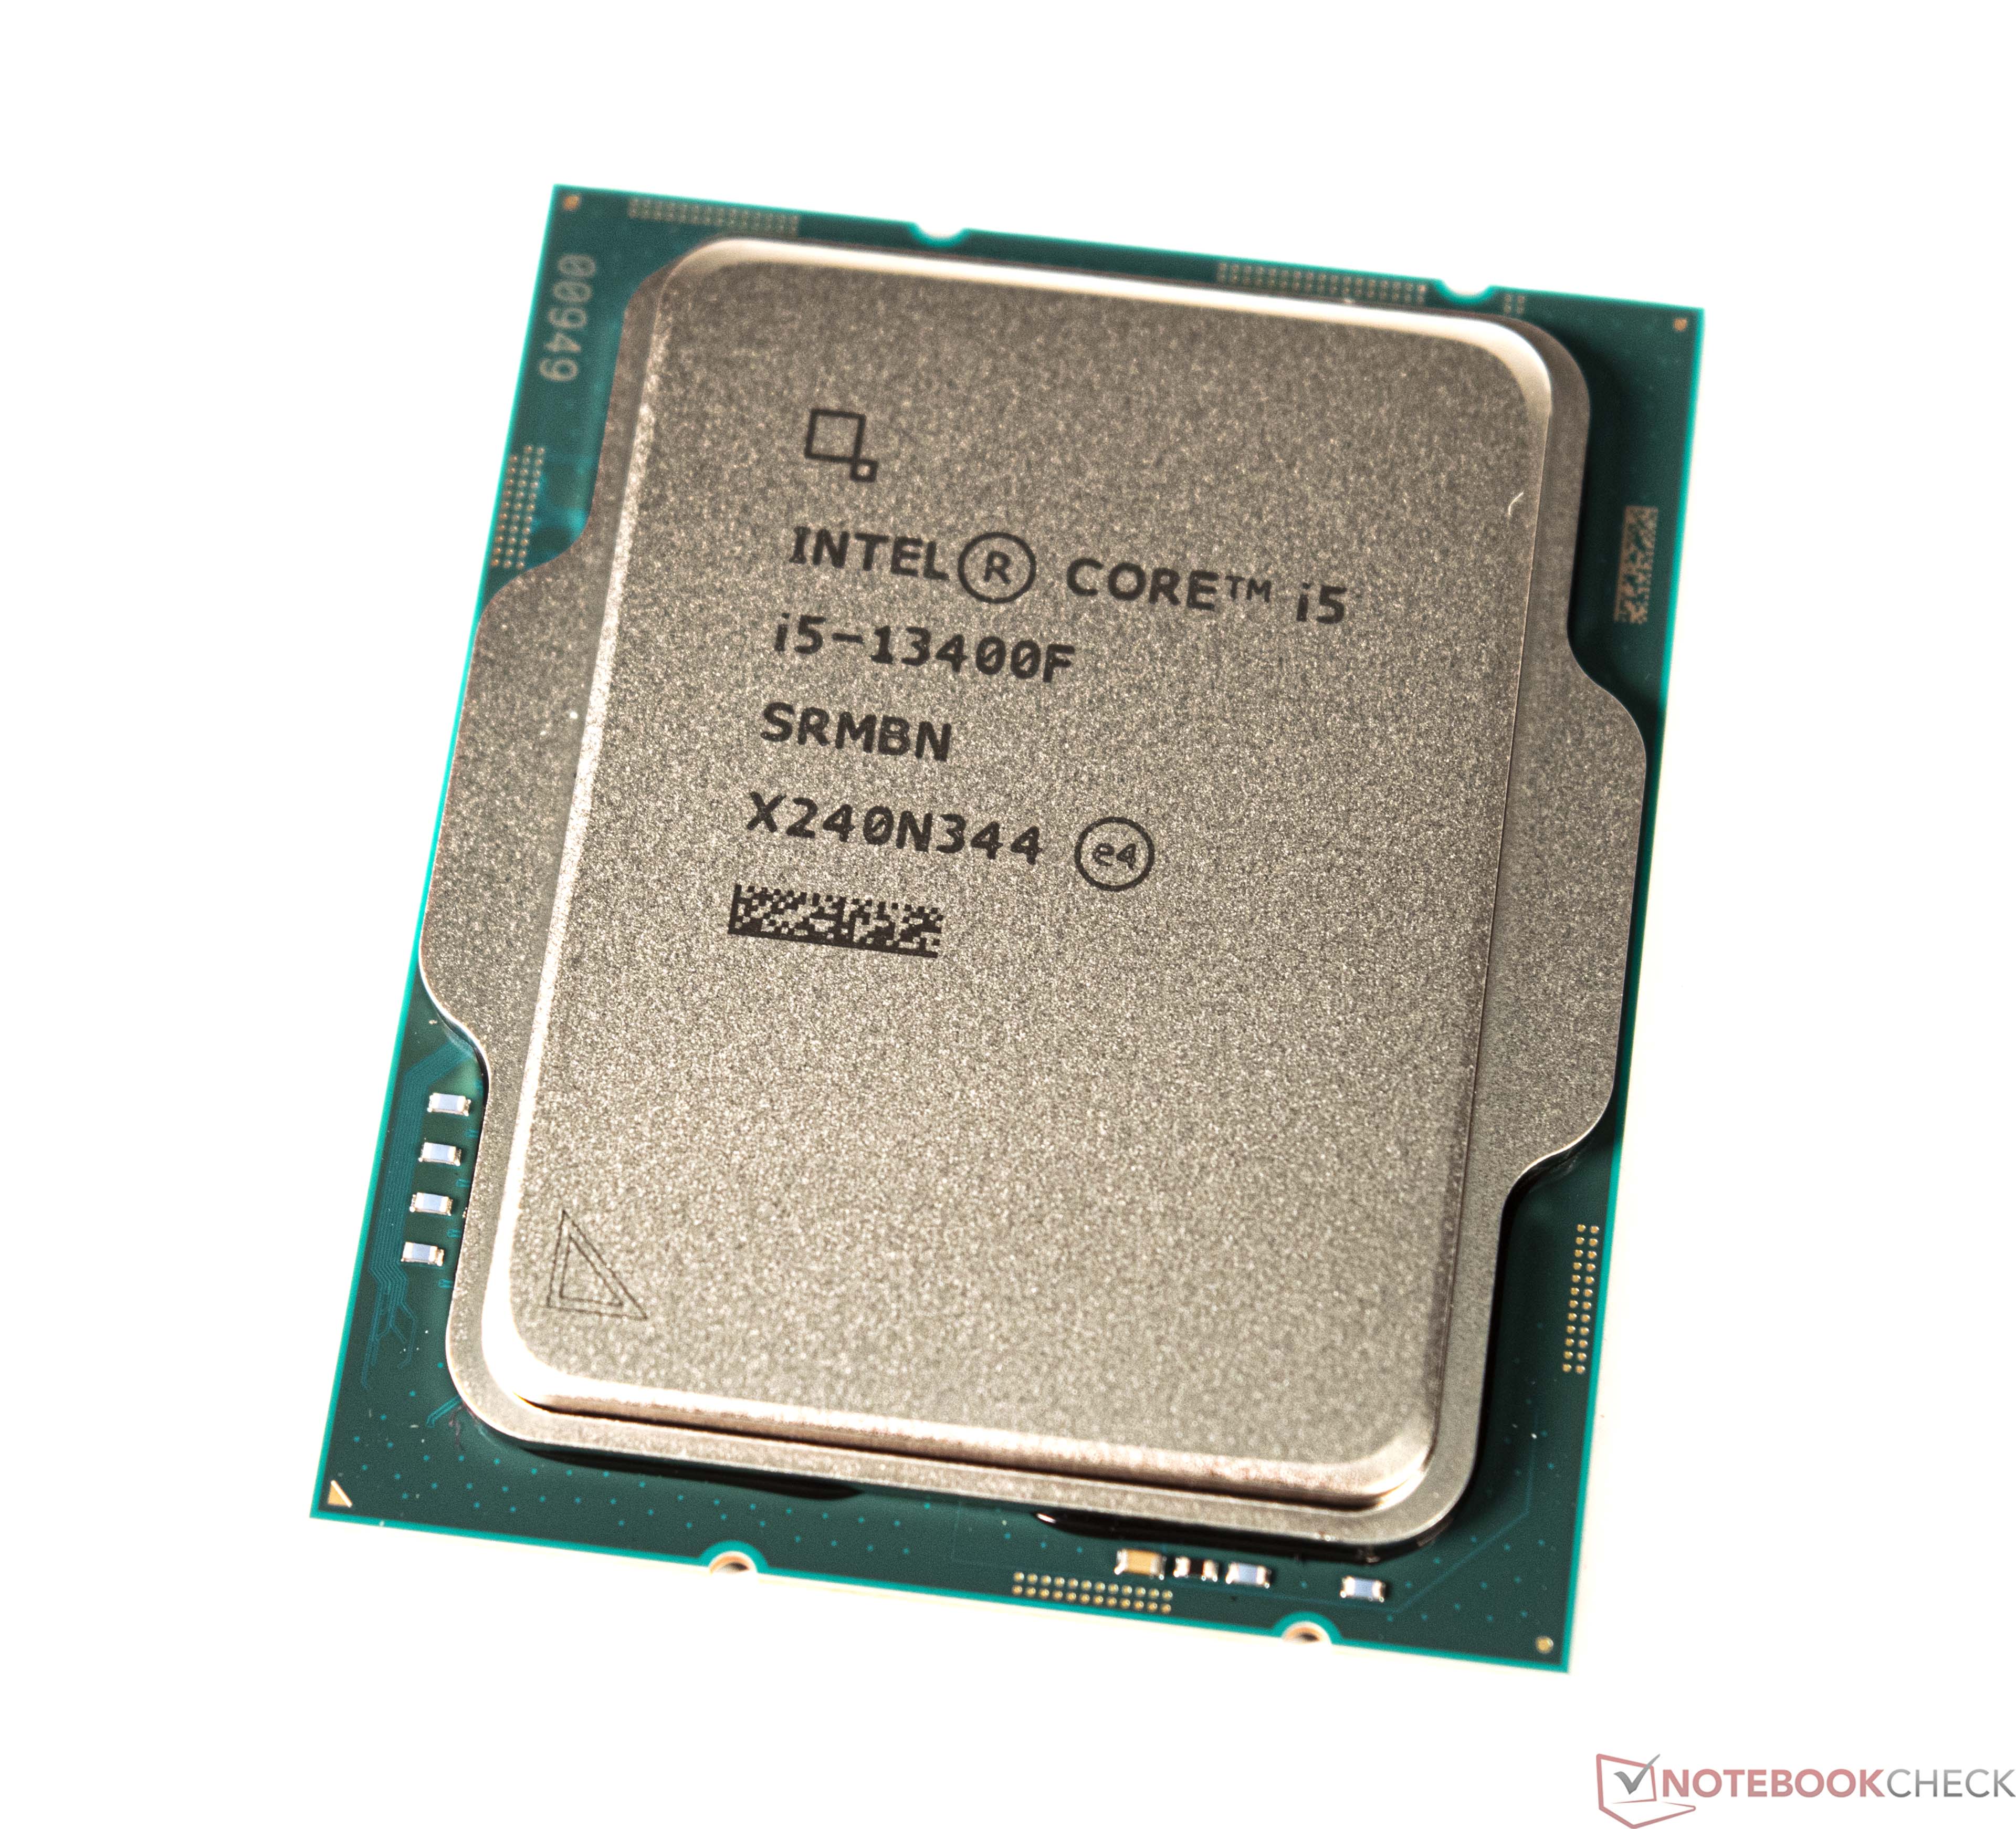
The Intel Core i5-13400F is a mid-range desktop processor of the Raptor Lake series. It includes a hybrid architecture for the CPU cores with combined 10 cores. Six fast Golden Cove / Raptor Cove performance cores (P-cores) with HyperThreading and a clock speed of 3.5 - 5.1 GHz and four Gracemont efficiency cores without HyperThreading and a clock speed of 2.6 - 3.9 GHz. The 13400F can be based on the older Alder Lake chips (at least for early models) or the newer Raptor Lake chips. The F-series of CPUs do not integrate a iGPU.
The performance is clearly higher than the old Core i5-12400F due to the additional four E-cores. These help in multi-threaded workloads and the higher boost core of the p-cores help for single threaded workloads.
The power consumption of the 13400F is rated at 65 Watt for sustained workloads (PL1) and 148 Watt for short bursts (PL2).
Intel Core i7-13700HX ► remove from comparison
The Intel Core i7-13700HX is a fast high-end mobile processor of the Raptor Lake series. Is was announced in early 2023 and is based on the desktop Core i7-13700K with combined 16 cores and 24 threads. Eight fast Raptor Cove performance cores (P-cores) with HyperThreading clocking between 2.1 - 5 GHz (4.5 GHz all core boost) and eight Gracemont efficiency cores without HyperThreading (1.5 - 3.7 GHz).
Compared to Alder Lake, Raptor Lake offers improved P-Cores (Raptor Cove micro-architecture) with bigger Caches and more E-Cores (same Gracemont micro-architecture). Furthermore, the chip supports faster DDR5 memory (up to 5600 MHz for the 13980HX, but only 4800 MHz for the i7).
Performance
The average 13700HX in our database is in the same league as the i7-13650HX , as far as multi-thread benchmark scores are concerned, and thus outguns the Ryzen 7 7745HX by a significant margin. This is a very fast chip, as of early 2023.
Thanks to its powerful cooling solution and a long-term CPU power limit of 122 W, the Uniwill GM6PX7X is among the fastest laptops built around the 13700HX that we know of. It can be at least 10% faster in CPU-bound workloads than the slowest system featuring the same chip in our database, as of August 2023.
Power consumption
The chip's "minimum assured" power consumption sits at 45 W. Its Turbo power consumption is not supposed to exceed 157 W; its Base power consumption is supposed to be around 55 W. Most laptop makers will probably go for a value much higher than 55 W to get better performance.
This Raptor Lake family processor is built with Intel's 4th generation 10 nm process marketed as Intel 7 for average, as of early 2023, energy efficiency.
Intel Core i5-13450HX ► remove from comparison
The Intel Core i5-13450HX is a fast mid-range mobile processor of the Raptor Lake series. Is was announced in early 2023. The CPU integrates 6 fast Raptor Cove performance cores (P-cores) with HyperThreading and 4 Gracemont efficiency cores without HyperThreading. The P-Cores clock between 2.4 GHz (base) up to 4.6 GHz (single core boost, all-core 4.5 GHz). The smaller E-Cores clock between 1.8 and 3.4 GHz. All cores can access the combined 20 MB L3 cache (compared to the 36 MB of the i9 models).
Compared to Alder Lake, Raptor Lake offers improved P-Cores (Raptor Cove micro-architecture) with bigger Caches and more E-Cores (same Gracemont micro-architecture). Furthermore, the chip supports faster DDR5 memory (up to 5600 MHz for the 13980HX, but only 4800 MHz for the i5).
Performance
While we have not tested a single system built around the 13450HX as of August 2023, we have tested several systems featuring the Core i5-12600K , a CPU with very similar specs (six P-cores mated to four E-cores, both running at insignificantly faster clock speeds than what the 13450HX has). Based on that, we expect the 13450HX to be 10% to 15% behind the Ryzen 7 7840HS and the Ryzen 9 7940HS , as far as multi-thread benchmark scores are concerned.
Your mileage may vary depending on how competent the system's cooling solution is and how high the CPU power limits are.
Power consumption
The chip's "minimum assured" power consumption sits at 45 W. Its Turbo power consumption is not supposed to go over 157 W and its "base" power consumption is supposed to be around 55 W. Most laptop makers will probably go for a value much higher than 55 W to extract as much performance out of the chip as possible.
The i5-13450HX is built with Intel's 4th generation 10 nm process marketed as Intel 7 for average, as of early 2023, energy efficiency.
Model Intel Core i5-13400F Intel Core i7-13700HX Intel Core i5-13450HX Series Intel Raptor Lake-S Intel Raptor Lake-HX Intel Raptor Lake-HX Codename Raptor Lake-S Raptor Lake-HX Raptor Lake-HX Series: Raptor Lake-HX Raptor Lake-HX Clock 2500 - 4600 MHz 1500 - 5000 MHz 1800 - 4600 MHz L1 Cache 0.1 MB L2 Cache 9.5 MB 24 MB L3 Cache 20 MB 30 MB 20 MB Cores / Threads 10 / 16 16 / 24 10 / 16 TDP 65 Watt 55 Watt 55 Watt Technology 10 nm 10 nm 10 nm Die Size 257 mm2 257 mm2 257 mm2 max. Temp. 100 °C 100 °C 100 °C Socket LGA 1700 BGA1964 BGA1964 Features Intel SSE4.1, Intel SSE4.2, Intel AVX2 DDR4-3200/DDR5-4800 RAM, PCIe 5, Thr. Director, DL Boost, GNA, MMX, SSE, SSE2, SSE3, SSSE3, SSE4.1, SSE4.2, AVX, AVX2, BMI2, ABM, FMA, ADX, VMX, SMEP, SMAP, EIST, TM1, TM2, HT, Turbo, SST, AES-NI, RDRAND, RDSEED, SHA DDR4-3200/DDR5-4800 RAM, PCIe 5, Thr. Director, DL Boost, GNA, MMX, SSE, SSE2, SSE3, SSSE3, SSE4.1, SSE4.2, AVX, AVX2, BMI2, ABM, FMA, ADX, SMEP, SMAP, EIST, TM1, TM2, HT, Turbo, SST, AES-NI, RDRAND, RDSEED, SHA Architecture x86 x86 x86 $196 U.S. Announced Manufacturer ark.intel.com ark.intel.com ark.intel.com iGPU Intel UHD Graphics 770 ( - 1550 MHz)Intel UHD Graphics Xe 16EUs (Tiger Lake-H) ( - 1450 MHz)
Benchmarks Performance Rating - CB R15 + R20 + 7-Zip + X265 + Blender + 3DM11 CPU - i5-13400F
42.5 pt (59%)
...
Intel Core i5-13500
...
Performance Rating - CB R15 + R20 + 7-Zip + X265 + Blender + 3DM11 CPU - i7-13700HX
46.8 pt (65%)
...
...
Performance Rating - CB R15 + R20 + 7-Zip + X265 + Blender + 3DM11 CPU - i5-13450HX
42 pt (58%)
...
Intel Core i5-13500
...
Cinebench 2024 - Cinebench 2024 CPU Single Core
112 Points (78%)
101.5 Points (70%)
CPU TDP 60 W TDP 135 W 91% 100%
Cinebench 2024 - Cinebench 2024 CPU Multi Core
971 Points (18%)
812 Points (15%)
CPU TDP 60 W TDP 135 W 84% 100%
Cinebench R23 - Cinebench R23 Multi Core
15911 Points (15%)
min: 19987 avg: 21150 median: 20997.5 (19%) max: 22598 Points
CPU TDP ? TDP 65 W TDP 70 W TDP 80 W TDP 90 W TDP 115 W TDP 117 W TDP 122 W TDP 135 W TDP 157 W 99% 80% 90% 91% 89% 100% 88% 95% 97% 97%
min: 16575 avg: 16686 median: 16686 (15%) max: 16797 Points
CPU TDP ? TDP 55 W TDP 60 W TDP 65 W TDP 70 W TDP 80 W TDP 90 W TDP 115 W TDP 117 W TDP 122 W TDP 135 W TDP 157 W 99% 73% 74% 80% 90% 91% 82% 100% 88% 95% 97% 97%
Cinebench R23 - Cinebench R23 Single Core
1744 Points (74%)
min: 1666 avg: 1842 median: 1882 (80%) max: 1933 Points
CPU TDP ? TDP 65 W TDP 70 W TDP 80 W TDP 90 W TDP 115 W TDP 117 W TDP 122 W TDP 135 W TDP 157 W 97% 88% 98% 98% 96% 98% 86% 94% 99% 100%
min: 1710 avg: 1738 median: 1738 (74%) max: 1766 Points
CPU TDP ? TDP 55 W TDP 60 W TDP 65 W TDP 70 W TDP 80 W TDP 90 W TDP 115 W TDP 117 W TDP 122 W TDP 135 W TDP 157 W 97% 91% 88% 88% 98% 98% 93% 98% 86% 94% 99% 100%
Cinebench R20 - Cinebench R20 CPU (Single Core)
672 Points (75%)
min: 644 avg: 711 median: 724.5 (81%) max: 740 Points
CPU TDP ? TDP 65 W TDP 70 W TDP 80 W TDP 90 W TDP 115 W TDP 117 W TDP 122 W TDP 135 W TDP 157 W 98% 89% 98% 98% 97% 99% 88% 96% 100% 100%
min: 652 avg: 666 median: 666 (74%) max: 680 Points
CPU TDP ? TDP 55 W TDP 60 W TDP 65 W TDP 70 W TDP 80 W TDP 90 W TDP 115 W TDP 117 W TDP 122 W TDP 135 W TDP 157 W 98% 92% 88% 89% 98% 98% 94% 99% 88% 96% 100% 100%
Cinebench R20 - Cinebench R20 CPU (Multi Core)
6091 Points (15%)
min: 6889 avg: 7981 median: 7966 (19%) max: 8610 Points
CPU TDP ? TDP 65 W TDP 70 W TDP 80 W TDP 90 W TDP 115 W TDP 117 W TDP 122 W TDP 135 W TDP 157 W 100% 80% 91% 91% 89% 99% 80% 96% 97% 94%
min: 6489 avg: 6511 median: 6510.5 (16%) max: 6532 Points
CPU TDP ? TDP 55 W TDP 60 W TDP 65 W TDP 70 W TDP 80 W TDP 90 W TDP 115 W TDP 117 W TDP 122 W TDP 135 W TDP 157 W 100% 75% 76% 80% 91% 91% 83% 99% 80% 96% 97% 94%
Cinebench R15 - Cinebench R15 CPU Multi 64 Bit
2364 Points (15%)
min: 3008 avg: 3288 median: 3324 (21%) max: 3482 Points
CPU TDP ? TDP 65 W TDP 70 W TDP 80 W TDP 90 W TDP 115 W TDP 117 W TDP 122 W TDP 135 W TDP 157 W 98% 80% 99% 89% 86% 98% 93% 95% 100% 91%
min: 2427 avg: 2465 median: 2465 (16%) max: 2503 Points
CPU TDP ? TDP 55 W TDP 60 W TDP 65 W TDP 70 W TDP 80 W TDP 90 W TDP 115 W TDP 117 W TDP 122 W TDP 135 W TDP 157 W 98% 70% 72% 80% 99% 89% 79% 98% 93% 95% 100% 91%
Cinebench R15 - Cinebench R15 CPU Single 64 Bit
252 Points (76%)
min: 243 avg: 269 median: 272.5 (82%) max: 279 Points
CPU TDP ? TDP 65 W TDP 70 W TDP 80 W TDP 90 W TDP 115 W TDP 117 W TDP 122 W TDP 135 W TDP 157 W 98% 89% 99% 100% 95% 97% 95% 94% 99% 99%
min: 239 avg: 245 median: 245 (74%) max: 251 Points
CPU TDP ? TDP 55 W TDP 60 W TDP 65 W TDP 70 W TDP 80 W TDP 90 W TDP 115 W TDP 117 W TDP 122 W TDP 135 W TDP 157 W 98% 90% 86% 89% 99% 100% 92% 97% 95% 94% 99% 99%
Cinebench R11.5 - Cinebench R11.5 CPU Multi 64 Bit
27.5 Points (36%)
29.2 Points (38%)
CPU TDP 55 W TDP 65 W 100% 94%
Cinebench R11.5 - Cinebench R11.5 CPU Single 64 Bit
3.1 Points (76%)
3.1 Points (76%)
CPU TDP 55 W TDP 65 W 100% 100%
Cinebench R10 - Cinebench R10 Rend. Single (32bit)
8689 Points (52%)
9840 Points (59%)
CPU TDP 55 W TDP 65 W 100% 88%
Cinebench R10 - Cinebench R10 Rend. Multi (32bit)
51113 Points (37%)
58749 Points (43%)
CPU TDP 55 W TDP 65 W 100% 87%
Cinebench R10 - Cinebench R10 Rend. Multi (64bit)
82988 Points (58%)
Cinebench R10 - Cinebench R10 Rend. Single (64bit)
13947 Points (17%)
wPrime 2.10 - wPrime 2.0 1024m *
367.9 s (4%)
wPrime 2.10 - wPrime 2.0 32m *
3.3 s (1%)
8602 Points (14%)
6830 Points (11%)
CPU TDP 55 W TDP 65 W 79% 100%
7-Zip 18.03 - 7-Zip 18.03 Multli Thread 4 runs
60048 MIPS (34%)
min: 72220 avg: 79565 median: 78488 (45%) max: 89294 MIPS
CPU TDP ? TDP 65 W TDP 70 W TDP 80 W TDP 90 W TDP 115 W TDP 117 W TDP 122 W TDP 135 W TDP 157 W 100% 74% 84% 88% 87% 92% 87% 97% 81% 93%
min: 59026 avg: 60419 median: 60418.5 (35%) max: 61811 MIPS
CPU TDP ? TDP 55 W TDP 60 W TDP 65 W TDP 70 W TDP 80 W TDP 90 W TDP 115 W TDP 117 W TDP 122 W TDP 135 W TDP 157 W 100% 69% 66% 74% 84% 88% 78% 92% 87% 97% 81% 93%
7-Zip 18.03 - 7-Zip 18.03 Single Thread 4 runs
5743 MIPS (69%)
min: 5552 avg: 6125 median: 6201.5 (74%) max: 6409 MIPS
CPU TDP ? TDP 65 W TDP 70 W TDP 80 W TDP 90 W TDP 115 W TDP 117 W TDP 122 W TDP 135 W TDP 157 W 96% 88% 100% 99% 93% 97% 89% 95% 99% 100%
min: 5370 avg: 5471 median: 5470.5 (65%) max: 5571 MIPS
CPU TDP ? TDP 55 W TDP 60 W TDP 65 W TDP 70 W TDP 80 W TDP 90 W TDP 115 W TDP 117 W TDP 122 W TDP 135 W TDP 157 W 96% 87% 84% 88% 100% 99% 90% 97% 89% 95% 99% 100%
X264 HD Benchmark 4.0 - x264 Pass 2
136.9 fps (48%)
141.7 fps (49%)
CPU TDP 55 W TDP 65 W 100% 97%
X264 HD Benchmark 4.0 - x264 Pass 1
314.5 fps (73%)
324.6 fps (75%)
CPU TDP 55 W TDP 65 W 100% 97%
HWBOT x265 Benchmark v2.2 - HWBOT x265 4k Preset
19.2 fps (34%)
min: 19.7 avg: 22.6 median: 22.3 (39%) max: 25.5 fps
CPU TDP ? TDP 65 W TDP 70 W TDP 80 W TDP 90 W TDP 115 W TDP 117 W TDP 122 W TDP 135 W TDP 157 W 100% 78% 77% 87% 83% 93% 95% 96% 85% 88%
min: 16.9 avg: 17.2 median: 17.2 (30%) max: 17.5 fps
CPU TDP ? TDP 55 W TDP 60 W TDP 65 W TDP 70 W TDP 80 W TDP 90 W TDP 115 W TDP 117 W TDP 122 W TDP 135 W TDP 157 W 100% 66% 69% 78% 77% 87% 82% 93% 95% 96% 85% 88%
TrueCrypt - TrueCrypt Serpent
1.1 GB/s (0%)
1 GB/s (0%)
CPU TDP 55 W TDP 65 W 91% 100%
TrueCrypt - TrueCrypt Twofish
2 GB/s (34%)
1.6 GB/s (28%)
CPU TDP 55 W TDP 65 W 80% 100%
TrueCrypt - TrueCrypt AES
12.2 GB/s (32%)
13.5 GB/s (35%)
CPU TDP 55 W TDP 65 W 100% 90%
Blender - Blender 3.3 Classroom CPU *
336 Seconds (4%)
min: 240 avg: 278.9 median: 270.5 (3%) max: 345 Seconds
CPU TDP ? TDP 65 W TDP 70 W TDP 80 W TDP 90 W TDP 115 W TDP 117 W TDP 122 W TDP 135 W TDP 157 W 101% 100% 100% 101% 101% 101% 101% 101% 101% 101%
min: 387 avg: 392 median: 392 (5%) max: 397 Seconds
CPU TDP ? TDP 55 W TDP 60 W TDP 65 W TDP 70 W TDP 80 W TDP 90 W TDP 115 W TDP 117 W TDP 122 W TDP 135 W TDP 157 W 102% 100% 100% 101% 101% 101% 101% 102% 102% 102% 102% 102%
Blender - Blender 2.79 BMW27 CPU *
206 Seconds (1%)
min: 138 avg: 161.4 median: 159 (1%) max: 198 Seconds
CPU TDP ? TDP 65 W TDP 70 W TDP 80 W TDP 115 W TDP 117 W TDP 122 W TDP 135 W TDP 157 W 100% 100% 100% 100% 100% 100% 100% 100% 100%
min: 196 avg: 212.5 median: 212.5 (1%) max: 229 Seconds
CPU TDP ? TDP 55 W TDP 60 W TDP 65 W TDP 70 W TDP 80 W TDP 90 W TDP 115 W TDP 117 W TDP 122 W TDP 135 W TDP 157 W 101% 100% 100% 100% 100% 100% 100% 101% 101% 101% 101% 101%
R Benchmark 2.5 - R Benchmark 2.5 *
0.5 sec (10%)
min: 0.4274 avg: 0.5 median: 0.4 (10%) max: 0.493 sec
CPU TDP ? TDP 65 W TDP 70 W TDP 80 W TDP 90 W TDP 115 W TDP 117 W TDP 122 W TDP 135 W TDP 157 W 101% 100% 101% 101% 100% 101% 100% 100% 101% 101%
min: 0.4582 avg: 0.5 median: 0.5 (10%) max: 0.4838 sec
CPU TDP ? TDP 55 W TDP 60 W TDP 65 W TDP 70 W TDP 80 W TDP 90 W TDP 115 W TDP 117 W TDP 122 W TDP 135 W TDP 157 W 101% 101% 100% 100% 101% 101% 101% 101% 100% 101% 101% 101%
3DMark 06 - CPU - 3DMark 06 - CPU
13989 Points (30%)
min: 15688 avg: 17169 median: 17038 (36%) max: 18780 Points
CPU TDP 65 W TDP 70 W TDP 157 W 96% 92% 100%
14017 Points (30%)
CPU TDP 55 W TDP 65 W TDP 70 W TDP 157 W 82% 96% 92% 100%
Super Pi mod 1.5 XS 1M - Super Pi mod 1.5 XS 1M *
8 s (2%)
7.2 s (2%)
CPU TDP 55 W TDP 65 W 100% 100%
Super Pi mod 1.5 XS 2M - Super Pi mod 1.5 XS 2M *
17.9 s (1%)
15.9 s (1%)
CPU TDP 55 W TDP 65 W 100% 100%
Super Pi Mod 1.5 XS 32M - Super Pi mod 1.5 XS 32M *
420.5 s (2%)
402 s (2%)
CPU TDP 55 W TDP 65 W 100% 100%
3DMark Vantage - 3DM Vant. Perf. CPU no Physx
77937 Points (68%)
3DMark 11 - 3DM11 Performance Physics
23820 Points (64%)
min: 21590 avg: 23818 median: 23995.5 (65%) max: 25859 Points
CPU TDP ? TDP 65 W TDP 70 W TDP 80 W TDP 90 W TDP 115 W TDP 117 W TDP 122 W TDP 135 W TDP 157 W 97% 92% 95% 83% 92% 87% 94% 100% 84% 97%
min: 21982 avg: 22135 median: 22135 (60%) max: 22288 Points
CPU TDP ? TDP 55 W TDP 60 W TDP 65 W TDP 70 W TDP 80 W TDP 90 W TDP 115 W TDP 117 W TDP 122 W TDP 135 W TDP 157 W 97% 85% 86% 92% 95% 83% 88% 87% 94% 100% 84% 97%
3DMark - 3DMark Ice Storm Physics
77765 Points (63%)
103646 Points (84%)
CPU TDP 65 W TDP 135 W 75% 100%
82893 Points (67%)
CPU TDP 55 W TDP 65 W TDP 135 W 80% 75% 100%
3DMark - 3DMark Ice Storm Extreme Physics
76636 Points (62%)
103932 Points (84%)
CPU TDP 65 W TDP 135 W 74% 100%
3DMark - 3DMark Ice Storm Unlimited Physics
80273 Points (68%)
103341 Points (87%)
CPU TDP 65 W TDP 135 W 78% 100%
3DMark - 3DMark Cloud Gate Physics
19846 Points (50%)
min: 17714 avg: 20672 median: 20745.5 (52%) max: 22722 Points
CPU TDP 65 W TDP 70 W TDP 80 W TDP 115 W TDP 135 W TDP 157 W 83% 93% 86% 99% 90% 100%
19916 Points (50%)
CPU TDP 55 W TDP 65 W TDP 70 W TDP 80 W TDP 115 W TDP 135 W TDP 157 W 88% 83% 93% 86% 99% 90% 100%
3DMark - 3DMark Fire Strike Standard Physics
28087 Points (50%)
min: 30988 avg: 34044 median: 33720 (60%) max: 36417 Points
CPU TDP ? TDP 65 W TDP 70 W TDP 80 W TDP 90 W TDP 115 W TDP 117 W TDP 122 W TDP 135 W TDP 157 W 100% 84% 91% 85% 90% 94% 97% 99% 91% 97%
min: 27233 avg: 27414 median: 27414 (49%) max: 27595 Points
CPU TDP ? TDP 55 W TDP 60 W TDP 65 W TDP 70 W TDP 80 W TDP 90 W TDP 115 W TDP 117 W TDP 122 W TDP 135 W TDP 157 W 100% 76% 75% 84% 91% 85% 84% 94% 97% 99% 91% 97%
3DMark - 3DMark Time Spy CPU
12669 Points (53%)
min: 12569 avg: 14765 median: 14971.5 (63%) max: 16441 Points
CPU TDP ? TDP 65 W TDP 70 W TDP 80 W TDP 90 W TDP 115 W TDP 117 W TDP 122 W TDP 135 W TDP 157 W 100% 82% 92% 83% 88% 92% 90% 99% 76% 92%
min: 12644 avg: 12884 median: 12883.5 (54%) max: 13123 Points
CPU TDP ? TDP 55 W TDP 60 W TDP 65 W TDP 70 W TDP 80 W TDP 90 W TDP 115 W TDP 117 W TDP 122 W TDP 135 W TDP 157 W 100% 77% 80% 82% 92% 83% 84% 92% 90% 99% 76% 92%
Geekbench 6.2 - Geekbench 6.2 Single-Core
min: 2541 avg: 2591 median: 2593 (70%) max: 2638 Points
CPU TDP ? TDP 135 W TDP 157 W 98% 96% 100%
min: 2381 avg: 2415 median: 2414.5 (65%) max: 2448 Points
CPU TDP ? TDP 55 W TDP 60 W TDP 90 W TDP 135 W TDP 157 W 98% 93% 90% 92% 96% 100%
Geekbench 6.2 - Geekbench 6.2 Multi-Core
min: 11793 avg: 13739 median: 14402 (57%) max: 15022 Points
CPU TDP ? TDP 135 W TDP 157 W 100% 79% 96%
min: 12619 avg: 12652 median: 12651.5 (50%) max: 12684 Points
CPU TDP ? TDP 55 W TDP 60 W TDP 90 W TDP 135 W TDP 157 W 100% 84% 84% 85% 79% 96%
Geekbench 5.5 - Geekbench 5.1 - 5.4 64 Bit Single-Core
1792 Points (76%)
min: 1666 avg: 1834 median: 1852.5 (78%) max: 1899 Points
CPU TDP ? TDP 65 W TDP 70 W TDP 80 W TDP 90 W TDP 115 W TDP 117 W TDP 122 W TDP 135 W TDP 157 W 100% 91% 98% 99% 99% 100% 94% 96% 96% 97%
min: 1696 avg: 1730 median: 1729.5 (73%) max: 1763 Points
CPU TDP ? TDP 55 W TDP 60 W TDP 65 W TDP 70 W TDP 80 W TDP 90 W TDP 115 W TDP 117 W TDP 122 W TDP 135 W TDP 157 W 100% 93% 89% 91% 98% 99% 96% 100% 94% 96% 96% 97%
Geekbench 5.5 - Geekbench 5.1 - 5.4 64 Bit Multi-Core
12095 Points (22%)
min: 12389 avg: 14660 median: 14695 (26%) max: 15850 Points
CPU TDP ? TDP 65 W TDP 70 W TDP 80 W TDP 90 W TDP 115 W TDP 117 W TDP 122 W TDP 135 W TDP 157 W 100% 83% 96% 91% 94% 98% 89% 98% 78% 91%
min: 12005 avg: 12014 median: 12013.5 (22%) max: 12022 Points
CPU TDP ? TDP 55 W TDP 60 W TDP 65 W TDP 70 W TDP 80 W TDP 90 W TDP 115 W TDP 117 W TDP 122 W TDP 135 W TDP 157 W 100% 76% 76% 83% 96% 91% 85% 98% 89% 98% 78% 91%
Geekbench 5.0 - Geekbench 5.0 64 Bit Single-Core
1721 Points (7%)
min: 1712 avg: 1786 median: 1788.5 (8%) max: 1855 Points
CPU TDP 65 W TDP 90 W TDP 115 W TDP 117 W TDP 122 W 93% 99% 100% 92% 94%
Geekbench 5.0 - Geekbench 5.0 64 Bit Multi-Core
12009 Points (38%)
min: 13815 avg: 14802 median: 15008.5 (47%) max: 15376 Points
CPU TDP 65 W TDP 90 W TDP 115 W TDP 117 W TDP 122 W 78% 96% 99% 90% 100%
Geekbench 4.4 - Geekbench 4.1 - 4.4 64 Bit Single-Core
7684 Points (77%)
8059 Points (81%)
CPU TDP 65 W TDP 115 W 95% 100%
Geekbench 4.4 - Geekbench 4.1 - 4.4 64 Bit Multi-Core
43856 Points (48%)
57031 Points (63%)
CPU TDP 65 W TDP 115 W 77% 100%
Geekbench 4.0 - Geekbench 4.0 64 Bit Single-Core
7348 Points (100%)
Geekbench 4.0 - Geekbench 4.0 64 Bit Multi-Core
41034 Points (100%)
Mozilla Kraken 1.1 - Kraken 1.1 Total Score *
535 ms (1%)
min: 489 avg: 508 median: 503.5 (1%) max: 538 ms
CPU TDP ? TDP 65 W TDP 70 W TDP 80 W TDP 90 W TDP 115 W TDP 117 W TDP 122 W TDP 135 W TDP 157 W 100% 100% 100% 100% 100% 100% 100% 100% 100% 100%
min: 531 avg: 537 median: 531 (1%) max: 550 ms
CPU TDP ? TDP 55 W TDP 60 W TDP 65 W TDP 70 W TDP 80 W TDP 90 W TDP 115 W TDP 117 W TDP 122 W TDP 135 W TDP 157 W 100% 100% 100% 100% 100% 100% 100% 100% 100% 100% 100% 100%
Octane V2 - Octane V2 Total Score
min: 86875 avg: 92028 median: 92283 (81%) max: 96670 Points
CPU TDP 65 W TDP 70 W TDP 115 W TDP 157 W 90% 100% 100% 91%
87588 Points (77%)
CPU TDP 60 W TDP 65 W TDP 70 W TDP 115 W TDP 157 W 91% 90% 100% 100% 91%
WebXPRT 4 - WebXPRT 4 Score
254 Points (73%)
min: 247 avg: 267.4 median: 270.5 (78%) max: 283 Points
CPU TDP 65 W TDP 70 W TDP 90 W TDP 115 W TDP 117 W TDP 122 W TDP 135 W TDP 157 W 89% 96% 94% 100% 87% 97% 95% 99%
243 Points (70%)
CPU TDP 60 W TDP 65 W TDP 70 W TDP 90 W TDP 115 W TDP 117 W TDP 122 W TDP 135 W TDP 157 W 86% 89% 96% 94% 100% 87% 97% 95% 99%
WebXPRT 3 - WebXPRT 3 Score
294 Points (61%)
min: 238 avg: 304.1 median: 316 (66%) max: 336 Points
CPU TDP ? TDP 65 W TDP 70 W TDP 80 W TDP 90 W TDP 115 W TDP 117 W TDP 122 W TDP 157 W 94% 86% 96% 96% 88% 100% 71% 94% 90%
min: 262 avg: 274.7 median: 281 (59%) max: 281 Points
CPU TDP ? TDP 55 W TDP 60 W TDP 65 W TDP 70 W TDP 80 W TDP 90 W TDP 115 W TDP 117 W TDP 122 W TDP 157 W 94% 84% 78% 86% 96% 96% 88% 100% 71% 94% 90%
CrossMark - CrossMark Overall
1941 Points (74%)
min: 1663 avg: 1875 median: 1831 (70%) max: 2105 Points
CPU TDP 65 W TDP 70 W TDP 80 W TDP 90 W TDP 115 W TDP 117 W TDP 122 W TDP 135 W TDP 157 W 88% 98% 87% 81% 100% 79% 93% 81% 98%
1804 Points (69%)
CPU TDP 60 W TDP 65 W TDP 70 W TDP 80 W TDP 90 W TDP 115 W TDP 117 W TDP 122 W TDP 135 W TDP 157 W 86% 88% 98% 87% 81% 100% 79% 93% 81% 98%
Power Consumption - Prime95 Power Consumption - external Monitor *
214 Watt (37%)
min: 100.4 avg: 157.7 median: 166.5 (29%) max: 189.7 Watt
CPU TDP 65 W TDP 70 W TDP 80 W TDP 90 W TDP 115 W TDP 117 W TDP 122 W TDP 135 W TDP 157 W 108% 120% 107% 102% 106% 104% 100% 106% 106%
min: 108.7 avg: 134.8 median: 134.8 (23%) max: 160.8 Watt
CPU TDP 55 W TDP 60 W TDP 65 W TDP 70 W TDP 80 W TDP 90 W TDP 115 W TDP 117 W TDP 122 W TDP 135 W TDP 157 W 107% 121% 108% 120% 107% 102% 106% 104% 100% 106% 106%
Power Consumption - Cinebench R15 Multi Power Consumption - external Monitor *
184.2 Watt (34%)
min: 166.3 avg: 187.3 median: 183.9 (34%) max: 221 Watt
CPU TDP 65 W TDP 90 W TDP 115 W TDP 117 W TDP 122 W TDP 135 W 111% 113% 100% 111% 110% 117%
Power Consumption - Idle Power Consumption - external Monitor *
76.3 Watt (50%)
min: 12.9 avg: 22 median: 22.1 (15%) max: 28.7 Watt
CPU TDP 65 W TDP 70 W TDP 80 W TDP 90 W TDP 115 W TDP 117 W TDP 122 W TDP 135 W TDP 157 W 100% 127% 120% 125% 125% 123% 134% 119% 126%
min: 19.2 avg: 25.4 median: 25.4 (17%) max: 31.6 Watt
CPU TDP 55 W TDP 60 W TDP 65 W TDP 70 W TDP 80 W TDP 90 W TDP 115 W TDP 117 W TDP 122 W TDP 135 W TDP 157 W 116% 128% 100% 127% 120% 125% 125% 123% 134% 119% 126%
Power Consumption - Idle Power Consumption 150cd 1min *
min: 12.1 avg: 16.8 median: 15.2 (17%) max: 25.4 Watt
CPU TDP 65 W TDP 70 W TDP 80 W TDP 90 W TDP 115 W TDP 117 W TDP 122 W TDP 157 W 120% 115% 120% 103% 114% 100% 116% 117%
min: 11.5 avg: 14.8 median: 14.8 (16%) max: 18.1 Watt
CPU TDP 55 W TDP 60 W TDP 65 W TDP 70 W TDP 80 W TDP 90 W TDP 115 W TDP 117 W TDP 122 W TDP 157 W 121% 111% 120% 115% 120% 103% 114% 100% 116% 117%
Power Consumption - Cinebench R15 Multi Power Efficiency - external Monitor
min: 16.9 avg: 18.3 median: 17.7 (13%) max: 20.9 Points per Watt
CPU TDP 90 W TDP 117 W TDP 122 W TDP 135 W 81% 84% 85% 100%
Average Benchmarks Intel Core i5-13400F → 100% n=24 Average Benchmarks Intel Core i7-13700HX → 113% n=24 Average Benchmarks Intel Core i5-13450HX → 99% n=24
- Range of benchmark values for this graphics card
- Average benchmark values for this graphics card
* Smaller numbers mean a higher performance
1 This benchmark is not used for the average calculation
v1.28
log 04. 19:20:33
#0 checking url part for id 14966 +0s ... 0s
#1 checking url part for id 14661 +0s ... 0s
#2 checking url part for id 14673 +0s ... 0s
#3 redirected to Ajax server, took 1720113632 +0s ... 0s
#4 did not recreate cache, as it is less than 5 days old! Created at Thu, 04 Jul 2024 05:15:21 +0200 +0s ... 0s
#5 composed specs +0.006s ... 0.006s
#6 did output specs +0s ... 0.006s
#7 getting avg benchmarks for device 14966 +0.004s ... 0.01s
#8 got single benchmarks 14966 +0.004s ... 0.014s
#9 getting avg benchmarks for device 14661 +0.005s ... 0.019s
#10 got single benchmarks 14661 +0.018s ... 0.036s
#11 getting avg benchmarks for device 14673 +0.004s ... 0.04s
#12 got single benchmarks 14673 +0.006s ... 0.047s
#13 got avg benchmarks for devices +0s ... 0.047s
#14 min, max, avg, median took s +0.074s ... 0.12s
#15 return log +0s ... 0.12s
Please share our article, every link counts!
Redaktion, 2017-09- 8 (Update: 2023-07- 1)
 Deutsch
 English
 Español
 Français
 Italiano
 Nederlands
 Polski
 Português
 Русский
 Türkçe
 Svenska
 Chinese
 Magyar