Notebookcheck Logo

AMD Ryzen 7 5800X vs Intel Core i9-13900K vs Intel Core i5-13500

AMD Ryzen 7 5800X

► remove from comparison AMD R7 5800X

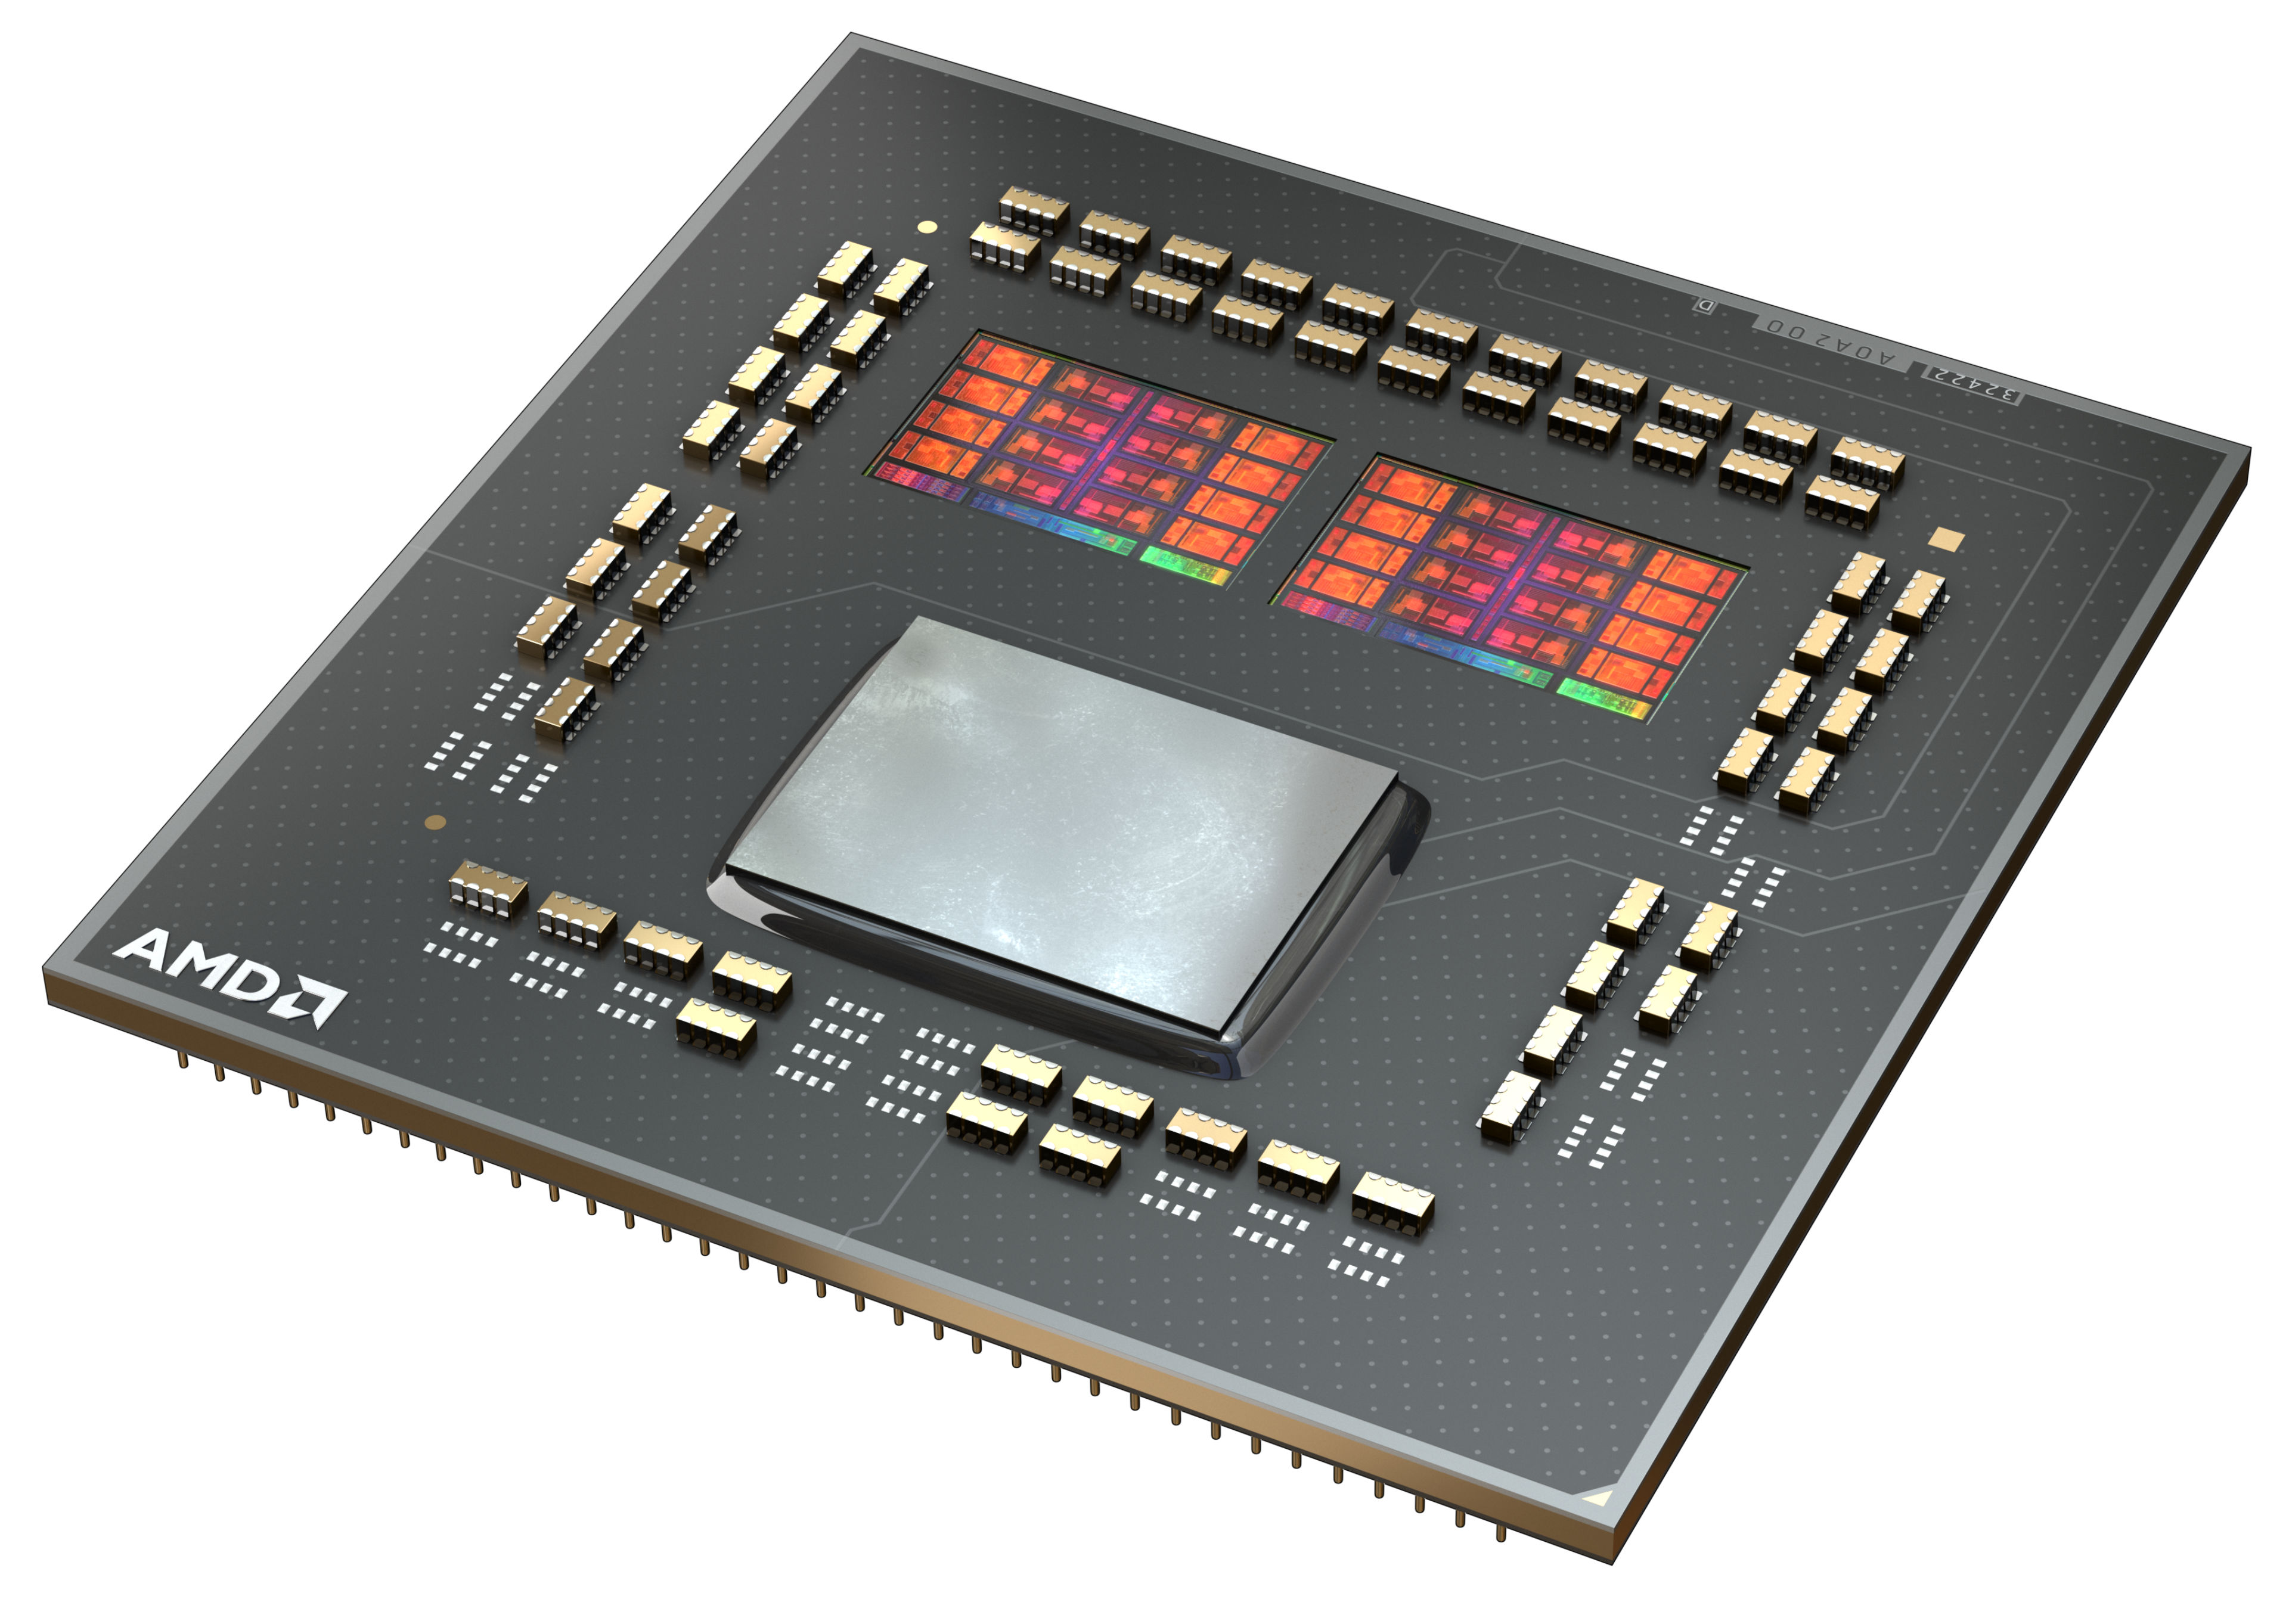
The AMD Ryzen 7 5800X is an 8-core desktop processor with Simultaneous Multithreading (SMT), which allows it to process 16 threads simultaneously. With its launch on 08.10.2020, it is the fastest 8-core processor from AMD. The second fastest 8-core processor will be the AMD Ryzen 7 3800XT, followed by the more economical AMD Ryzen 7 3700X, also with 8 cores and 16 threads.

The Ryzen 7 5800X clocks with a base clock of 3.8 GHz and reaches up to 4.7 GHz on one core in turbo mode. When all 8 cores are utilized, the AMD Ryzen 7 5800X, like the AMD Ryzen 9 5900X, achieves up to 4.5 GHz.

At first glance, the internal structure of the processor has not changed fundamentally. The CCX structure has changed somewhat compared to Zen2, because now a CCX consists of up to 8-CPU cores. So each individual core can access the complete L3 cache (32 MByte). Furthermore the CCX modules are connected to each other via the same I/O die, which we already know from Zen2. According to AMD, the Infinity-Fabric should now reach clock rates of up to 2Ghz, which in turn allows a RAM clock of 4.000 MHz without performance loss.

Performance

The average 5800X in our database is in the same league as the Core i9-10900K and also the Core i7-12700F, as far as multi-thread benchmark scores are concerned.

In games, AMD's Ryzen 7 5800X can convince with its significantly improved IPC and even put Intel in its place. With the AMD Ryzen 7 5800X, gamers are well prepared for the future as simultaneous streaming is no problem with the new Ryzen 7 5800X. Semi-professional content creators, who need even more power, can choose a Ryzen 9 5900X or the Ryzen 9 5950X on the shelf.

Power consumption

The Ryzen 7 has a default TDP (also known as the long-term power limit) of 105 W. This applies as long as the CPU runs at stock clock speeds.

Ryzen 7 5800X is built with TSMC's 7 nm process; as rumors have it, the I/O die is manufactured separately on the 12 nm Global Foundries process.

Intel Core i9-13900K

► remove from comparison Intel i9-13900K

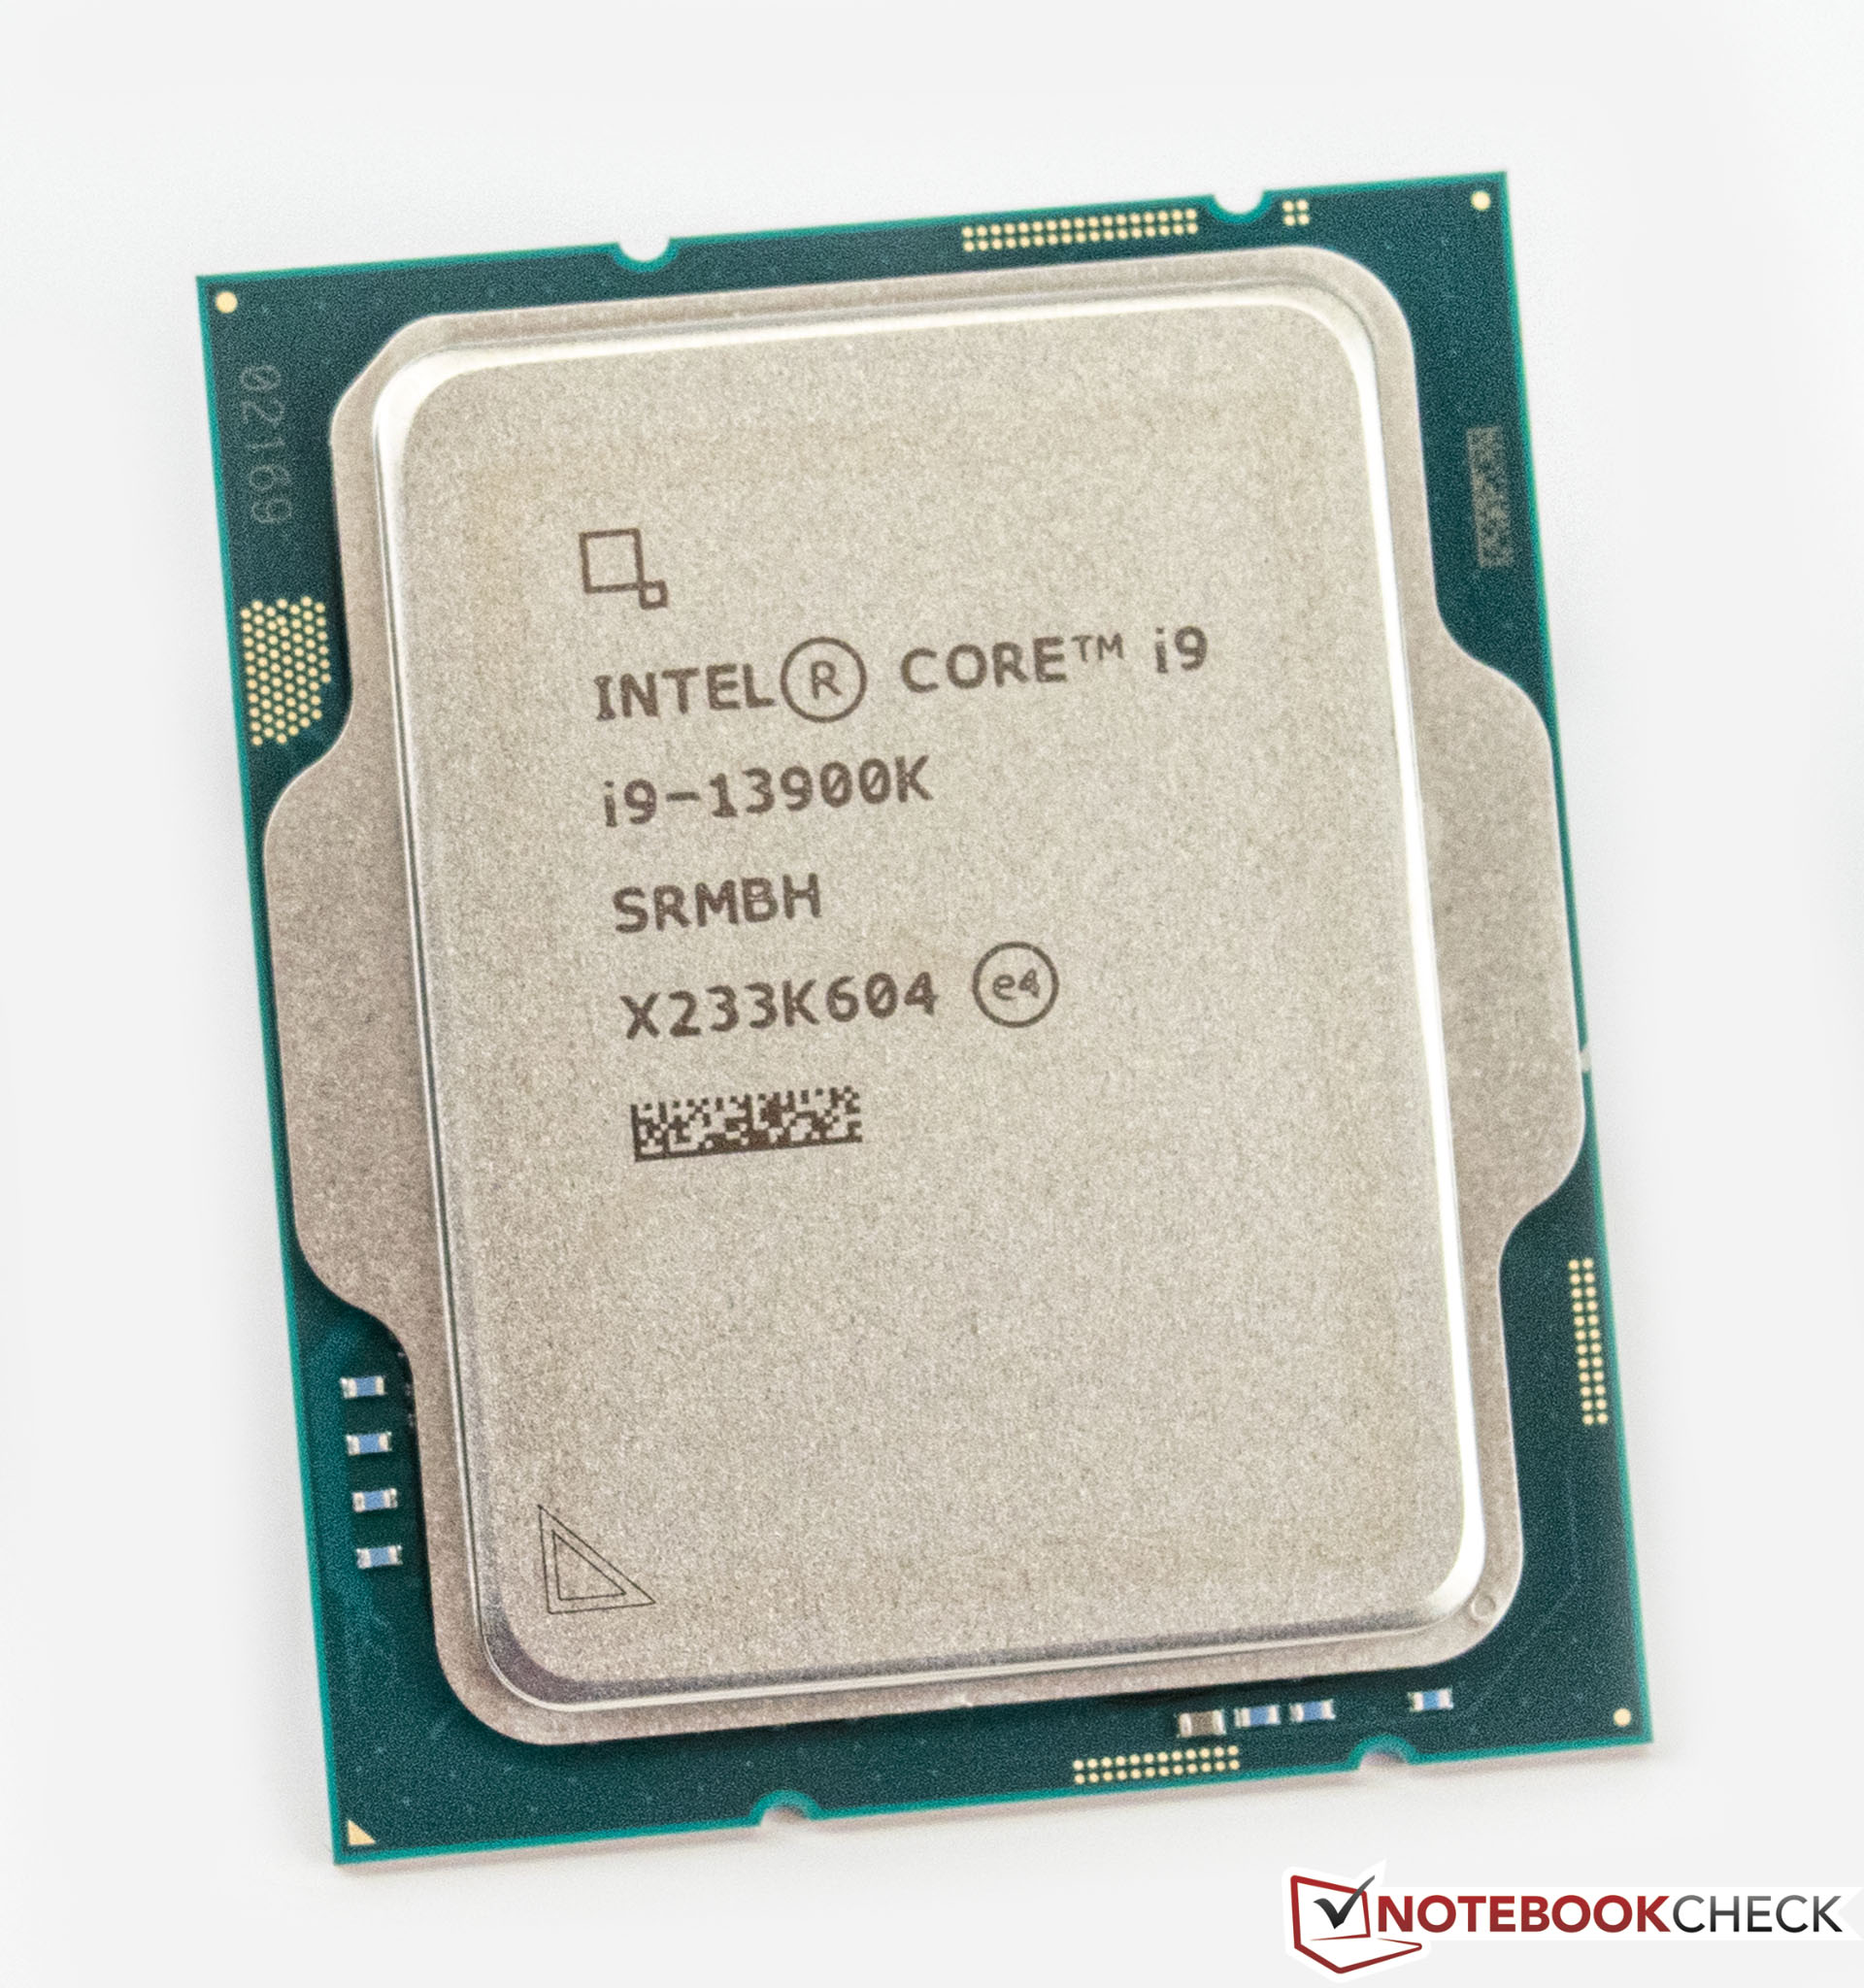
The Intel Core i9-13900K is a fast high-end desktop processor of the Raptor Lake series. It includes a hybrid architecture for the CPU cores with combined 24 cores and 32 threads. Eight fast Raptor Cove performance cores (P-cores) with HyperThreading and a clock speed of 3 - 5.8 GHz and sixteen Gracemont efficiency cores without HyperThreading and a clock speed of 2.2 - 4.3 GHz.

Thanks to the faster P-cores and more E-cores, the i9-13900K is significantly faster than the old i9-12900K (especially in multi-threaded workloads). Compared to the Raphael AMD Ryzen 9 7950X (Zen 4), the 13900K offers a slightly higher multi-thread-performance and a slightly lower single core performance. In games, the Intel CPU is currently the clear winner (at the time of announcement of the 7950X).

The 13900K is rated at 125 Watt TDP base power (PL1) and 253 Watt Turbo Power (PL2) and therefore slightly higher than the old i9-12900K.

Intel Core i5-13500

► remove from comparison

Der Intel Core i5-13500 ist ein schneller und sparsamer Desktop-Prozessor auf Basis der Raptor-Lake-Architektur, die bereits im Oktober 2022 vorgestellt wurde. Der Prozessor bietet einen Basistakt von 2,5 GHz und erreicht bis zu 4,8 GHz im Turbo. Die mit Alder-Lake eingeführte hybride CPU-Architektur kommt auch bei den Raptor-Lake-Prozessoren zum Einsatz. Im Vergleich zum Intel Core i5-12500 bietet der Intel Core i5-13500 mehr Kerne, womit eine höhere Gesamtleistung erzielt werden kann. In Summe kann der Intel Core i5-13500 bis zu 20 Threads parallel verarbeiten. Die Performance-Kerne (P-Cores) bieten hierzu Hyperthreading, was den energieeffizienten Kernen (E-Cores) vorenthalten wird.

Performance

Aufgrund der höheren Anzahl an physikalischen Recheneinheiten bietet der Intel Core i5-13500 gegenüber dem Intel Core i5-12500 spürbar mehr Leistung. Beide Prozessoren verfügen über 6 P-Kerne, wenngleich nur der Intel Core i5-13500 zusätzlich mit 8 E-Kernen bestückt ist.

Grafikeinheit

Wie auch der Intel Core i5-12600K bietet der Intel Core i5-13500 eine integrierte Grafikeinheit. Als Basis dient weiterhin die Intel Iris Xe-Architektur. Rein leistungstechnisch hat sich bei der neuen Intel UHD Graphics 770 aber nicht viel verändert. 

Leistungsaufnahme

Die TDP des Intel Core i5-13500 beläuft sich auf 65 Watt, mit der Option, diese im Turbo auf bis zu 154 Watt zu erhöhen. Gegenüber dem Intel Core i5-12500 steigt der Energiebedarf etwas an.

ModelAMD Ryzen 7 5800XIntel Core i9-13900KIntel Core i5-13500
SeriesAMD Vermeer (Ryzen 5000)Intel Raptor Lake-S Raptor Lake-S
CodenameVermeer (Zen 3)Raptor LakeRaptor Lake
Series: Raptor Lake-S Raptor Lake
AMD Ryzen 9 5950X3.4 - 4.9 GHz16 / 32 cores64 MB L3
AMD Ryzen 7 5800X « 3.8 - 4.7 GHz8 / 16 cores32 MB L3
AMD Ryzen 7 5700X3.4 - 4.6 GHz8 / 16 cores32 MB L3
AMD Ryzen 5 5600X3.7 - 4.6 GHz6 / 12 cores32 MB L3
Intel Core i9-13900K « 3 - 5.8 GHz24 / 32 cores36 MB L3
Intel Core i7-13700K3.4 - 5.4 GHz16 / 24 cores30 MB L3
Intel Core i5-13600K3.5 - 5.1 GHz14 / 20 cores24 MB L3
Intel Core i5-135002.5 - 4.8 GHz14 / 20 cores24 MB L3
Intel Core i5-13500T2.5 - 4.6 GHz14 / 20 cores24 MB L3
Intel Core i9-13900K3 - 5.8 GHz24 / 32 cores36 MB L3
Intel Core i7-13700K3.4 - 5.4 GHz16 / 24 cores30 MB L3
Intel Core i5-13600K3.5 - 5.1 GHz14 / 20 cores24 MB L3
Intel Core i5-13500 « 2.5 - 4.8 GHz14 / 20 cores24 MB L3
Intel Core i5-13500T2.5 - 4.6 GHz14 / 20 cores24 MB L3
Clock3800 - 4700 MHz3000 - 5800 MHz2500 - 4800 MHz
L1 Cache512 KB
L2 Cache4 MB32 MB11.5 MB
L3 Cache32 MB36 MB24 MB
Cores / Threads8 / 1624 / 32
8 x 5.8 GHz Intel Raptor Cove P-Core
16 x 4.3 GHz Intel Gracemont E-Core
14 / 20
6 x 4.8 GHz Intel Raptor Cove P-Core
8 x 3.5 GHz Intel Gracemont E-Core
TDP105 Watt125 Watt65 Watt
Technology7 nm10 nm10 nm
Die Size2 x 80.7 sq. mm; I/O = 125 mm2257 mm2215 mm2
max. Temp.90 °C100 °C100 °C
SocketAM4 (LGA1331)LGA 1700LGA 1700
FeaturesDDR4-3200 RAM, PCIe 4, MMX (+), SSE, SSE2, SSE3, SSSE3, SSE4.1, SSE4.2, SSE4A, AES, AVX, AVX2, FMA3, SHAIntel UHD Graphics 770, DDR5 5600 MT/s, DDR4 3200 MT/sIntel UHD Graphics 770, DDR5 4800 MT/s, DDR4 3200 MT/s
Architecturex86x86x86
$449 U.S.$589 U.S.
Announced
Manufacturerwww.amd.comwww.intel.comwww.intel.de
iGPUIntel UHD Graphics 770 (300 - 1650 MHz)Intel UHD Graphics 770 (300 - 1550 MHz)
TDP Turbo PL2154 Watt

Benchmarks

Performance Rating - CB R15 + R20 + 7-Zip + X265 + Blender + 3DM11 CPU - R7 5800X
44.8 pt (62%)
Performance Rating - CB R15 + R20 + 7-Zip + X265 + Blender + 3DM11 CPU - i9-13900K
59.3 pt (82%)
Performance Rating - CB R15 + R20 + 7-Zip + X265 + Blender + 3DM11 CPU - i5-13500
42.6 pt (59%)
Cinebench 2024 - Cinebench 2024 CPU Single Core
107 Points (74%)
Cinebench 2024 - Cinebench 2024 CPU Multi Core
822 Points (15%)
Cinebench R23 - Cinebench R23 Multi Core
min: 15241     avg: 15476     median: 15476 (14%)     max: 15711 Points
min: 32592     avg: 37310     median: 38271.5 (36%)     max: 40103 Points
14573 Points (14%)
Cinebench R23 - Cinebench R23 Single Core
min: 1554     avg: 1575     median: 1574.5 (67%)     max: 1595 Points
min: 2203     avg: 2238     median: 2238.5 (95%)     max: 2272 Points
1780 Points (76%)
Cinebench R20 - Cinebench R20 CPU (Single Core)
min: 624     avg: 625     median: 624.5 (69%)     max: 625 Points
min: 828     avg: 849     median: 849.5 (94%)     max: 870 Points
685 Points (76%)
Cinebench R20 - Cinebench R20 CPU (Multi Core)
min: 6068     avg: 6075     median: 6074.5 (15%)     max: 6081 Points
min: 13415     avg: 14459     median: 14620.5 (36%)     max: 15181 Points
5633 Points (14%)
Cinebench R15 - Cinebench R15 CPU Multi 64 Bit
min: 2601     avg: 2609     median: 2608.5 (16%)     max: 2616 Points
min: 5321     avg: 5798     median: 5805.5 (37%)     max: 6191 Points
2405 Points (15%)
Cinebench R15 - Cinebench R15 CPU Single 64 Bit
min: 265     avg: 265.5     median: 265.5 (80%)     max: 266 Points
min: 299     avg: 314.1     median: 318 (96%)     max: 328 Points
256 Points (77%)
Cinebench R11.5 - Cinebench R11.5 CPU Multi 64 Bit
29.3 Points (38%)
min: 62.2     avg: 67     median: 67.5 (88%)     max: 70.78 Points
28.4 Points (37%)
Cinebench R11.5 - Cinebench R11.5 CPU Single 64 Bit
3.1 Points (77%)
min: 3.8     avg: 3.9     median: 3.9 (96%)     max: 3.93 Points
3.1 Points (77%)
Cinebench R10 - Cinebench R10 Rend. Single (32bit)
6835 Points (41%)
min: 11661     avg: 11989     median: 12017.5 (73%)     max: 12259 Points
8875 Points (54%)
Cinebench R10 - Cinebench R10 Rend. Multi (32bit)
45548 Points (33%)
min: 85342     avg: 88253     median: 87738 (64%)     max: 92192 Points
49300 Points (36%)
Cinebench R10 - Cinebench R10 Rend. Multi (64bit)
83426 Points (58%)
min: 132000     avg: 134526     median: 133567 (93%)     max: 138969 Points
79625 Points (55%)
Cinebench R10 - Cinebench R10 Rend. Single (64bit)
13039 Points (16%)
min: 17418     avg: 17943     median: 17998.5 (22%)     max: 18355 Points
14282 Points (17%)
wPrime 2.10 - wPrime 2.0 1024m *
86.1 s (1%)
min: 79.738     avg: 84.6     median: 84.2 (1%)     max: 90.13 s
100.7 s (1%)
wPrime 2.10 - wPrime 2.0 32m *
3 s (1%)
min: 1.818     avg: 2.1     median: 2 (0%)     max: 2.305 s
4 s (1%)
WinRAR - WinRAR 4.0
15604 Points (25%)
min: 13210     avg: 14265     median: 14271 (23%)     max: 15309 Points
7704 Points (12%)
7-Zip 18.03 - 7-Zip 18.03 Multli Thread 4 runs
min: 69921     avg: 72114     median: 72113.5 (41%)     max: 74306 MIPS
min: 127201     avg: 142777     median: 146984 (84%)     max: 148053 MIPS
55528 MIPS (32%)
7-Zip 18.03 - 7-Zip 18.03 Single Thread 4 runs
min: 6843     avg: 6907     median: 6906.5 (83%)     max: 6970 MIPS
min: 7176     avg: 7343     median: 7272 (87%)     max: 7539 MIPS
5887 MIPS (70%)
X264 HD Benchmark 4.0 - x264 Pass 2
152 fps (53%)
min: 247.5     avg: 261.5     median: 264.8 (92%)     max: 269 fps
134.6 fps (47%)
X264 HD Benchmark 4.0 - x264 Pass 1
339 fps (78%)
min: 412     avg: 419     median: 419.3 (97%)     max: 425.5 fps
306 fps (71%)
HWBOT x265 Benchmark v2.2 - HWBOT x265 4k Preset
min: 19.8     avg: 20.3     median: 20.3 (36%)     max: 20.8 fps
min: 34.5     avg: 39.9     median: 40.7 (72%)     max: 42.6 fps
16.3 fps (29%)
TrueCrypt - TrueCrypt Serpent
1.3 GB/s (0%)
min: 2.6     avg: 2.9     median: 2.9 (0%)     max: 3 GB/s
1.3 GB/s (0%)
TrueCrypt - TrueCrypt Twofish
2 GB/s (34%)
min: 5.2     avg: 5.4     median: 5.4 (93%)     max: 5.4 GB/s
2.3 GB/s (40%)
TrueCrypt - TrueCrypt AES
15 GB/s (39%)
min: 20.5     avg: 23.3     median: 22.9 (60%)     max: 27 GB/s
12 GB/s (31%)
Blender - Blender 3.3 Classroom CPU *
min: 331     avg: 336     median: 336 (4%)     max: 341 Seconds
min: 136     avg: 145.2     median: 140.5 (2%)     max: 174 Seconds
399 Seconds (5%)
Blender - Blender 2.79 BMW27 CPU *
min: 196.8     avg: 196.9     median: 196.9 (1%)     max: 197 Seconds
min: 80     avg: 85.7     median: 84 (1%)     max: 101 Seconds
223 Seconds (2%)
R Benchmark 2.5 - R Benchmark 2.5 *
min: 0.4509     avg: 0.5     median: 0.5 (10%)     max: 0.4545 sec
min: 0.3468     avg: 0.4     median: 0.4 (8%)     max: 0.3911 sec
0.4 sec (10%)
3DMark 06 - CPU - 3DMark 06 - CPU
15873 Points (34%)
min: 19989     avg: 20578     median: 20192 (43%)     max: 21934 Points
14875 Points (32%)
Super Pi mod 1.5 XS 1M - Super Pi mod 1.5 XS 1M *
7.3 s (2%)
min: 5.655     avg: 5.7     median: 5.7 (1%)     max: 5.86 s
7.8 s (2%)
Super Pi mod 1.5 XS 2M - Super Pi mod 1.5 XS 2M *
15.8 s (1%)
min: 12.287     avg: 12.6     median: 12.5 (1%)     max: 13.193 s
17.2 s (1%)
Super Pi Mod 1.5 XS 32M - Super Pi mod 1.5 XS 32M *
365.8 s (2%)
min: 289.628     avg: 296.6     median: 293.3 (1%)     max: 310.125 s
3DMark Vantage - 3DM Vant. Perf. CPU no Physx
86050 Points (75%)
min: 86915     avg: 97290     median: 96473 (84%)     max: 112434 Points
69725 Points (61%)
3DMark 11 - 3DM11 Performance Physics
min: 23381     avg: 23704     median: 23703.5 (64%)     max: 24026 Points
min: 29023     avg: 31289     median: 31187.5 (84%)     max: 33181 Points
18026 Points (49%)
3DMark - 3DMark Ice Storm Physics
94127 Points (76%)
min: 79257     avg: 97847     median: 97246.5 (79%)     max: 111988 Points
84456 Points (69%)
3DMark - 3DMark Ice Storm Extreme Physics
94179 Points (76%)
83392 Points (68%)
3DMark - 3DMark Ice Storm Unlimited Physics
96702 Points (81%)
min: 83056     avg: 98634     median: 97311 (82%)     max: 105981 Points
81778 Points (69%)
3DMark - 3DMark Cloud Gate Physics
22992 Points (58%)
min: 26626     avg: 29034     median: 29044.5 (73%)     max: 30955 Points
17891 Points (45%)
3DMark - 3DMark Fire Strike Standard Physics
min: 29163     avg: 30051     median: 30050.5 (54%)     max: 30938 Points
min: 46013     avg: 51456     median: 51140 (91%)     max: 54226 Points
26263 Points (47%)
3DMark - 3DMark Time Spy CPU
min: 11599     avg: 11652     median: 11652 (49%)     max: 11705 Points
min: 16236     avg: 20507     median: 20037 (84%)     max: 22794 Points
9655 Points (41%)
Geekbench 6.2 - Geekbench 6.2 Single-Core
2483 Points (67%)
Geekbench 6.2 - Geekbench 6.2 Multi-Core
10348 Points (41%)
Geekbench 5.5 - Geekbench 5.1 - 5.4 64 Bit Single-Core
min: 1665     avg: 1683     median: 1683 (71%)     max: 1701 Points
min: 2106     avg: 2237     median: 2286 (96%)     max: 2290 Points
1805 Points (76%)
Geekbench 5.5 - Geekbench 5.1 - 5.4 64 Bit Multi-Core
min: 10093     avg: 10724     median: 10723.5 (19%)     max: 11354 Points
min: 22448     avg: 23743     median: 24033 (43%)     max: 24157 Points
10322 Points (18%)
Geekbench 5.0 - Geekbench 5.0 64 Bit Single-Core
1673 Points (7%)
min: 2148     avg: 2191     median: 2197 (10%)     max: 2246 Points
1749 Points (8%)
Geekbench 5.0 - Geekbench 5.0 64 Bit Multi-Core
11246 Points (35%)
min: 22024     avg: 23446     median: 23664 (75%)     max: 24021 Points
10213 Points (32%)
Geekbench 4.4 - Geekbench 4.1 - 4.4 64 Bit Single-Core
7333 Points (73%)
min: 9218     avg: 9542     median: 9598 (96%)     max: 9683 Points
7379 Points (74%)
Geekbench 4.4 - Geekbench 4.1 - 4.4 64 Bit Multi-Core
44131 Points (48%)
min: 77347     avg: 84105     median: 85336 (94%)     max: 86695 Points
39094 Points (43%)
Mozilla Kraken 1.1 - Kraken 1.1 Total Score *
min: 558     avg: 576     median: 575.5 (1%)     max: 593 ms
min: 423     avg: 430.6     median: 432 (1%)     max: 438 ms
519 ms (1%)
WebXPRT 4 - WebXPRT 4 Score
245 Points (70%)
min: 304     avg: 317.6     median: 316 (91%)     max: 335 Points
254 Points (73%)
WebXPRT 3 - WebXPRT 3 Score
min: 296     avg: 301.5     median: 301.5 (63%)     max: 307 Points
min: 338     avg: 364     median: 368 (77%)     max: 382 Points
266 Points (55%)
CrossMark - CrossMark Overall
1541 Points (59%)
min: 2263     avg: 2497     median: 2580 (99%)     max: 2589 Points
1549 Points (59%)
Power Consumption - Prime95 Power Consumption - external Monitor *
242.3 Watt (42%)
min: 228     avg: 354.3     median: 359 (62%)     max: 471 Watt
98.7 Watt (17%)
Power Consumption - Cinebench R15 Multi Power Consumption - external Monitor *
220.7 Watt (40%)
min: 349     avg: 392.5     median: 370.5 (68%)     max: 480 Watt
121 Watt (22%)
7.9 Watt (5%)
Power Consumption - Cinebench R15 Multi Power Efficiency - external Monitor
11.9 Points per Watt (9%)
min: 12.9     avg: 15     median: 15.2 (11%)     max: 16.8 Points per Watt
19.9 Points per Watt (15%)

Average Benchmarks AMD Ryzen 7 5800X → 100% n=47

Average Benchmarks Intel Core i9-13900K → 150% n=47

Average Benchmarks Intel Core i5-13500 → 95% n=47

- Range of benchmark values for this graphics card
- Average benchmark values for this graphics card
* Smaller numbers mean a higher performance
1 This benchmark is not used for the average calculation

v1.28
log 02. 06:26:29

#0 checking url part for id 12783 +0s ... 0s

#1 checking url part for id 14625 +0s ... 0s

#2 checking url part for id 17901 +0s ... 0s

#3 redirected to Ajax server, took 1719894388 +0s ... 0s

#4 did not recreate cache, as it is less than 5 days old! Created at Mon, 01 Jul 2024 05:15:43 +0200 +0s ... 0s

#5 composed specs +0.006s ... 0.006s

#6 did output specs +0s ... 0.006s

#7 getting avg benchmarks for device 12783 +0.004s ... 0.009s

#8 got single benchmarks 12783 +0.006s ... 0.016s

#9 getting avg benchmarks for device 14625 +0.004s ... 0.019s

#10 got single benchmarks 14625 +0.023s ... 0.042s

#11 getting avg benchmarks for device 17901 +0.004s ... 0.046s

#12 got single benchmarks 17901 +0.001s ... 0.047s

#13 got avg benchmarks for devices +0s ... 0.047s

#14 min, max, avg, median took s +0.069s ... 0.116s

#15 return log +0s ... 0.116s

Please share our article, every link counts!
> Expert Reviews and News on Laptops, Smartphones and Tech Innovations > Benchmarks / Tech > Processor Comparison - Head 2 Head
Redaktion, 2017-09- 8 (Update: 2023-07- 1)