Apple M2 10-Core GPU vs Qualcomm Adreno 504 vs Qualcomm Adreno 508
Apple M2 10-Core GPU ► remove from comparison
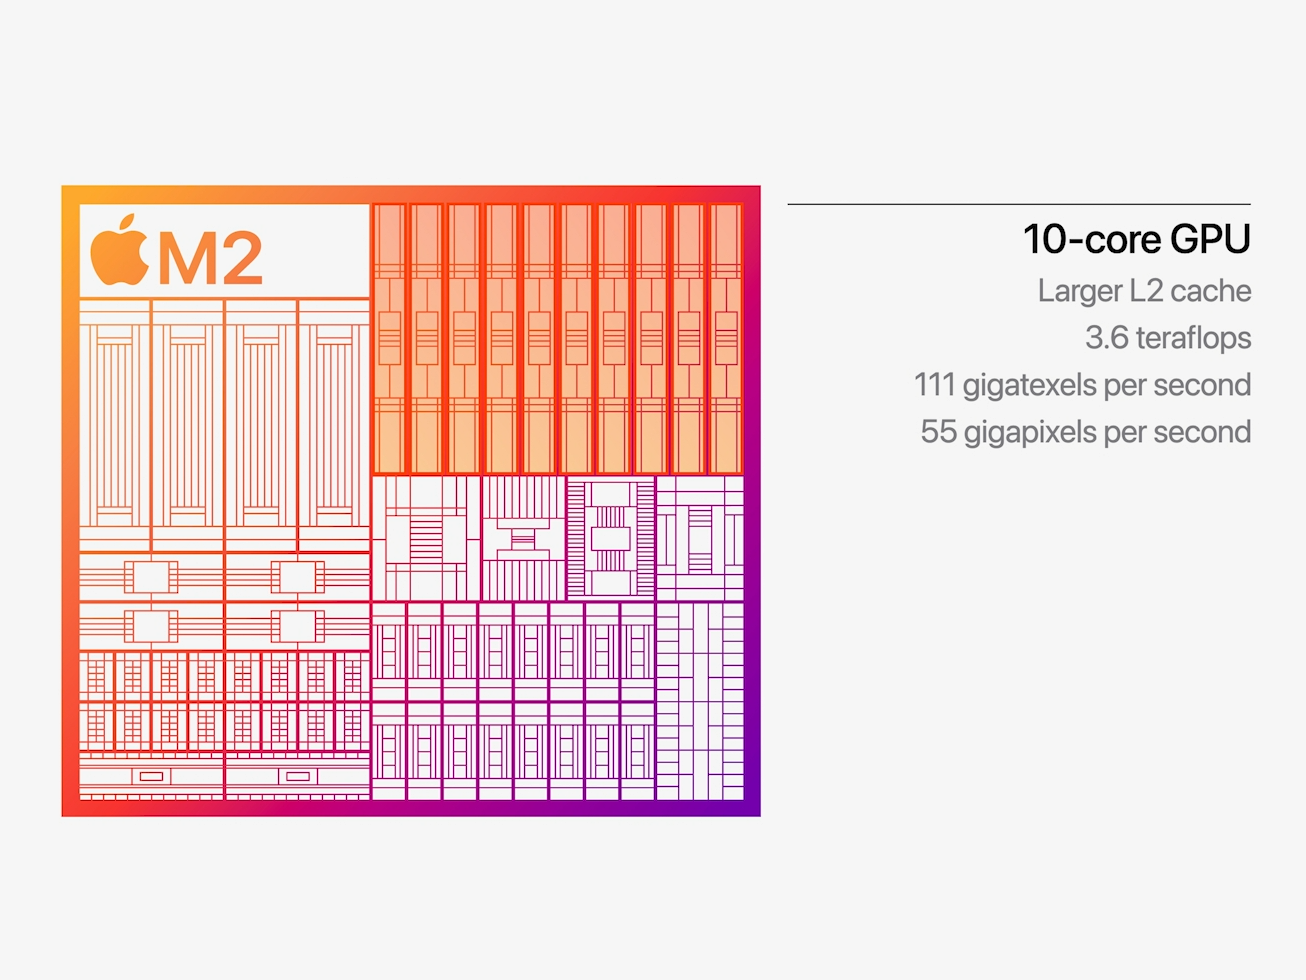
The Apple M2 GPU is an integrated graphics card offering 10 cores designed by Apple and integrated in the Apple M2 SoC . It uses the unified memory architecture of the M2 SoC (up to 24 GB LPDDR5-6400 with 100 GB/s bandwidth) and should offer 160 execution units.
According to Apple it offers a 25% higher performance at slightly higher power consumption. The theoretical performance is rated at 3.6 Teraflops and therefore 1 TFLOP higher than the M1 8-core GPU . In our benchmarks, the GPU was able to top the M1 with up to 40%, but still stays behind the 14-core GPU in the M1 Pro. Compared to other iGPUs from AMD and Intel, the M2 benefits greatly from the unified memory architecture and the high bandwidth.
The M2 chip is manufactured in the second generation 5nm process at TSMC (most likely N5P). The power consumption is around 13.5 Watt (in our tests under load of the MBP13) and up to 15W according to Apple.
Qualcomm Adreno 504 ► remove from comparison
The Qualcomm Adreno 504 is a mobile graphics card for lower mid-range smartphones and tablets (mostly Android based). It is included in the Qualcomm Snapdragon 429 SoCs and based on the Adreno 500 architecture (like the Adreno 520 in the S820, which should be fully compatible in software).
The GPU supports modern standards like Vulkan 1.0 (according to Wikipedia), OpenGL ES 3.1 + AE (3.2 in other sources), OpenCL 2.0 and DirectX 12 (FL 12.1 according to Wikipedia, 11.1 according to Qualcomm). Furthermore, the GPU supports Universal Bandwidth Compression (UBWC) to save memory bandwidth.
According to Qualcomm, the GPU is 50% faster than the previous Adreno 308 in the Snapdragon 425 .
In the Snapdragon 429, the Adreno 504 is manufactured in the modern 12nm process and should be very power efficient.
Qualcomm Adreno 508 ► remove from comparison
The Qualcomm Adreno 508 is a mobile graphics card for mid-range smartphones and tablets (mostly Android based). It is included in the Qualcomm Snapdragon 630 SoCs and based on the Adreno 500 architecture (like the Adreno 520 in the S820, which should be fully compatible in software).
The GPU supports modern standards like Vulkan 1.0 (according to Wikipedia), OpenGL ES 3.1 + AE (3.2 in other sources), OpenCL 2.0 and DirectX 12 (FL 12.1 according to Wikipedia, 11.1 according to Qualcomm). Furthermore, the GPU supports Universal Bandwidth Compression (UBWC) to save memory bandwidth.
According to Qualcomm "up to 30% faster graphics rendering than previous designs".
Apple M2 10-Core GPU Qualcomm Adreno 504 Qualcomm Adreno 508 Adreno 500 Series Pipelines 10 - unified Core Speed 1398 (Boost) MHz 450 MHz 650 MHz Memory Type LPDDR5-6400 Shared Memory no yes yes Power Consumption 15 Watt technology 5 nm 14 nm 14 nm Date of Announcement 06.06.2022 30.06.2018 08.05.2017 Predecessor M1 8-Core GPU Architecture Adreno 500 Adreno 500 API DirectX 12.1, OpenGL ES 3.2, Vulkan DirectX 12.1, OpenGL ES 3.2, Vulkan Features OpenGL ES 3.2, OpenCL 2.0, Direct3D 12 (FL 12_1) OpenGL ES 3.2, OpenCL 2.0, Direct3D 12 (FL 12_1)
Benchmarks 3DMark - 3DMark Ice Storm Unlimited Graphics
min: 6895 avg: 6896 median: 6896 (1%) max: 6897 Points
min: 16508 avg: 18279 median: 18469 (2%) max: 18635 Points
3DMark - 3DMark Sling Shot (ES 3.0) Unlimited
min: 428 avg: 445 median: 445 (2%) max: 462 Points
min: 1299 avg: 1379 median: 1391 (6%) max: 1415 Points
3DMark - 3DMark Sling Shot (ES 3.0) Unlimited Graphics
min: 336 avg: 364.5 median: 364.5 (1%) max: 393 Points
min: 1204 avg: 1302 median: 1318 (3%) max: 1332 Points
3DMark - 3DMark Sling Shot Extreme (ES 3.1) Unlimited
257 Points (1%)
min: 872 avg: 904 median: 907 (5%) max: 919 Points
3DMark - 3DMark Sling Shot Extreme (ES 3.1) Unlimited Graphics
210 Points (1%)
min: 767 avg: 797 median: 801 (2%) max: 809 Points
3DMark - 3DMark Wild Life Unlimited
min: 21302 avg: 23924 median: 24236 (12%) max: 25317 Points
GPU TDP ? TDP 13 W 94% 100%
3DMark - 3DMark Wild Life Extreme Unlimited
min: 5328 avg: 6533 median: 6823.5 (8%) max: 6987 Points
GPU TDP ? TDP 12 W TDP 13 W 89% 100% 98%
Blender - Blender 3.3 Classroom METAL *
min: 205 avg: 221 median: 221 (23%) max: 237 Seconds
GPU TDP 12 W TDP 13 W 104% 100%
Cinebench R15 + Apple M2 10-Core GPU Cinebench R15 - Cinebench R15 OpenGL 64 Bit
min: 128.65 avg: 132.8 median: 131 (8%) max: 140.5 fps
GPU TDP 12 W TDP 13 W 100% 93%
Cinebench R15 OpenGL Ref. Match 64 Bit + Apple M2 10-Core GPU Cinebench R15 - Cinebench R15 OpenGL Ref. Match 64 Bit
99.5 % (100%)
GPU TDP 12 W TDP 13 W 100% 100%
GFXBench - GFXBench 5.0 4K Aztec Ruins High Tier Offscreen
min: 35.6 avg: 43.9 median: 47.9 (19%) max: 48.6 fps
GPU TDP ? TDP 12 W TDP 13 W 85% 99% 100%
GFXBench - GFXBench 5.0 Aztec Ruins High Tier Offscreen
min: 68 avg: 96 median: 102.6 (19%) max: 110 fps
GPU TDP ? TDP 12 W TDP 13 W 76% 99% 100%
0.8 fps (0%)
GPU TDP ? TDP 12 W TDP 13 W 61% 99% 100%
min: 1.7 avg: 1.8 median: 1.9 (0%) max: 1.9 fps
GPU TDP ? TDP 12 W TDP 13 W 35% 99% 100%
GFXBench - GFXBench 5.0 Aztec Ruins Normal Tier Offscreen
min: 208 avg: 267.5 median: 283.8 (21%) max: 296 fps
GPU TDP ? TDP 12 W TDP 13 W 83% 99% 100%
min: 1.7 avg: 1.8 median: 1.8 (0%) max: 1.8 fps
GPU TDP ? TDP 12 W TDP 13 W 55% 99% 100%
min: 4.9 avg: 5.3 median: 5.3 (0%) max: 5.6 fps
GPU TDP ? TDP 12 W TDP 13 W 34% 99% 100%
GFXBench - GFXBench Car Chase Offscreen
min: 136 avg: 197.6 median: 206.1 (23%) max: 232 fps
GPU TDP ? TDP 12 W TDP 13 W 82% 100% 85%
1.8 fps (0%)
GPU TDP ? TDP 12 W TDP 13 W 55% 100% 85%
min: 5.3 avg: 5.5 median: 5.5 (1%) max: 5.6 fps
GPU TDP ? TDP 12 W TDP 13 W 19% 100% 85%
GFXBench 3.1 - GFXBench Manhattan ES 3.1 Offscreen
min: 247 avg: 318.6 median: 331.5 (7%) max: 374.6 fps
GPU TDP ? TDP 12 W TDP 13 W 82% 100% 85%
min: 3.1 avg: 3.2 median: 3.2 (0%) max: 3.2 fps
GPU TDP ? TDP 12 W TDP 13 W 55% 100% 85%
min: 5.2 avg: 9.4 median: 9.7 (0%) max: 10 fps
GPU TDP ? TDP 12 W TDP 13 W 19% 100% 85%
GFXBench 3.0 - GFXBench 3.0 Manhattan Offscreen
min: 411 avg: 503 median: 509.5 (30%) max: 557.2 fps
GPU TDP ? TDP 12 W TDP 13 W 83% 100% 97%
min: 4.7 avg: 4.8 median: 4.8 (0%) max: 4.8 fps
GPU TDP ? TDP 12 W TDP 13 W 55% 100% 97%
min: 13 avg: 13.9 median: 14 (1%) max: 14 fps
GPU TDP ? TDP 12 W TDP 13 W 19% 100% 97%
GFXBench (DX / GLBenchmark) 2.7 + Apple M2 10-Core GPU GFXBench (DX / GLBenchmark) 2.7 - GFXBench T-Rex HD Offscreen C24Z16
min: 628 avg: 824 median: 891.5 (7%) max: 931.9 fps
GPU TDP ? TDP 12 W TDP 13 W 78% 100% 98%
GFXBench T-Rex HD Offscreen C24Z16 + Qualcomm Adreno 504 11 fps (0%)
GPU TDP ? TDP 12 W TDP 13 W 52% 100% 98%
GFXBench T-Rex HD Offscreen C24Z16 + Qualcomm Adreno 508 min: 29 avg: 29.7 median: 30 (0%) max: 30 fps
GPU TDP ? TDP 12 W TDP 13 W 19% 100% 98%
Antutu v9 - AnTuTu v9 GPU
min: 654168 avg: 728087 median: 728086 (91%) max: 802005 Points
Geekbench 6.2 - Geekbench 6.2 GPU OpenCL
min: 27880 avg: 27900 median: 27900 (8%) max: 27920 Points
GPU TDP 12 W TDP 13 W 100% 100%
Geekbench 6.2 - Geekbench 6.2 GPU Metal
min: 42013 avg: 44473 median: 45460 (29%) max: 45946 Points
GPU TDP ? TDP 12 W TDP 13 W 91% 100% 99%
PassMark PerformanceTest Mobile V1 - PerformanceTest Mobile V1 2D Graphics Tests
3898 Points (4%)
PassMark PerformanceTest Mobile V1 - PerformanceTest Mobile V1 3D Graphics Tests
860 Points (2%)
Power Consumption - The Witcher 3 Power Consumption - external Monitor *
min: 22.8 avg: 27.8 median: 26.9 (4%) max: 34.4 Watt
GPU TDP 12 W TDP 13 W 100% 100%
Power Consumption - Witcher 3 Power Consumption *
min: 27.8 avg: 32.5 median: 30.8 (7%) max: 38.9 Watt
Power Consumption - GFXBench Aztec Ruins Normal Tier Offscreen Power Consumption 150cd *
min: 16 avg: 16.5 median: 16.7 (6%) max: 16.7 Watt
Power Consumption - Witcher 3 ultra Power Efficiency
min: 1.007 avg: 1 median: 1 (91%) max: 1.108 fps per Watt
Power Consumption - Witcher 3 ultra Power Efficiency - external Monitor
min: 1.116 avg: 1.1 median: 1.1 (92%) max: 1.207 fps per Watt
Emissions Witcher 3 Fan Noise + Apple M2 10-Core GPU Emissions - Witcher 3 Fan Noise
34.6 dB(A) (55%)
Average Benchmarks Apple M2 10-Core GPU → 100% n=6 Average Benchmarks Qualcomm Adreno 504 → 1% n=6 Average Benchmarks Qualcomm Adreno 508 → 3% n=6
- Range of benchmark values for this graphics card
- Average benchmark values for this graphics card
* Smaller numbers mean a higher performance
1 This benchmark is not used for the average calculation
Game Benchmarks The following benchmarks stem from our benchmarks of review laptops. The performance depends on the used graphics memory, clock rate, processor, system settings, drivers, and operating systems. So the results don't have to be representative for all laptops with this GPU. For detailed information on the benchmark results, click on the fps number.
100%
M2 10-Core GPU:
59.3 fps
100%
M2 10-Core GPU:
118.8 fps
100%
M2 10-Core GPU:
58.5 fps
100%
M2 10-Core GPU:
65 fps
100%
M2 10-Core GPU:
118.4 fps
100%
M2 10-Core GPU:
60 76 102 ~ 79 fps
100%
M2 10-Core GPU:
28 31 39 40 ~ 35 fps
100%
M2 10-Core GPU:
25 27 36 36 ~ 31 fps
100%
M2 10-Core GPU:
21 23 31 32 ~ 27 fps
100%
M2 10-Core GPU:
20 fps
100%
M2 10-Core GPU:
39.8 fps
Adreno 504:
32 [X] Nokia 3.2 1.29.1.2
Qualcomm Snapdragon 429 2GHz
Adreno 504
min:
22 fps, max:
33 fps
fps
Adreno 508:
30 31 31 [X] Sharp Aquos C10 1.23.1.2
Qualcomm Snapdragon 630 2.2GHz
Adreno 508
min:
18 fps, max:
32 fps
31 [X] CAT S61 1.24.1.2
Qualcomm Snapdragon 630 2.2GHz
Adreno 508
min:
25 fps, max:
31 fps
31 ~ 31 fps
Adreno 504:
31 [X] Nokia 3.2 1.29.1.2
Qualcomm Snapdragon 429 2GHz
Adreno 504
min:
26 fps, max:
32 fps
fps
Adreno 508:
30 30 30 [X] Sharp Aquos C10 1.23.1.2
Qualcomm Snapdragon 630 2.2GHz
Adreno 508
min:
22 fps, max:
31 fps
30 31 [X] CAT S61 1.24.1.2
Qualcomm Snapdragon 630 2.2GHz
Adreno 508
min:
28 fps, max:
31 fps
~ 30 fps
Adreno 508:
29 30 55 [X] Sharp Aquos C10 1.12.5
Qualcomm Snapdragon 630 2.2GHz
Adreno 508
min:
46 fps, max:
60 fps
~ 38 fps
100%
M2 10-Core GPU:
34 fps
100%
M2 10-Core GPU:
28 fps
100%
M2 10-Core GPU:
67.7 fps
Adreno 508:
29 30 [X] CAT S61 1.0.1a
Qualcomm Snapdragon 630 2.2GHz
Adreno 508
min:
28 fps, max:
31 fps
30 ~ 30 fps
100%
M2 10-Core GPU:
44.2 fps
16%
Adreno 504:
7 [X] Nokia 3.2 1.6.3a
Qualcomm Snapdragon 429 2GHz
Adreno 504
min:
4 fps, max:
10 fps
fps
63%
Adreno 508:
25 28 30 [X] CAT S61 1.0.1a
Qualcomm Snapdragon 630 2.2GHz
Adreno 508
min:
15 fps, max:
31 fps
~ 28 fps
Adreno 508:
58 60 ~ 59 fps
Average Gaming Apple M2 10-Core GPU → 100% Average Gaming 30-70 fps → 100%
Average Gaming Qualcomm Adreno 504 → 16% Average Gaming Qualcomm Adreno 508 → 54% Qualcomm Adreno 504 low med. high ultra QHD 4K PUBG Mobile 23 Arena of Valor 32 31 Asphalt 9: Legends 7 7 < 30 fps < 60 fps < 120 fps ≥ 120 fps 2 1 1 1
For more games that might be playable and a list of all games and graphics cards visit our Gaming List
v1.28
log 04. 04:32:03
#0 checking url part for id 11368 +0s ... 0s
#1 checking url part for id 9890 +0s ... 0s
#2 checking url part for id 8112 +0s ... 0s
#3 redirected to Ajax server, took 1720060323 +0s ... 0s
#4 did not recreate cache, as it is less than 5 days old! Created at Mon, 01 Jul 2024 05:16:07 +0200 +0s ... 0s
#5 composed specs +0.05s ... 0.05s
#6 did output specs +0s ... 0.05s
#7 start showIntegratedCPUs +0s ... 0.05s
#8 getting avg benchmarks for device 11368 +0.027s ... 0.077s
#9 got single benchmarks 11368 +0.008s ... 0.085s
#10 getting avg benchmarks for device 9890 +0s ... 0.085s
#11 got single benchmarks 9890 +0.004s ... 0.089s
#12 getting avg benchmarks for device 8112 +0s ... 0.089s
#13 got single benchmarks 8112 +0.008s ... 0.097s
#14 got avg benchmarks for devices +0s ... 0.097s
#15 min, max, avg, median took s +0.02s ... 0.118s
#16 before gaming benchmark output +0s ... 0.118s
#17 Got 100 rows for game benchmarks. +0.011s ... 0.129s
#18 composed SQL query for gamebenchmarks +0s ... 0.129s
#19 got data and put it in $dataArray +0.001s ... 0.13s
#20 benchmarks composed for output. +0.006s ... 0.136s
#21 calculated avg scores. +0s ... 0.136s
#22 return log +0.001s ... 0.137s
Please share our article, every link counts!
Redaktion, 2017-09- 8 (Update: 2023-07- 1)
 Deutsch
 English
 Español
 Français
 Italiano
 Nederlands
 Polski
 Português
 Русский
 Türkçe
 Svenska
 Chinese
 Magyar