HP EliteBook Ultra G1q 14 laptop review: High expectations for Windows on ARM

The HP EliteBook Ultra G1p 14 was one of many laptop models revealed at Microsoft's Surface event last month in Seattle. The announcement was particularly important as it would mark the beginning of the company's third attempt at bringing Windows to ARM platforms. This time, however, the Windows maker has the backing of Qualcomm's AI ready Snapdragon processor and major manufacturers like HP, Dell, Lenovo, and Asus to push the platform forward.
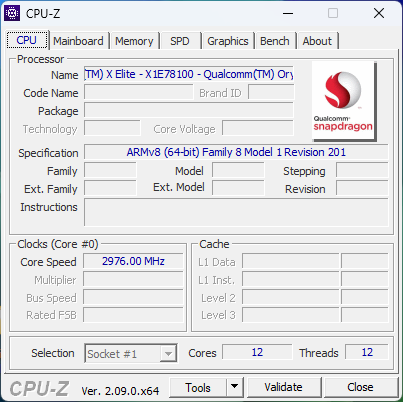
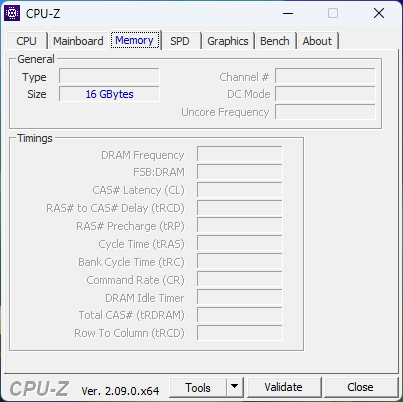
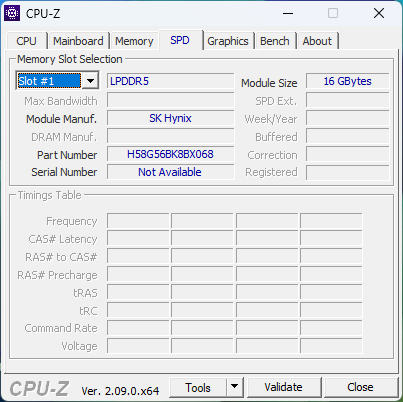
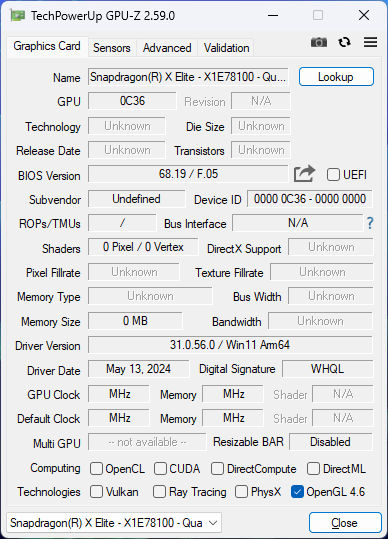
Our review unit today is the business-oriented EliteBook Ultra G1p 14 sporting the Snapdragon X Elite X1E-78-100 SoC, 16 GB of LPDDR5x-8400 soldered RAM, and 512 GB SSD for $1700 retail. No other SKUs are available at the time of writing. A related but separate HP model called the OmniBook X 14 comes with very similar specifications for $500 less in a more consumer-oriented design.
We recommend taking a look at our review on the Asus Vivobook S 15 which comes with the same Qualcomm ARM processor as our HP. Our software experiences between the two laptops are therefore very similar.
More HP reviews:
Potential Competitors in Comparison
Rating | Version | Date | Model | Weight | Height | Size | Resolution | Price |
|---|---|---|---|---|---|---|---|---|
| 82.3 % | v8 | 07 / 2024 | HP EliteBook Ultra G1q 14 SD X Elite X1E-78-100, Adreno X1-85 3.8 TFLOPS | 1.3 kg | 11.2 mm | 14.00" | 2240x1400 | |
| 83.3 % | v8 | 06 / 2024 | Asus Vivobook S 15 OLED Snapdragon SD X Elite X1E-78-100, Adreno X1-85 3.8 TFLOPS | 1.4 kg | 15.9 mm | 15.60" | 2880x1620 | |
| 89.4 % v7 (old) | v7 (old) | 03 / 2023 | HP Dragonfly Pro 2023 R7 7736U, Radeon 680M | 1.5 kg | 18.3 mm | 14.00" | 1920x1200 | |
| 88.3 % v7 (old) | v7 (old) | 04 / 2024 | Dell Latitude 9450 2-in-1 Ultra 7 165U, Graphics 4-Core iGPU (Arrow Lake) | 1.6 kg | 16.28 mm | 14.00" | 2560x1600 | |
| 90.8 % v7 (old) | v7 (old) | 02 / 2024 | Lenovo ThinkPad X1 Carbon G12 Ultra 7 155H, Arc 8-Core | 1.1 kg | 14.96 mm | 14.00" | 2880x1800 | |
| 92.8 % v7 (old) | v7 (old) | 11 / 2023 | Apple MacBook Pro 14 2023 M3 Max Apple M3 Max 16-Core, M3 Max 40-Core GPU | 1.6 kg | 15.5 mm | 14.20" | 3024x1964 |
Note: We have recently updated our rating system and the results of version 8 are not comparable with the results of version 7. More information is available here .
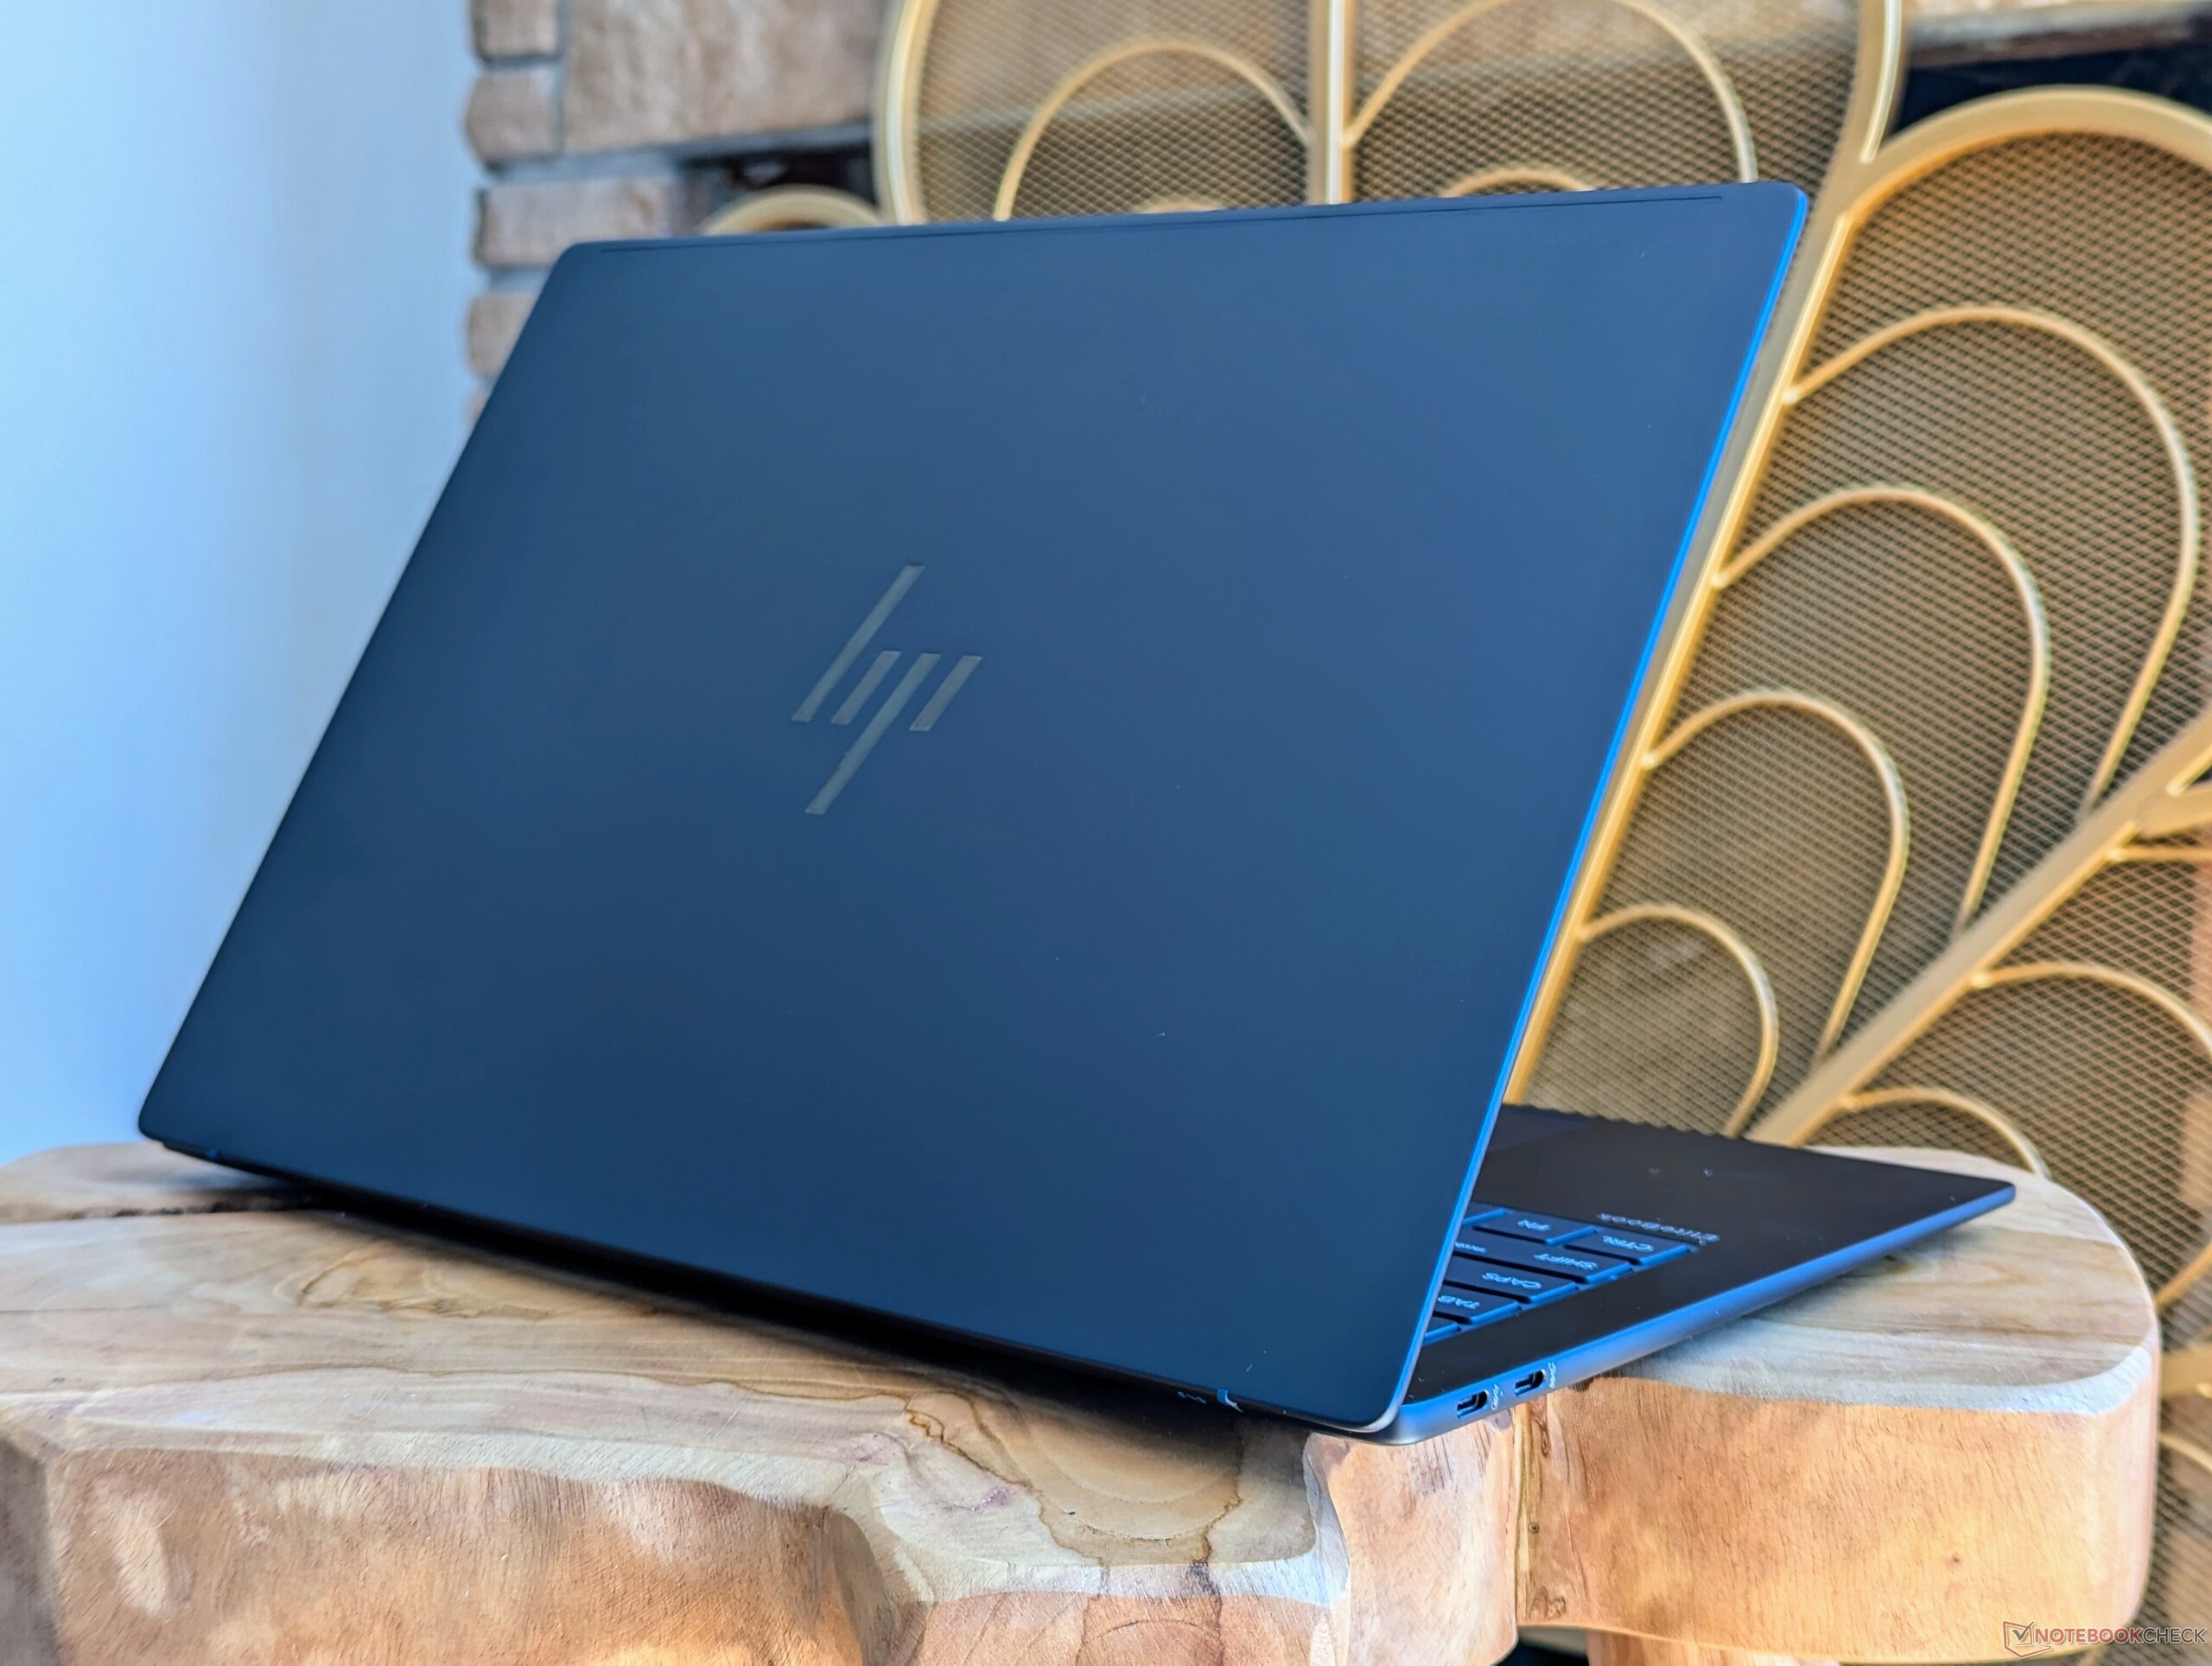
Case — Responsibly Crafted With Recycled Aluminum And Plastics
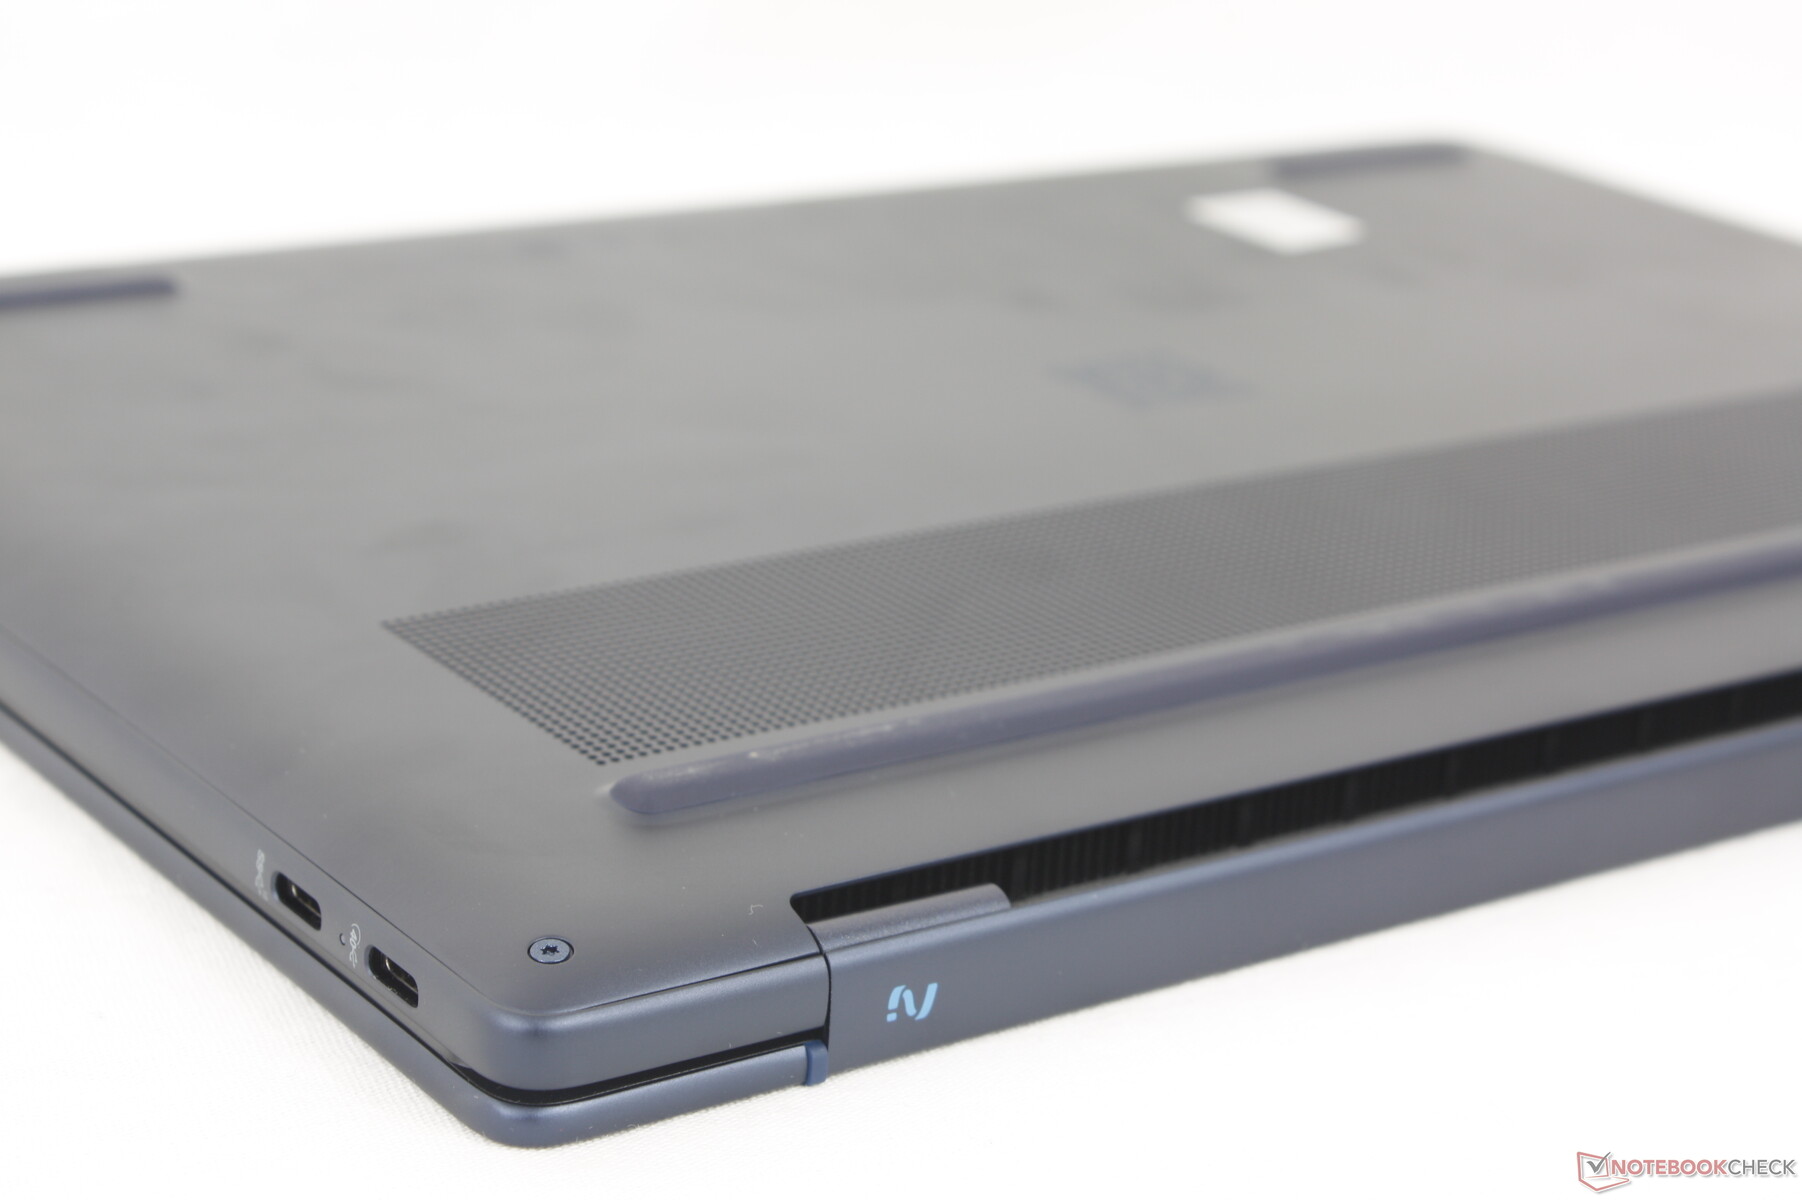
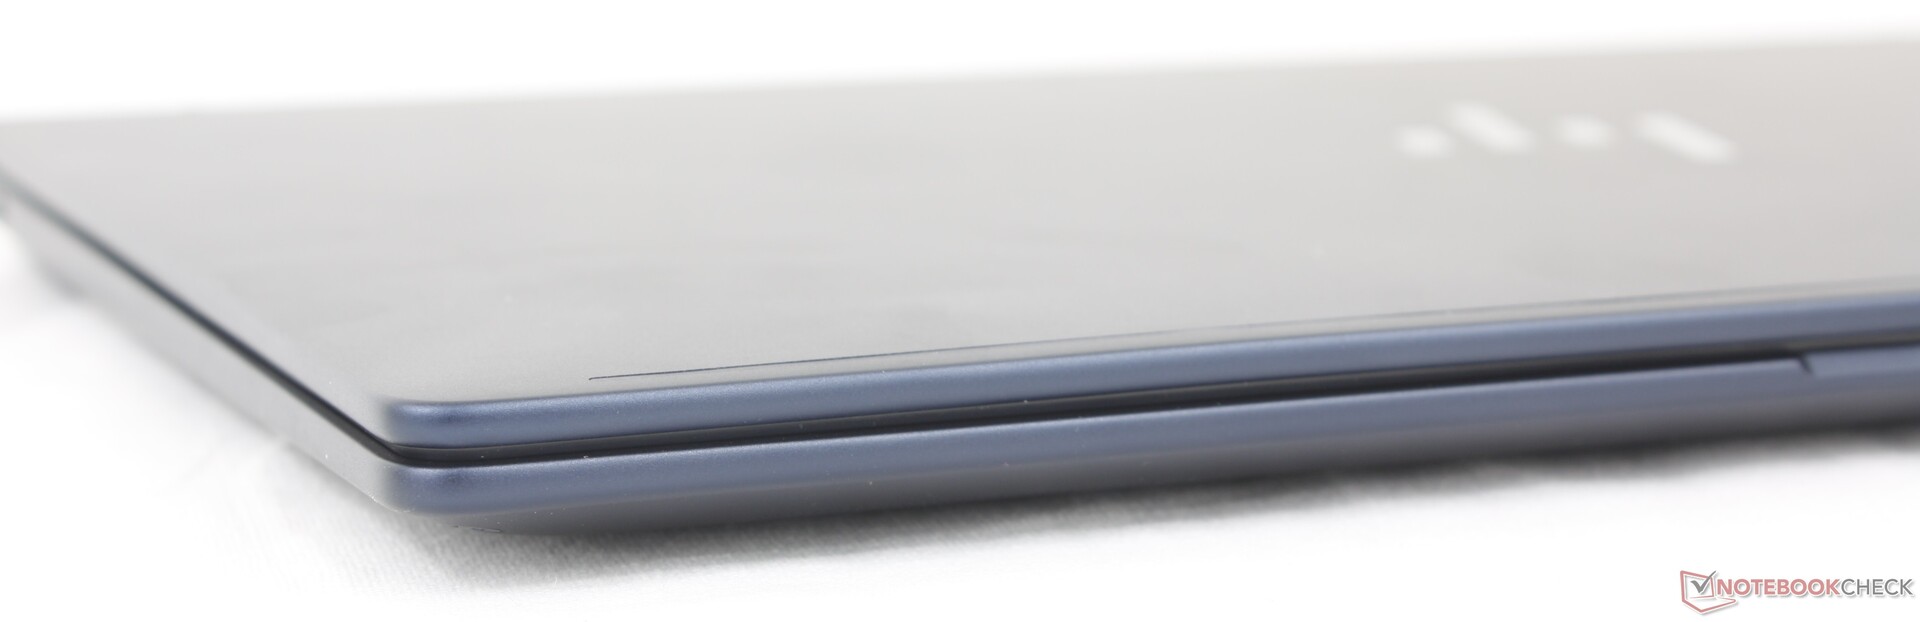
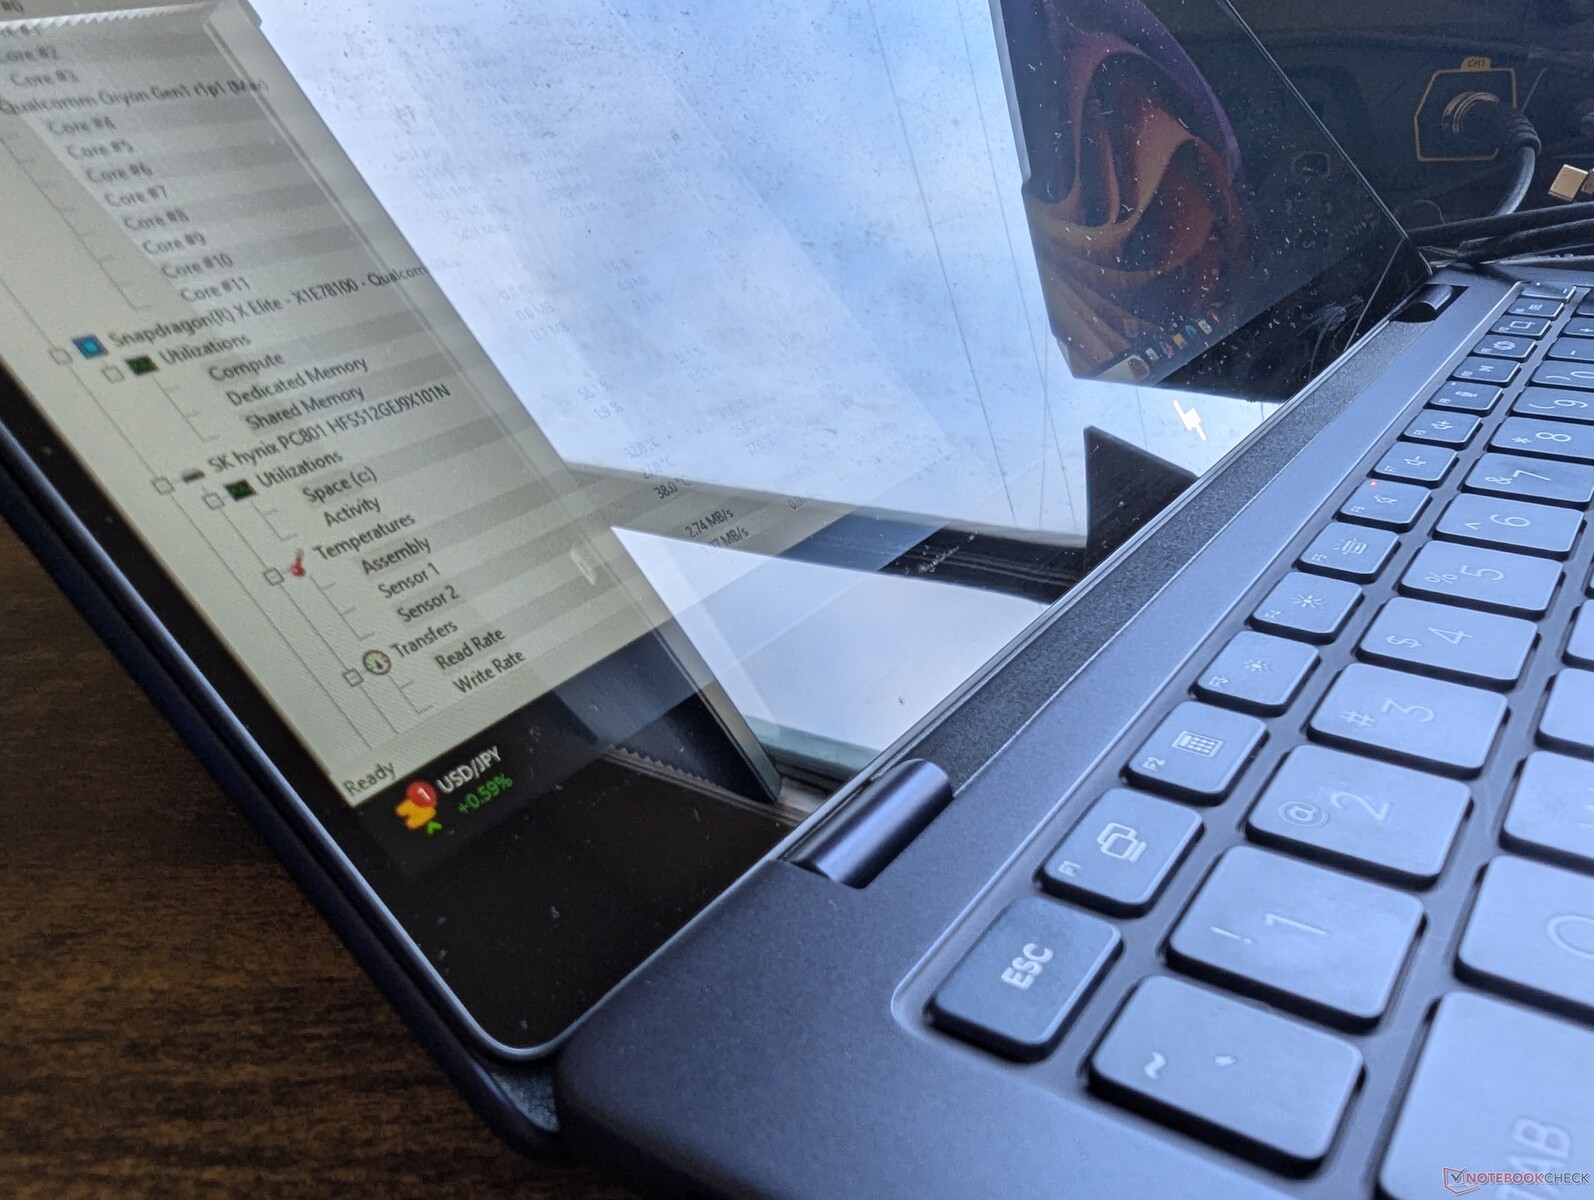
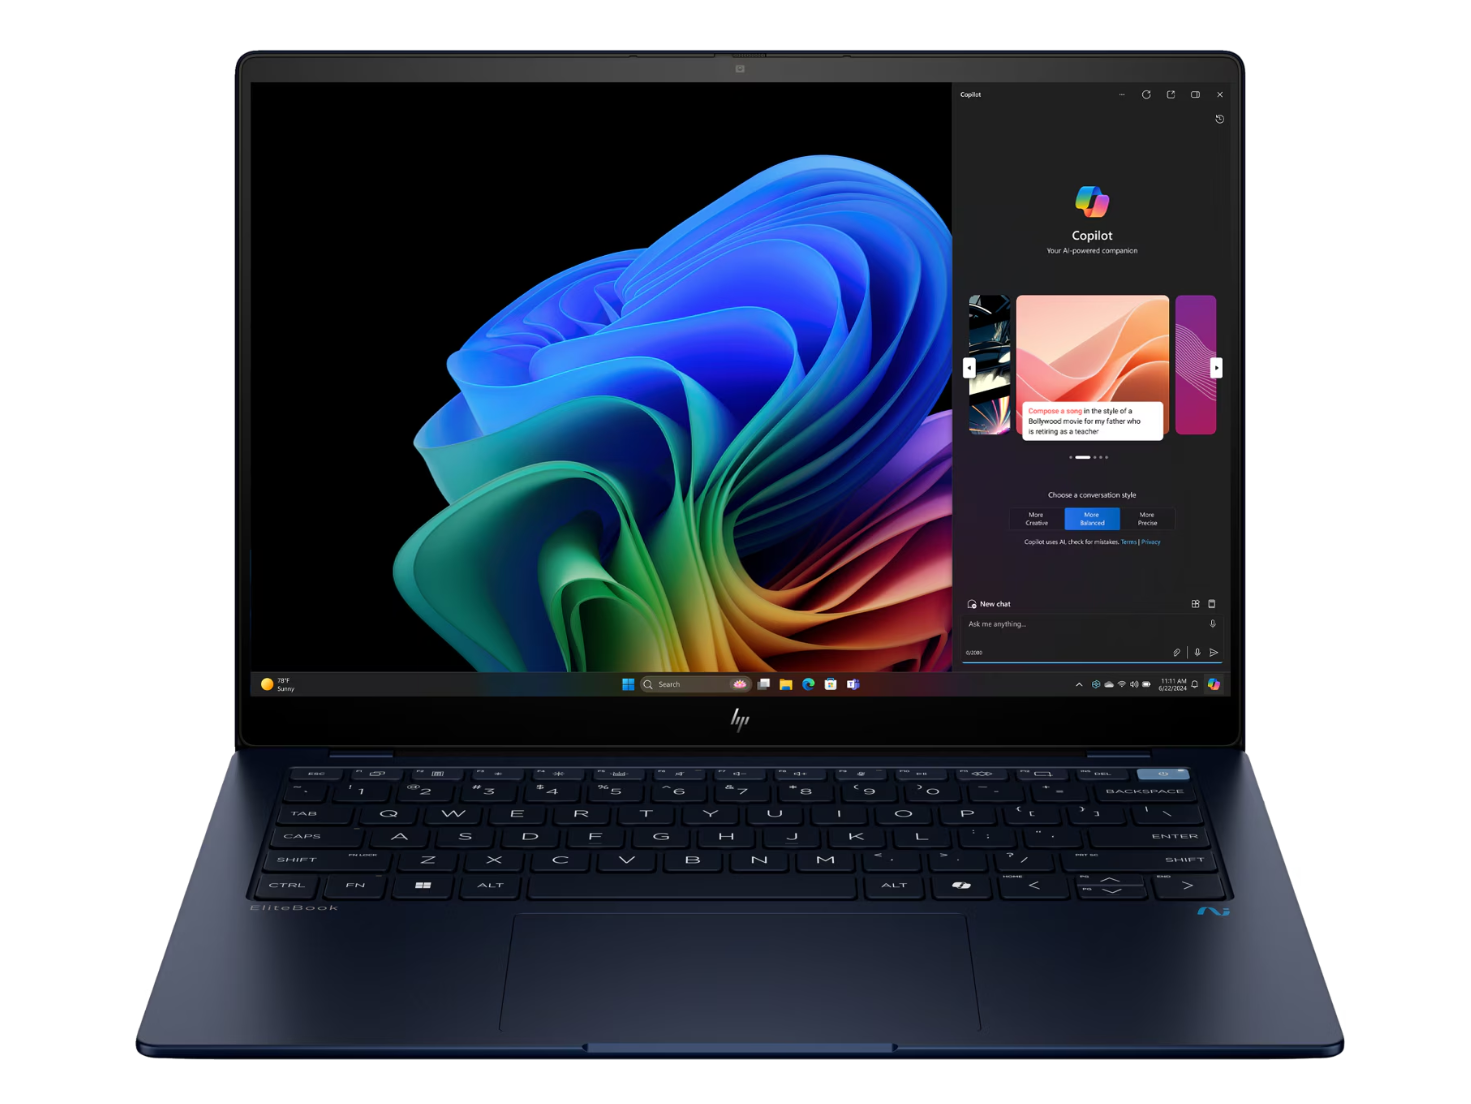
The EliteBook Ultra G1q 14 may have a fancy new ARM processor, but its shell appears to be heavily inspired by last year's AMD-powered Dragonfly Pro. Everything from chassis color, keyboard layout, hinge design, and visual touches are more reminiscent of the 14-inch Dragonfly series than the 14-inch EliteBook 1040 series. This means that the Qualcomm machine feels just as premium despite the super-light and thin design.
Unfortunately, the small hinges are the weakest aspect of an otherwise rigid chassis. We noted this in our Dragonfly Pro review as well and it's a bit disappointing to see the same problem on the EliteBook Ultra G1q 14. Hinge rigidity just isn't very stiff at wider angles and the lid tends to teeter quite noticeably when adjusting angles. We get a better sense of longevity from the tauter hinges of the Dell Latitude 9450 series in comparison.
Size and weight are highlights of the EliteBook Ultra G1q 14 as the model is noticeably thinner and lighter than many of its competitors including the Latitude 9450 2-in-1, XPS 14 9440, or MacBook Pro 14. However, users can still go even lighter by opting for the ThinkPad X1 Carbon G12 or LG Gram 14 and so our Qualcomm-based machine isn't necessarily the lightest there is.
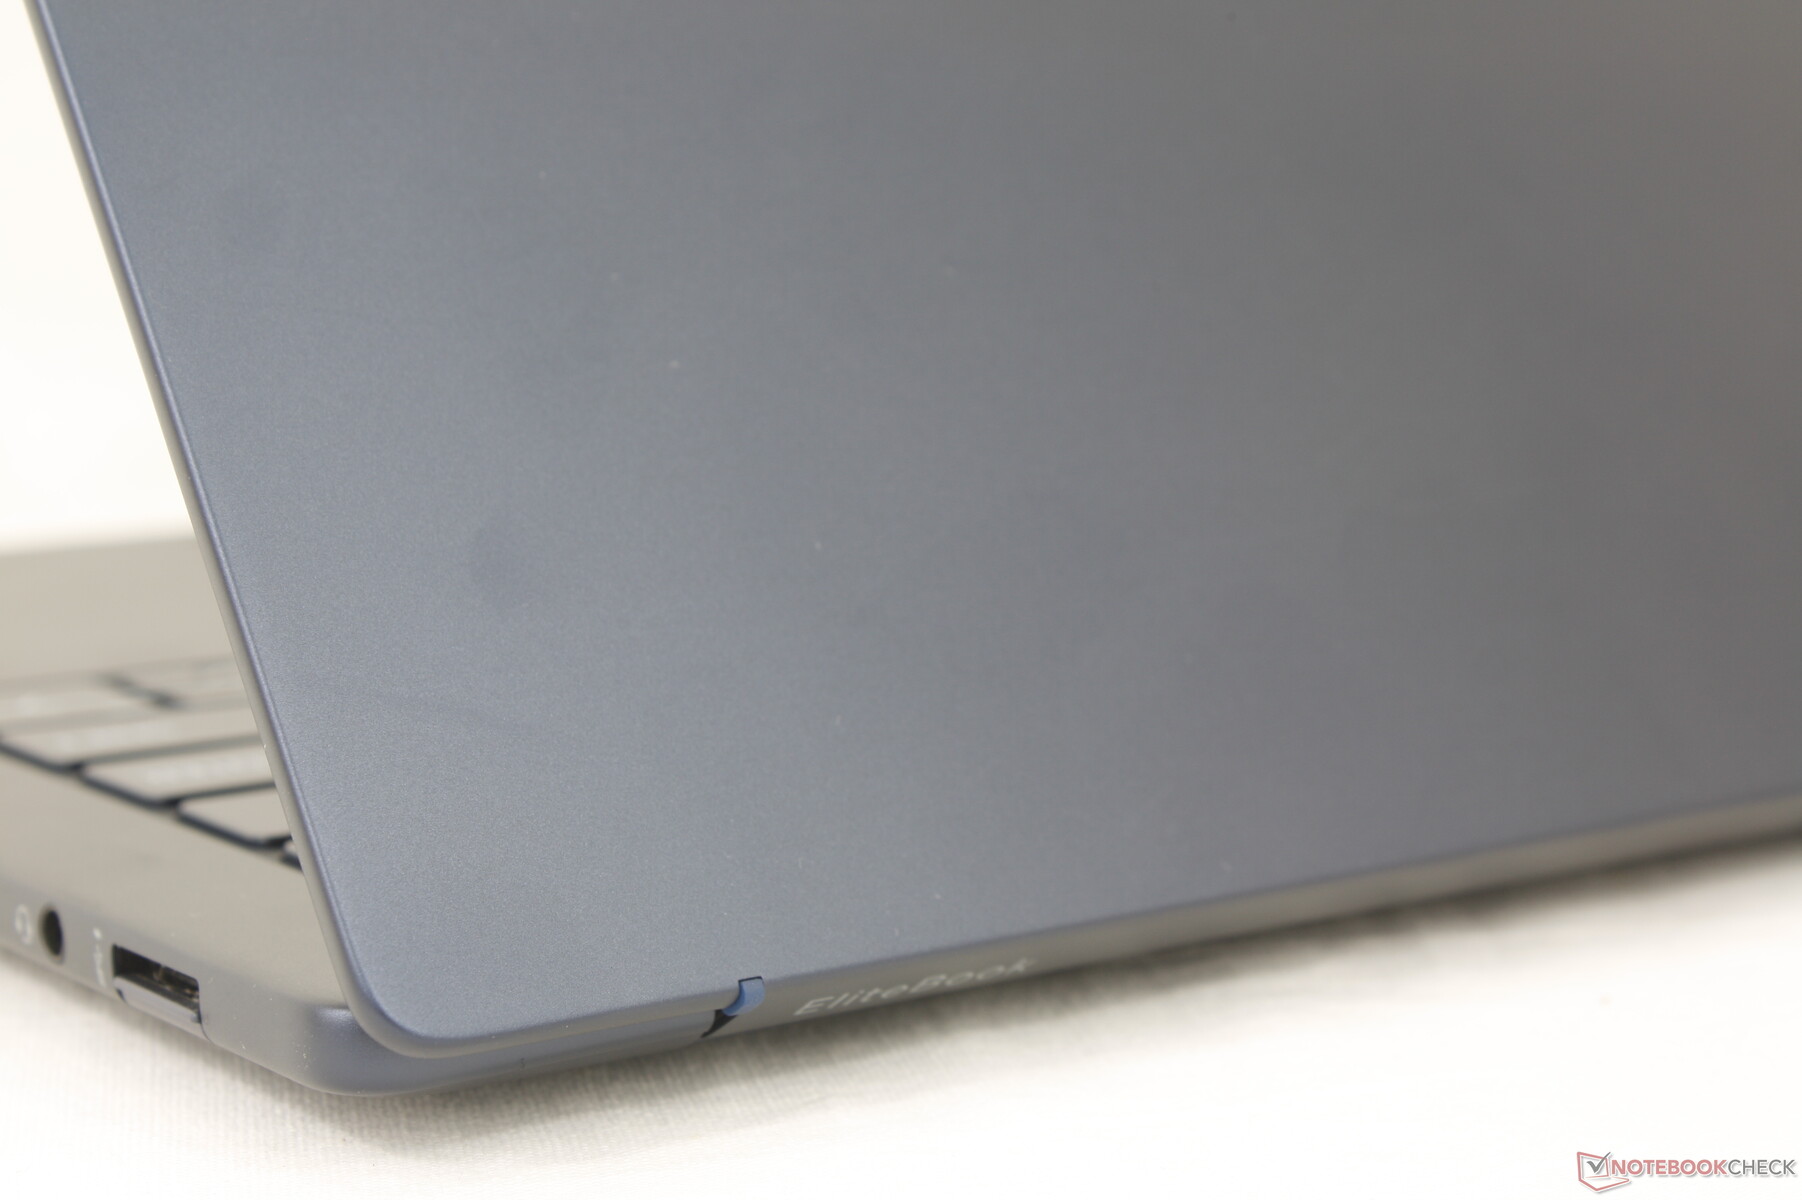
Connectivity
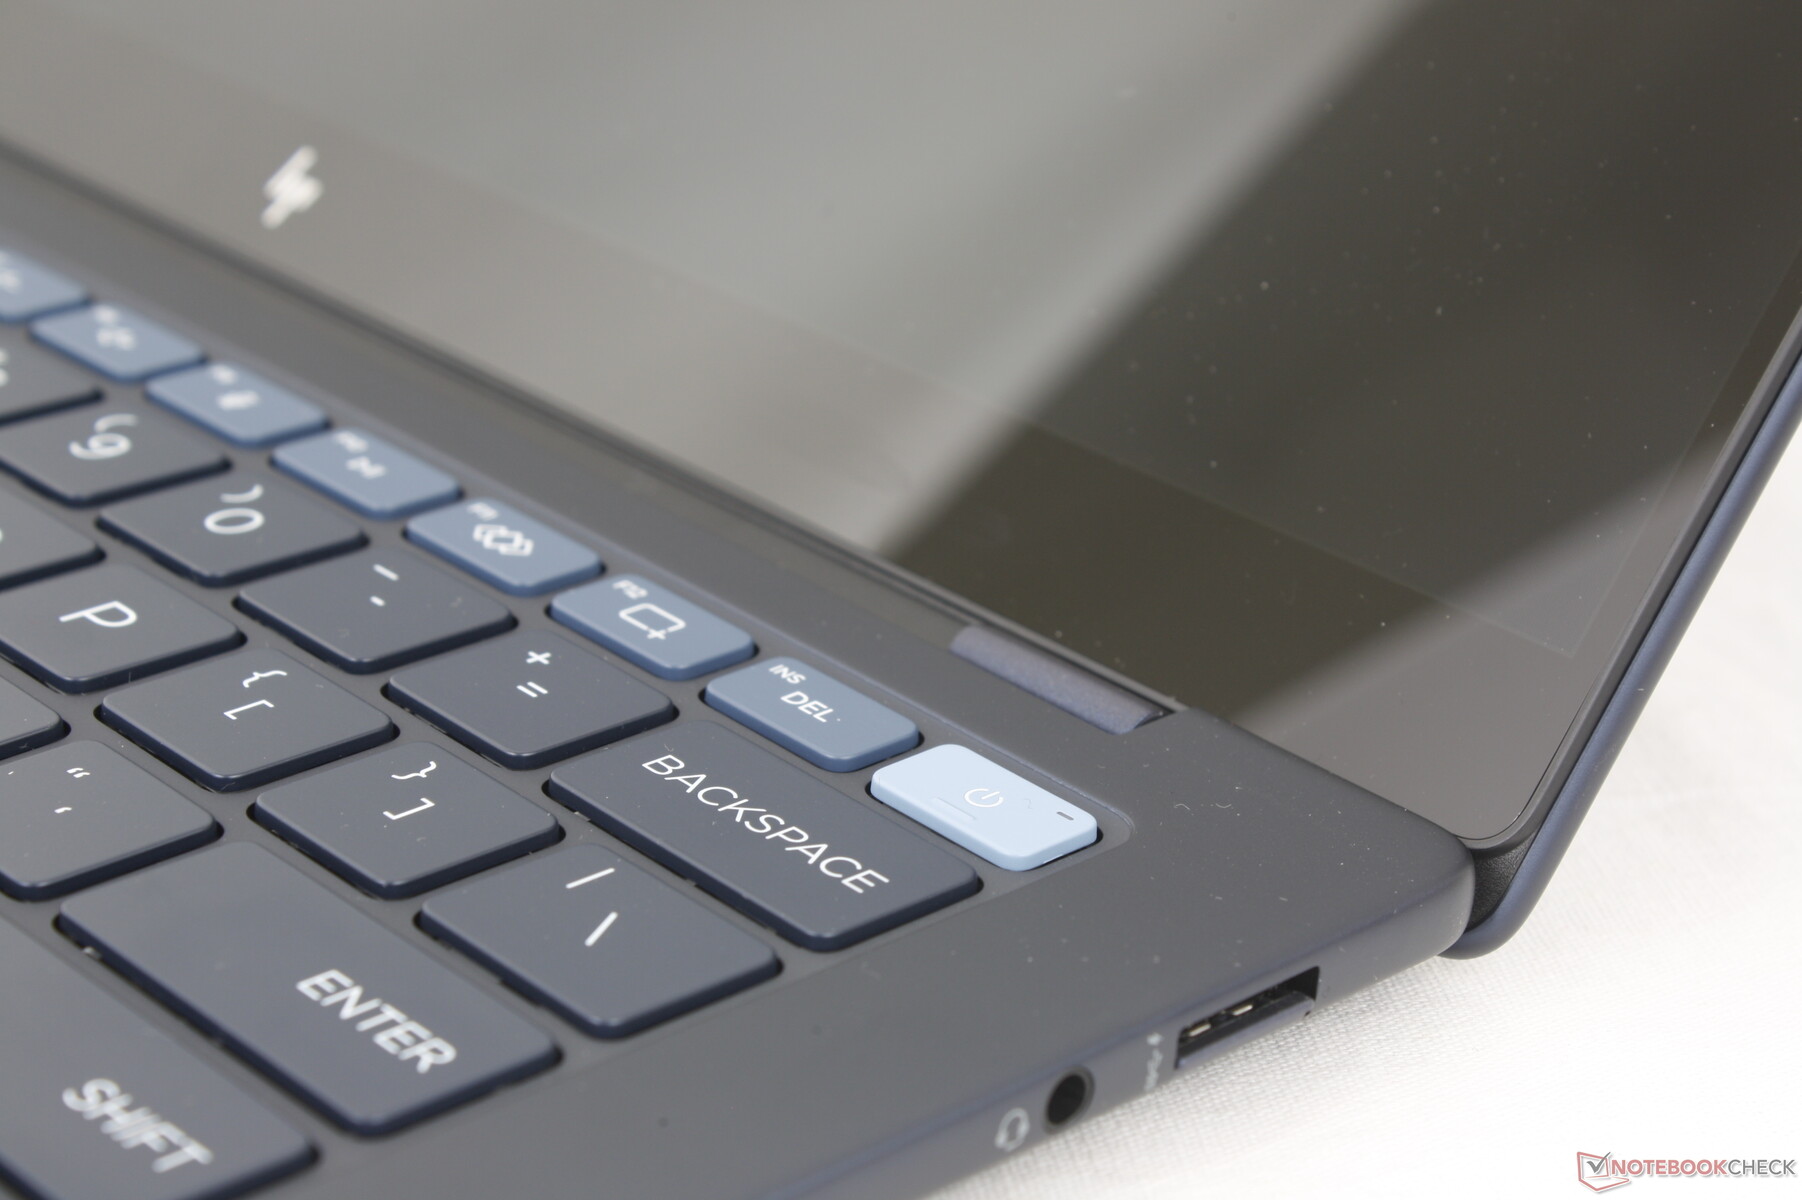
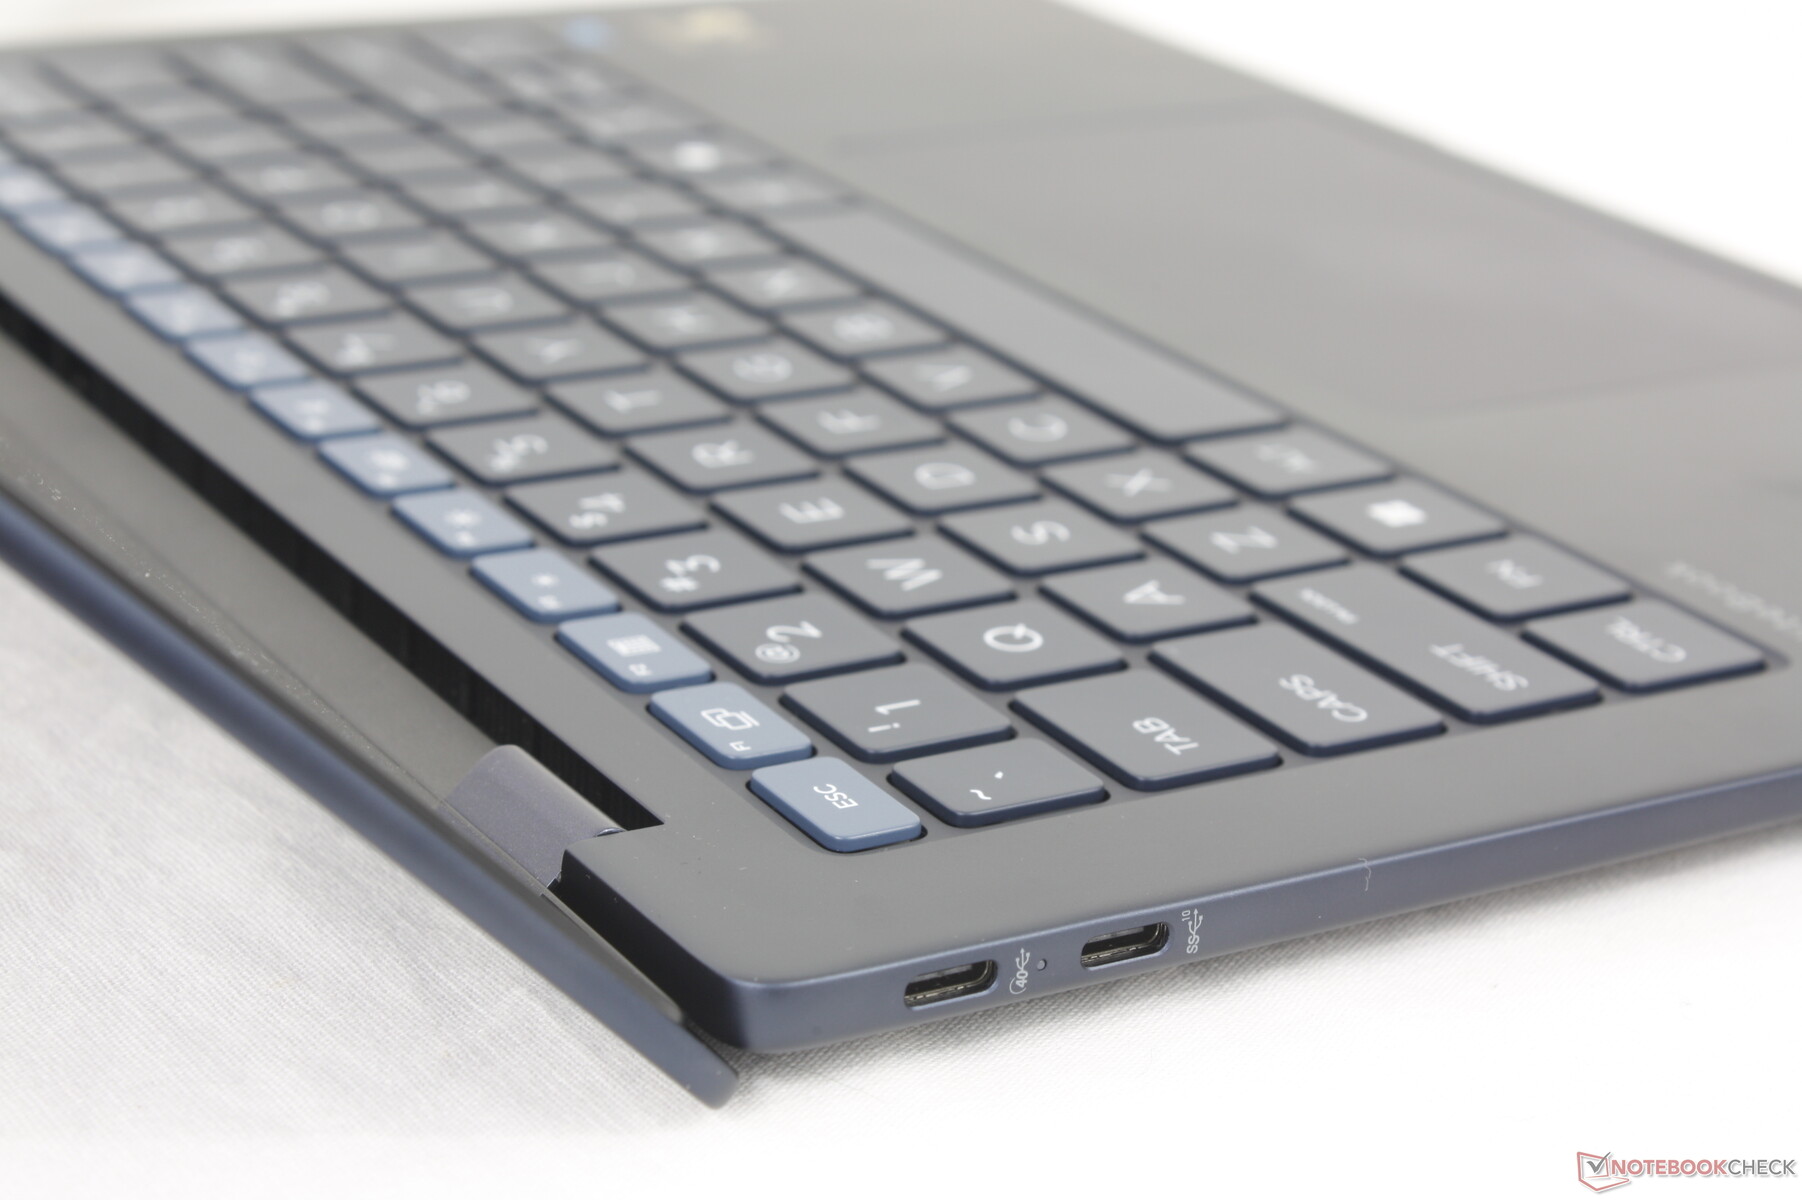
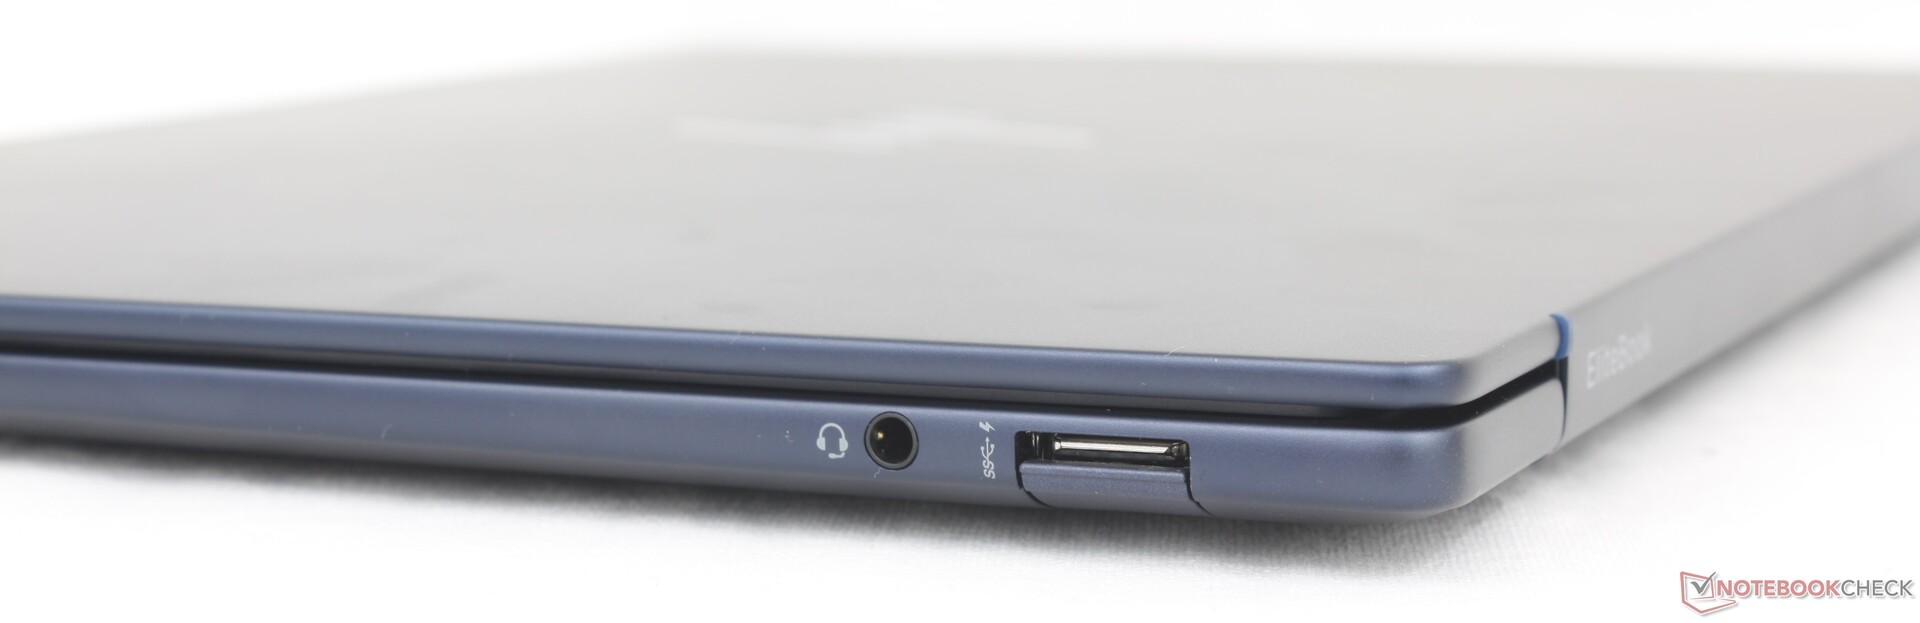
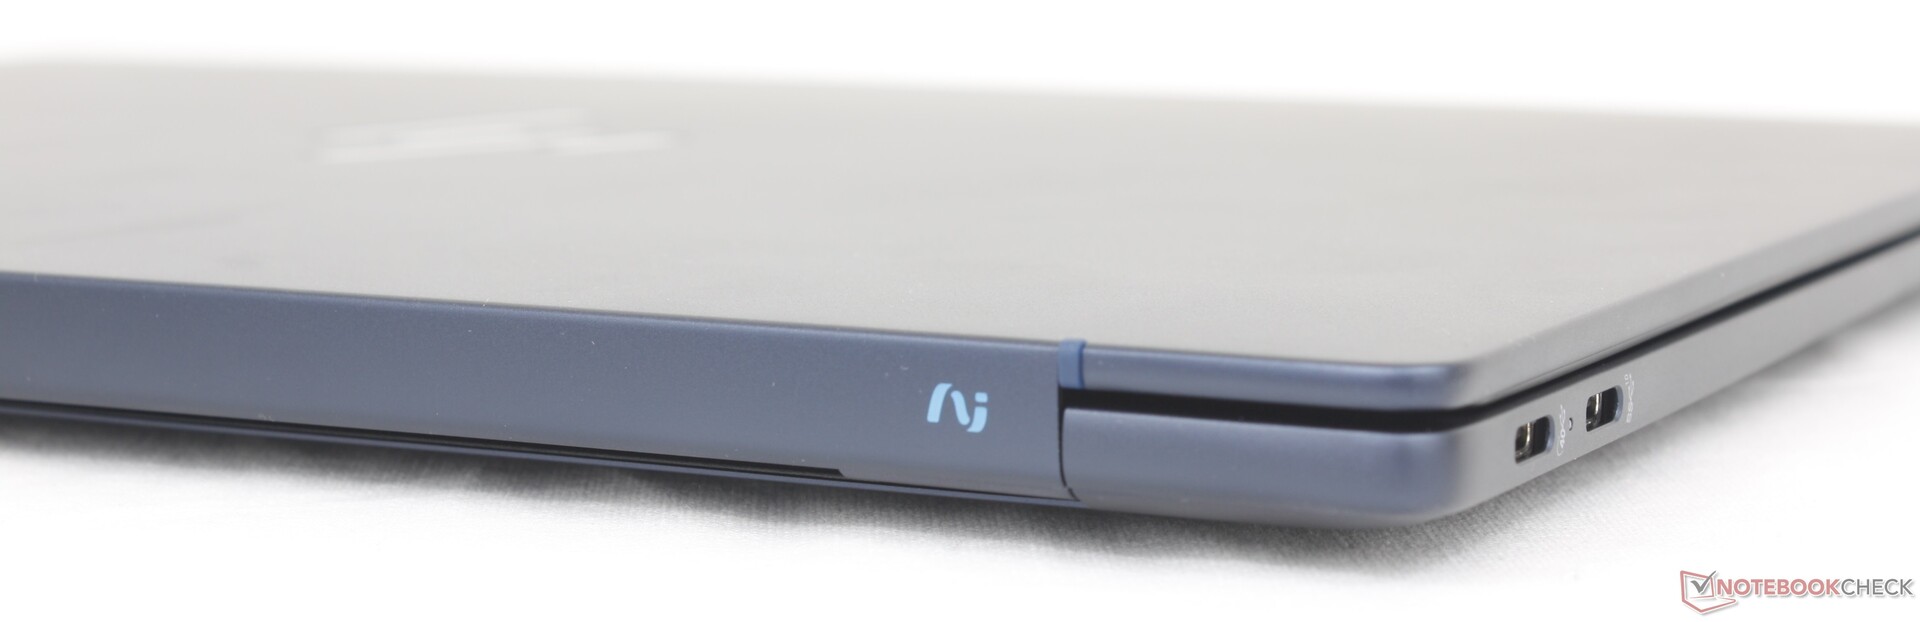
The system includes a USB-A port whereas most other 14-inch subnotebooks don't offer it including even HP's own Dragonfly series. USB4 is thankfully supported for compatibility with a wider range of docking stations and monitors.
There is no Kensington lock unlike on the Latitude 9440 2-in-1 or ThinkPad X1 Carbon G12.

Communication
The model ships with the FastConnect 6900 for Wi-Fi 6E and Bluetooth 5.3 connectivity. The system does not offer Wi-Fi 7 unlike on the Snapdragon XPS 13.

Webcam
A 5 MP sensor comes standard alongside IR for hands-free login and a physical slider for privacy. In comparison, some other HP laptops like the Dragonfly Folio G3 have 8 MP sensors.


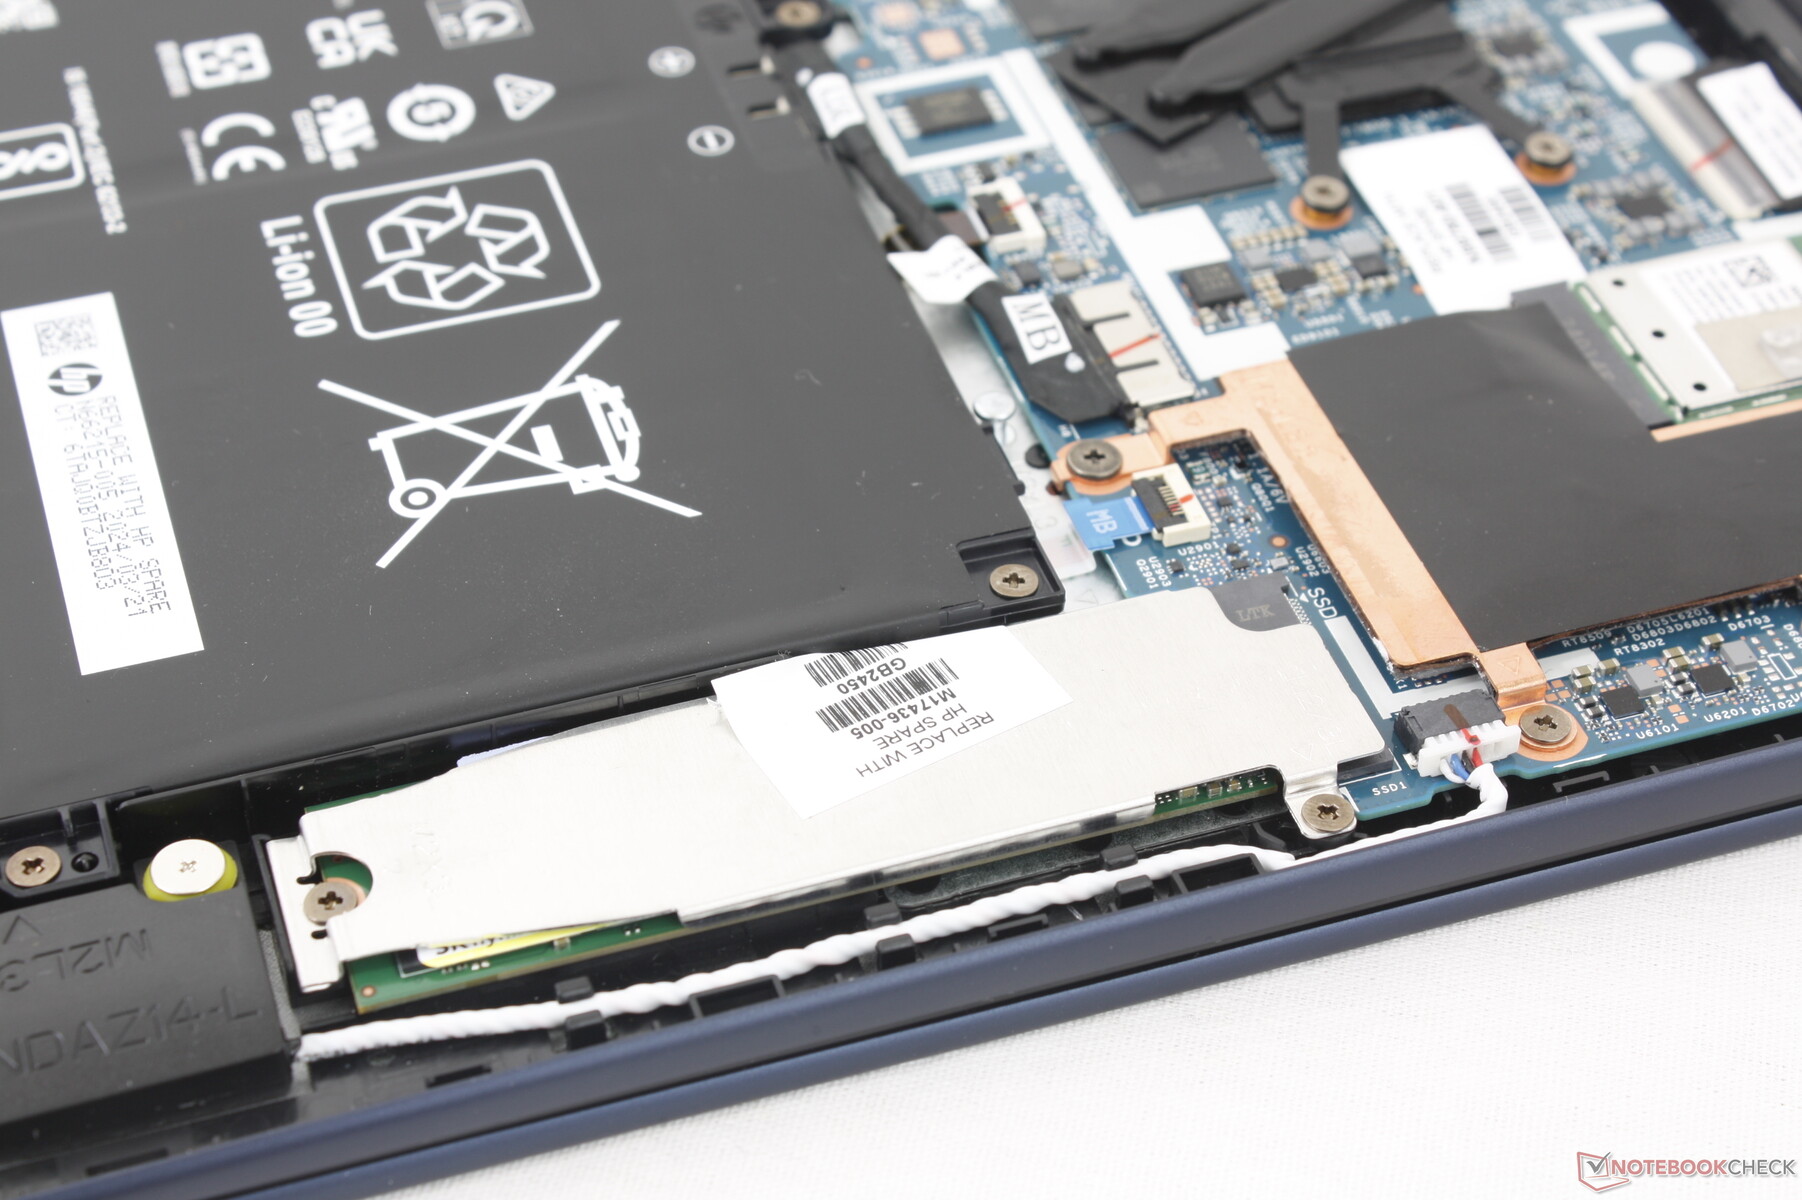
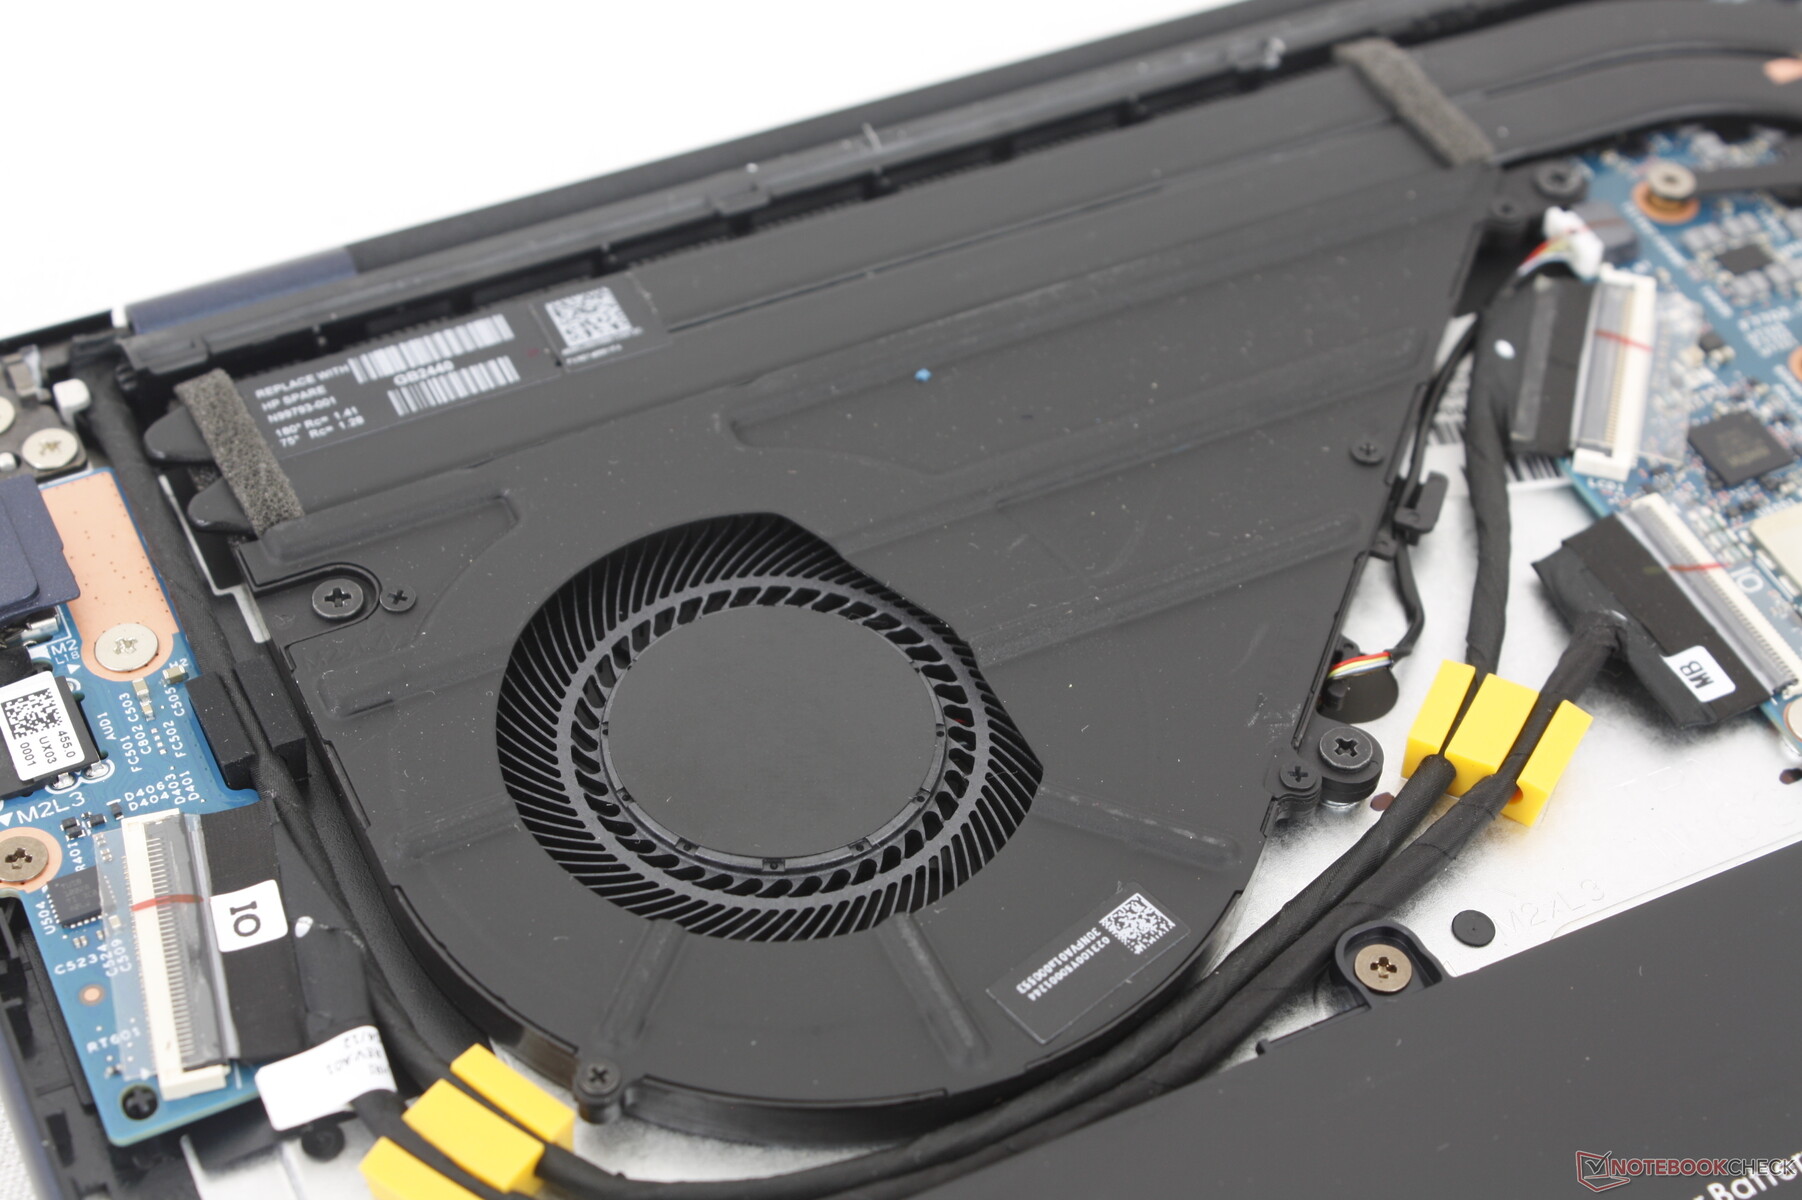
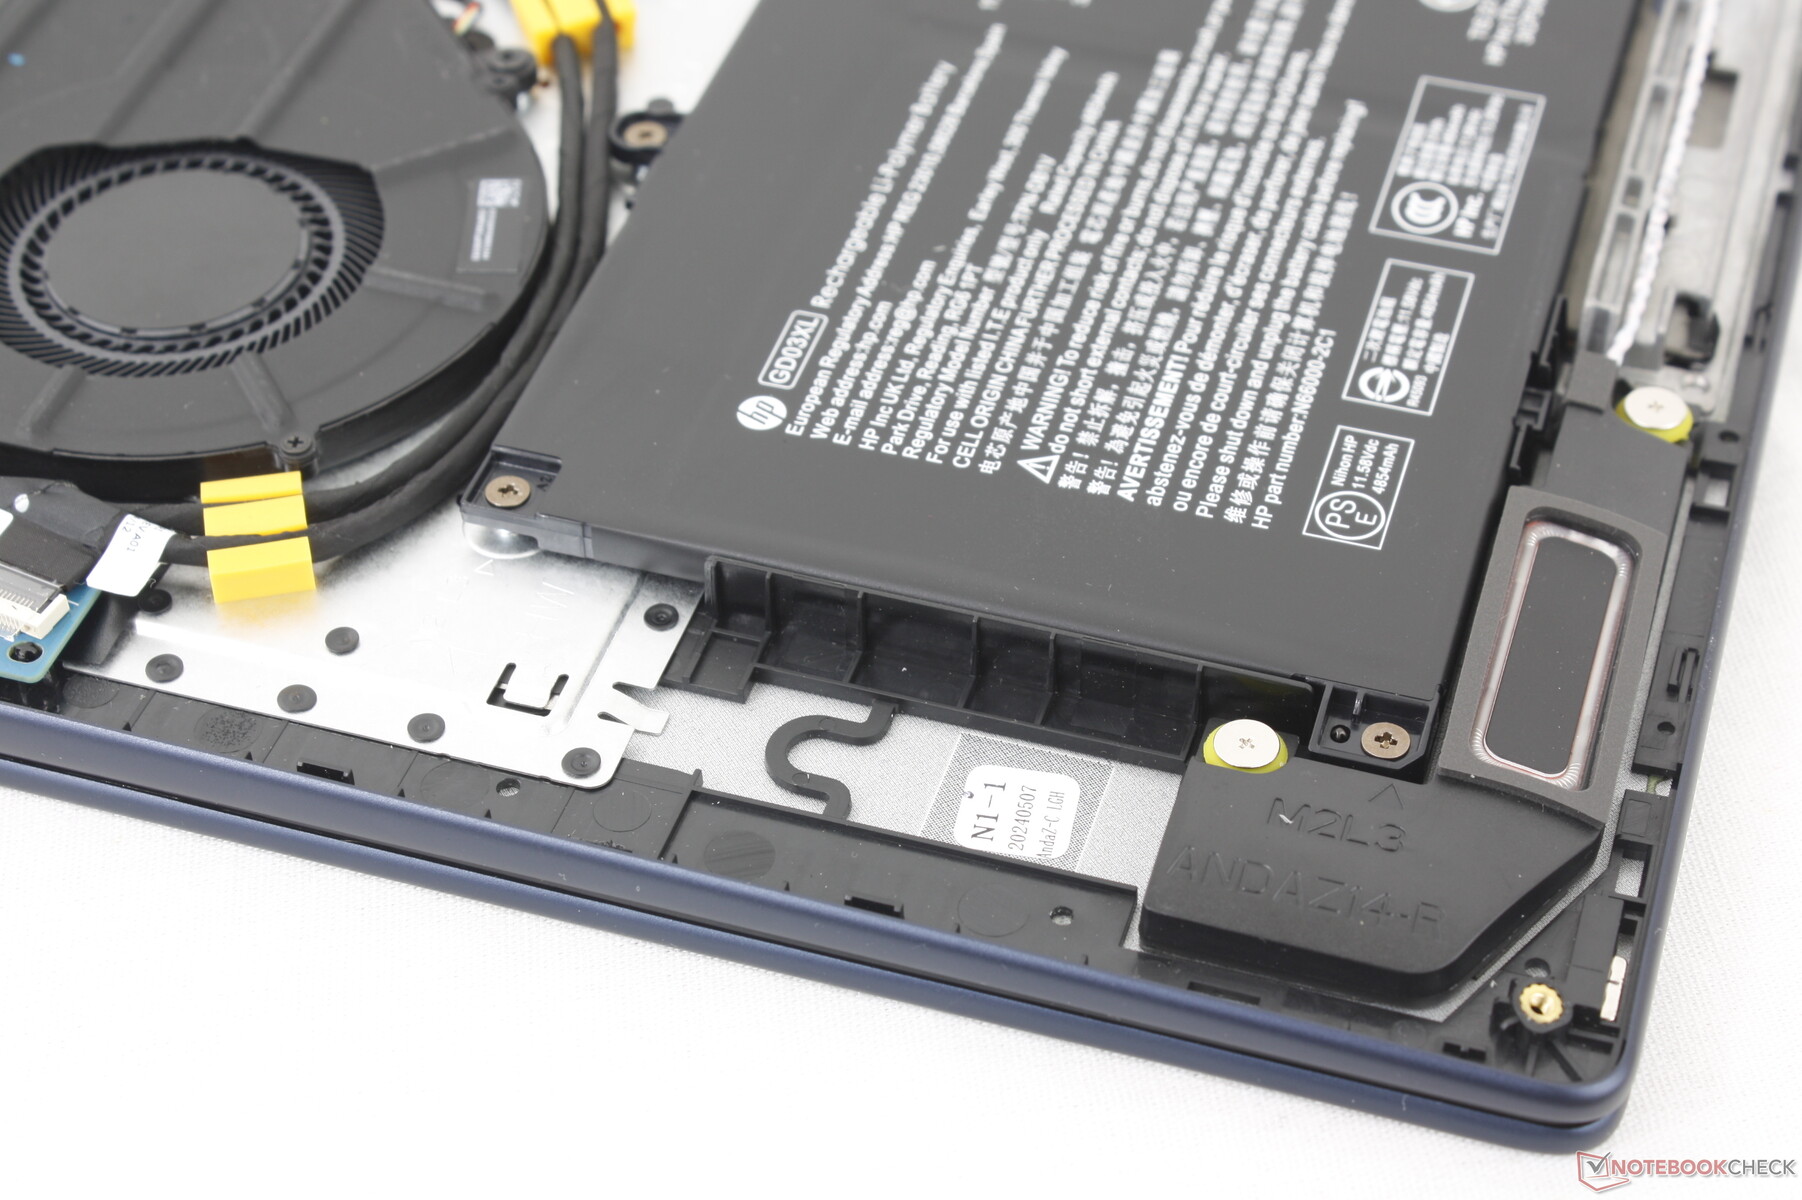
Maintenance
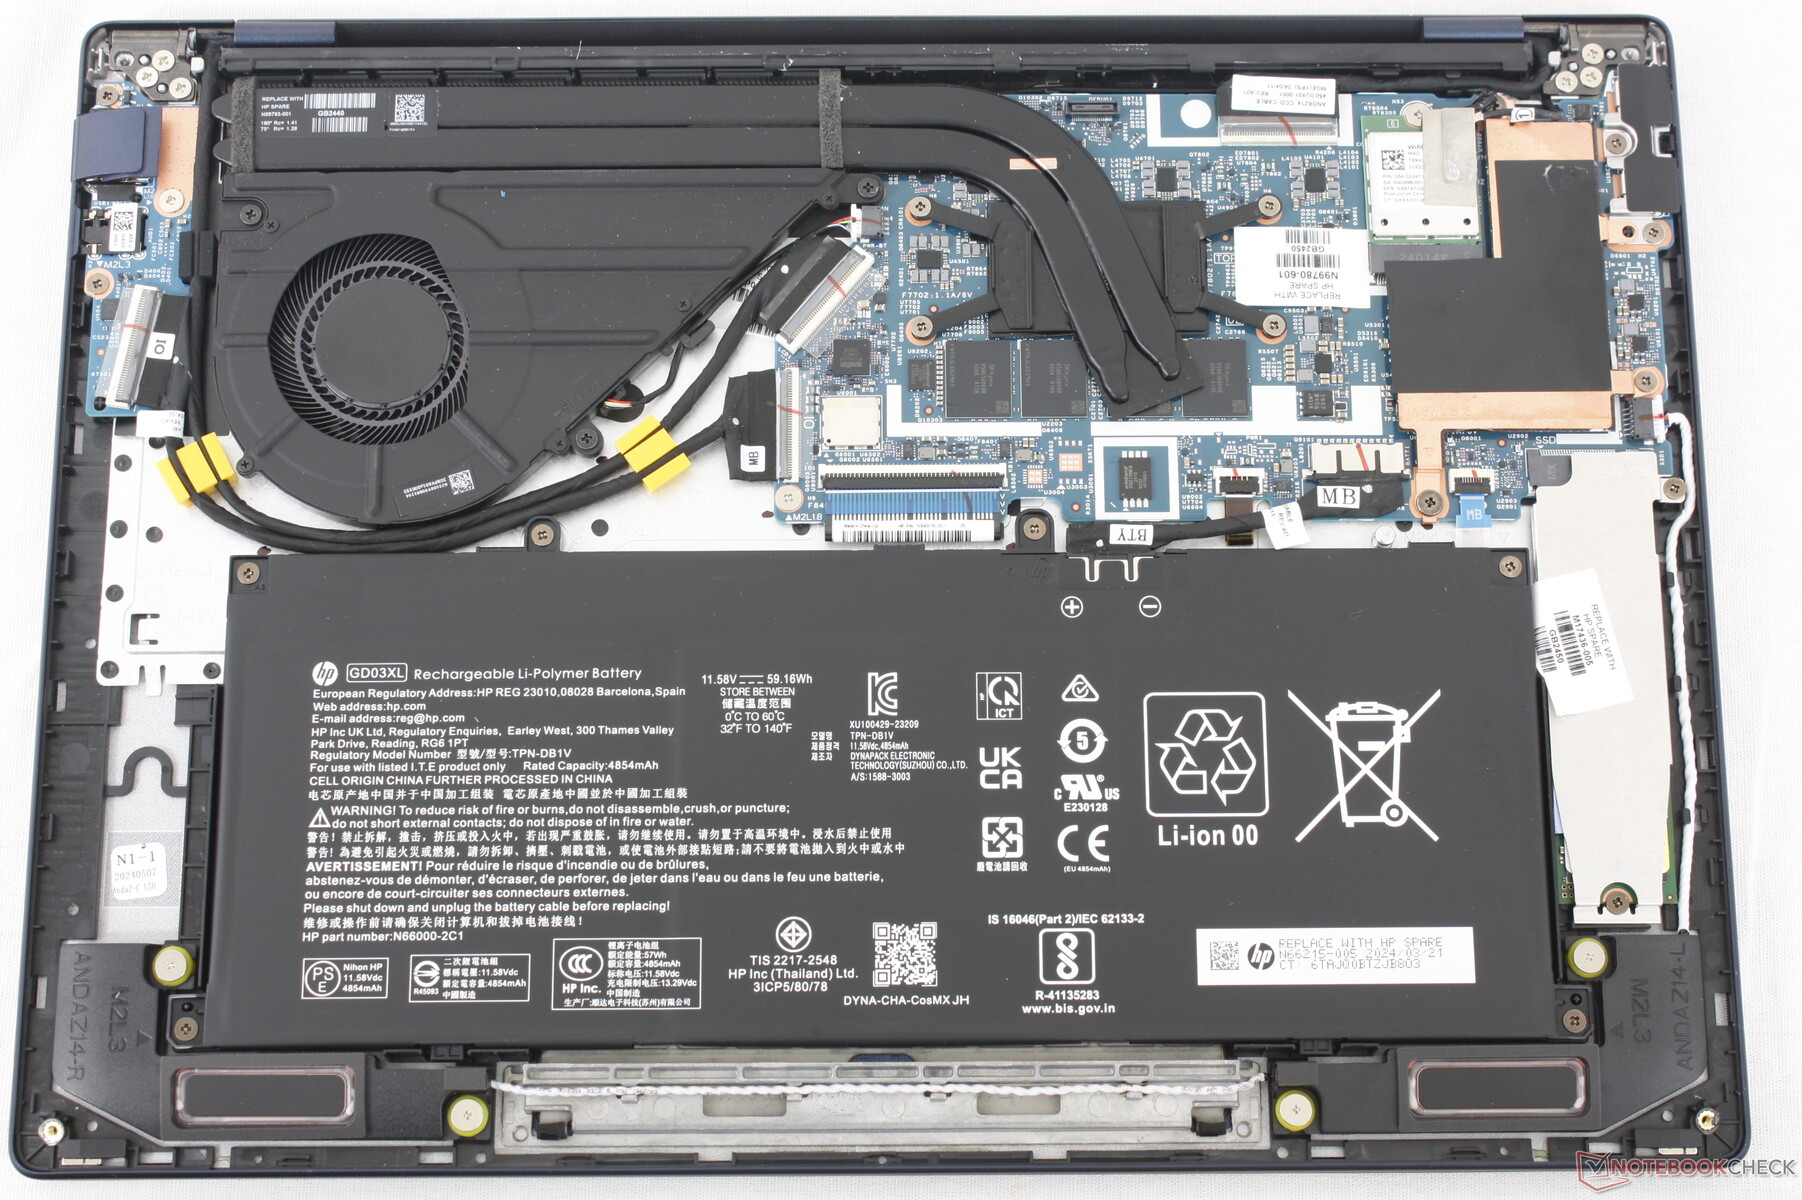
The bottom panel is secured by just four Torx screws for relatively easy servicing. Upgradeability is nevertheless limited to the M.2 2280 PCIe4 SSD slot and M.2 WLAN module as RAM is soldered. The single-fan cooling design is similar to most other EliteBook models like the EliteBook 845 whereas Dragonfly models typically utilize dual-fan designs.
Accessories And Warranty
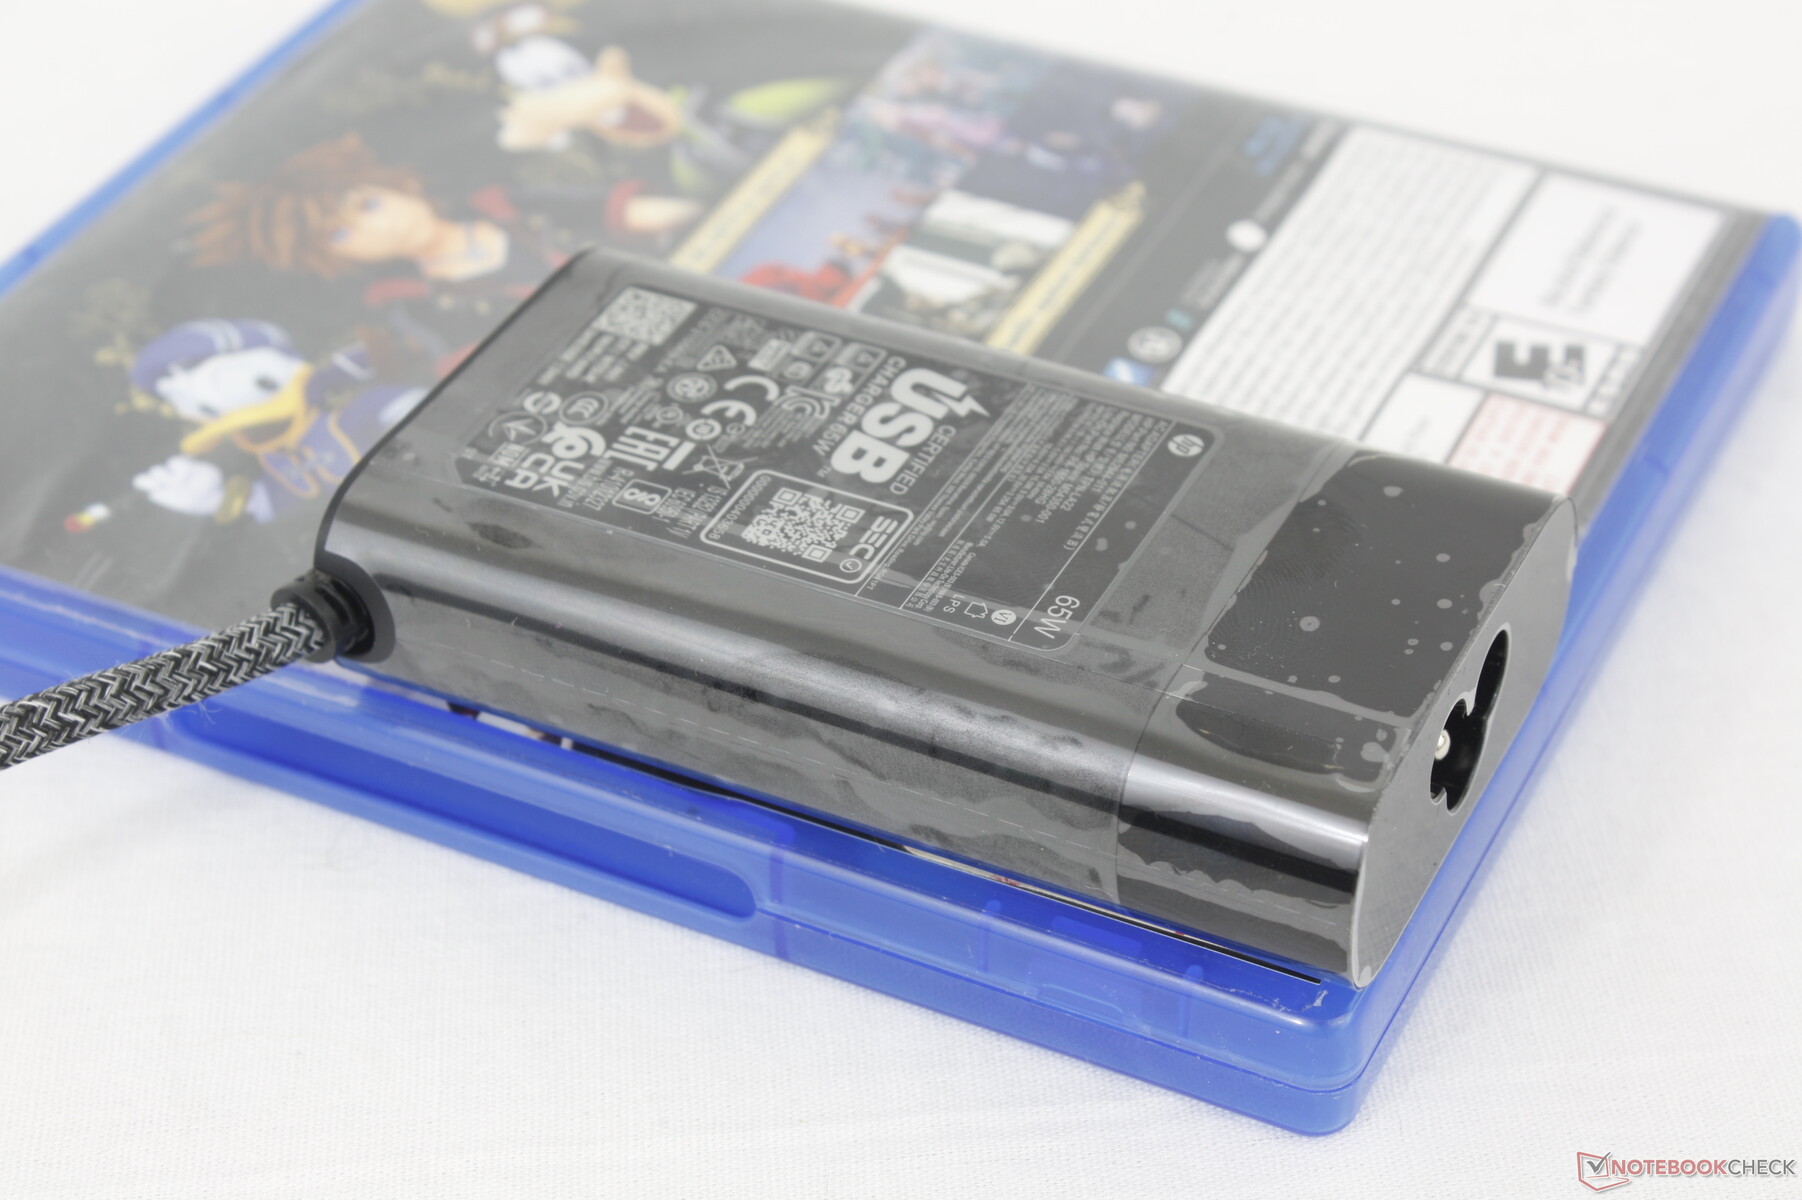
There are no extras in the retail box other than the AC adapter and paperwork. A protective sleeve would have been nice to see given the asking price of the model.
A three-year manufacturer warranty comes standard alongside a year of HP Wolf Security Pro software protection. The longer base warranty is a key differentiator between the consumer-oriented OmniBook X 14 and business-oriented EliteBook Ultra G1q 14.
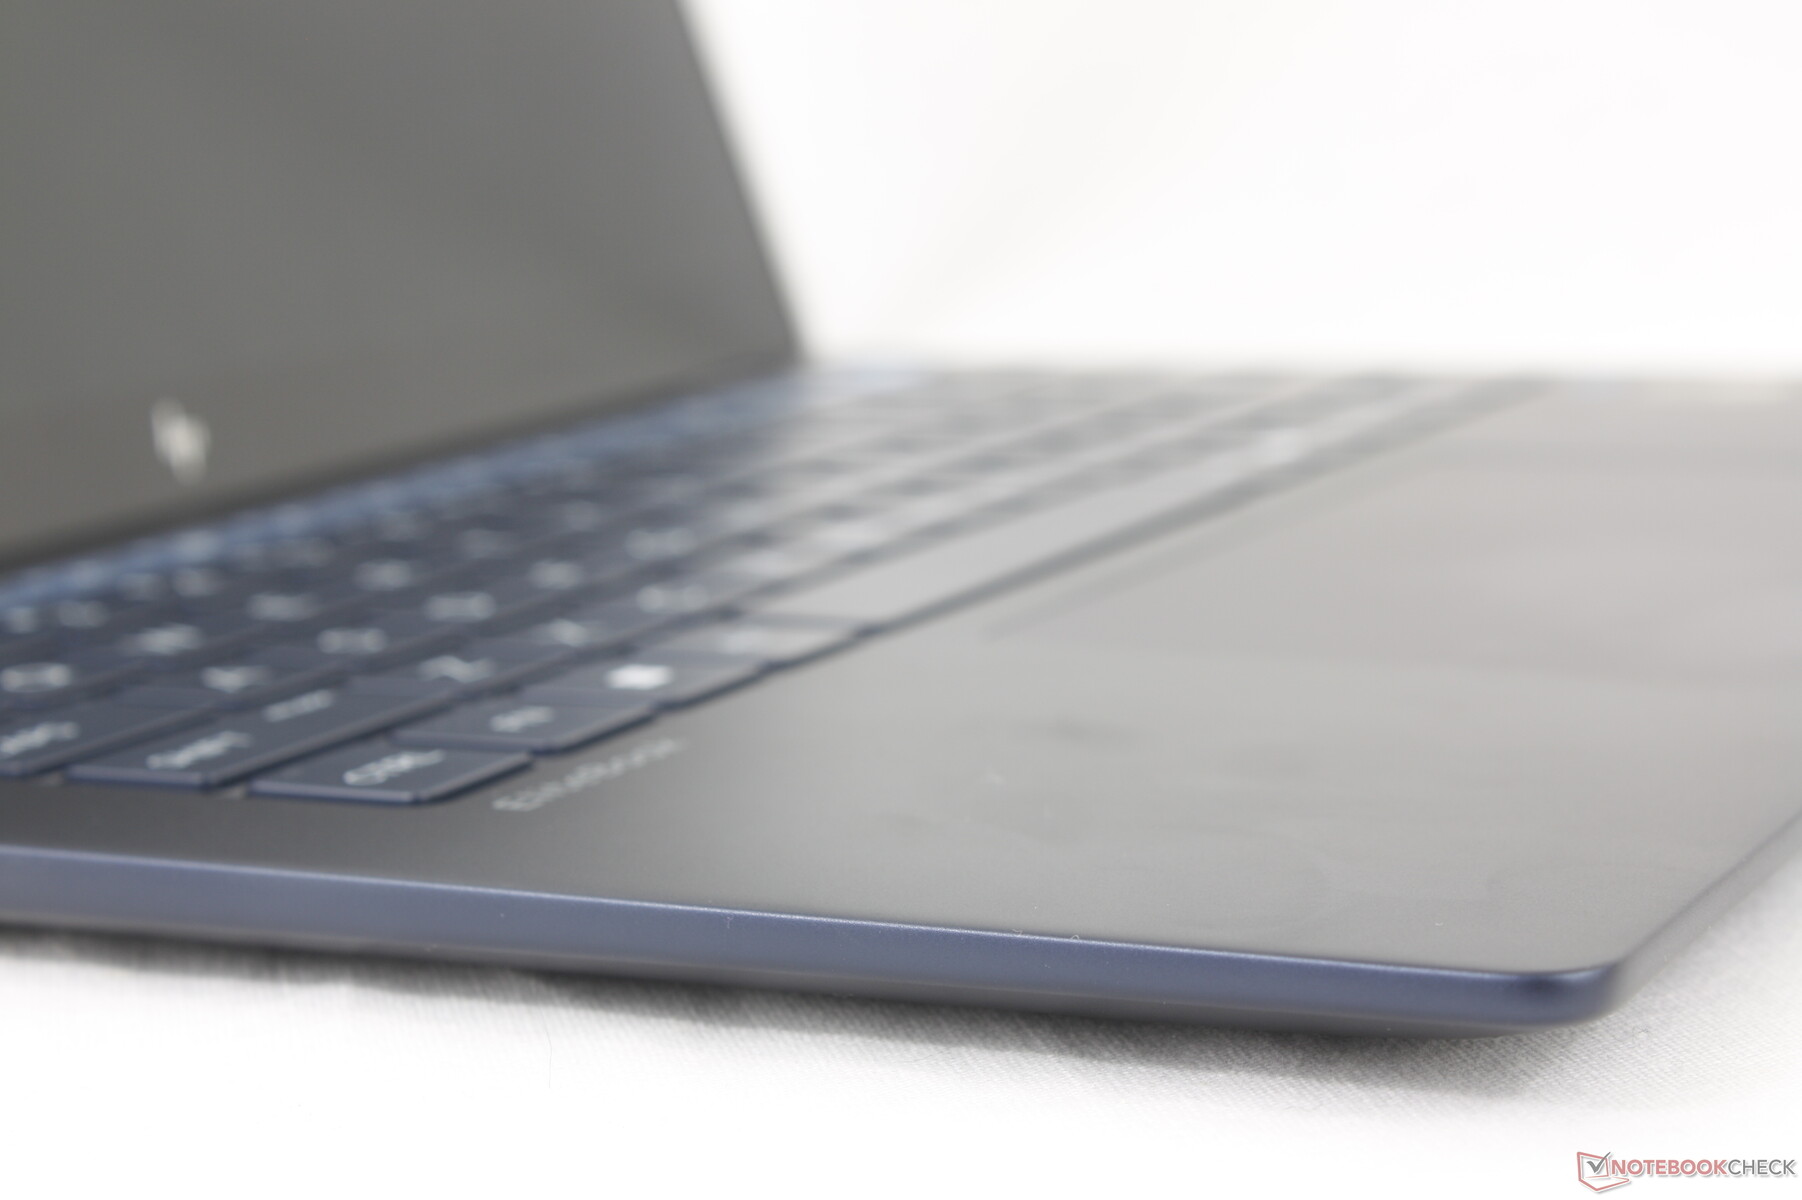
Input Devices — Familiar Dragonfly Feel
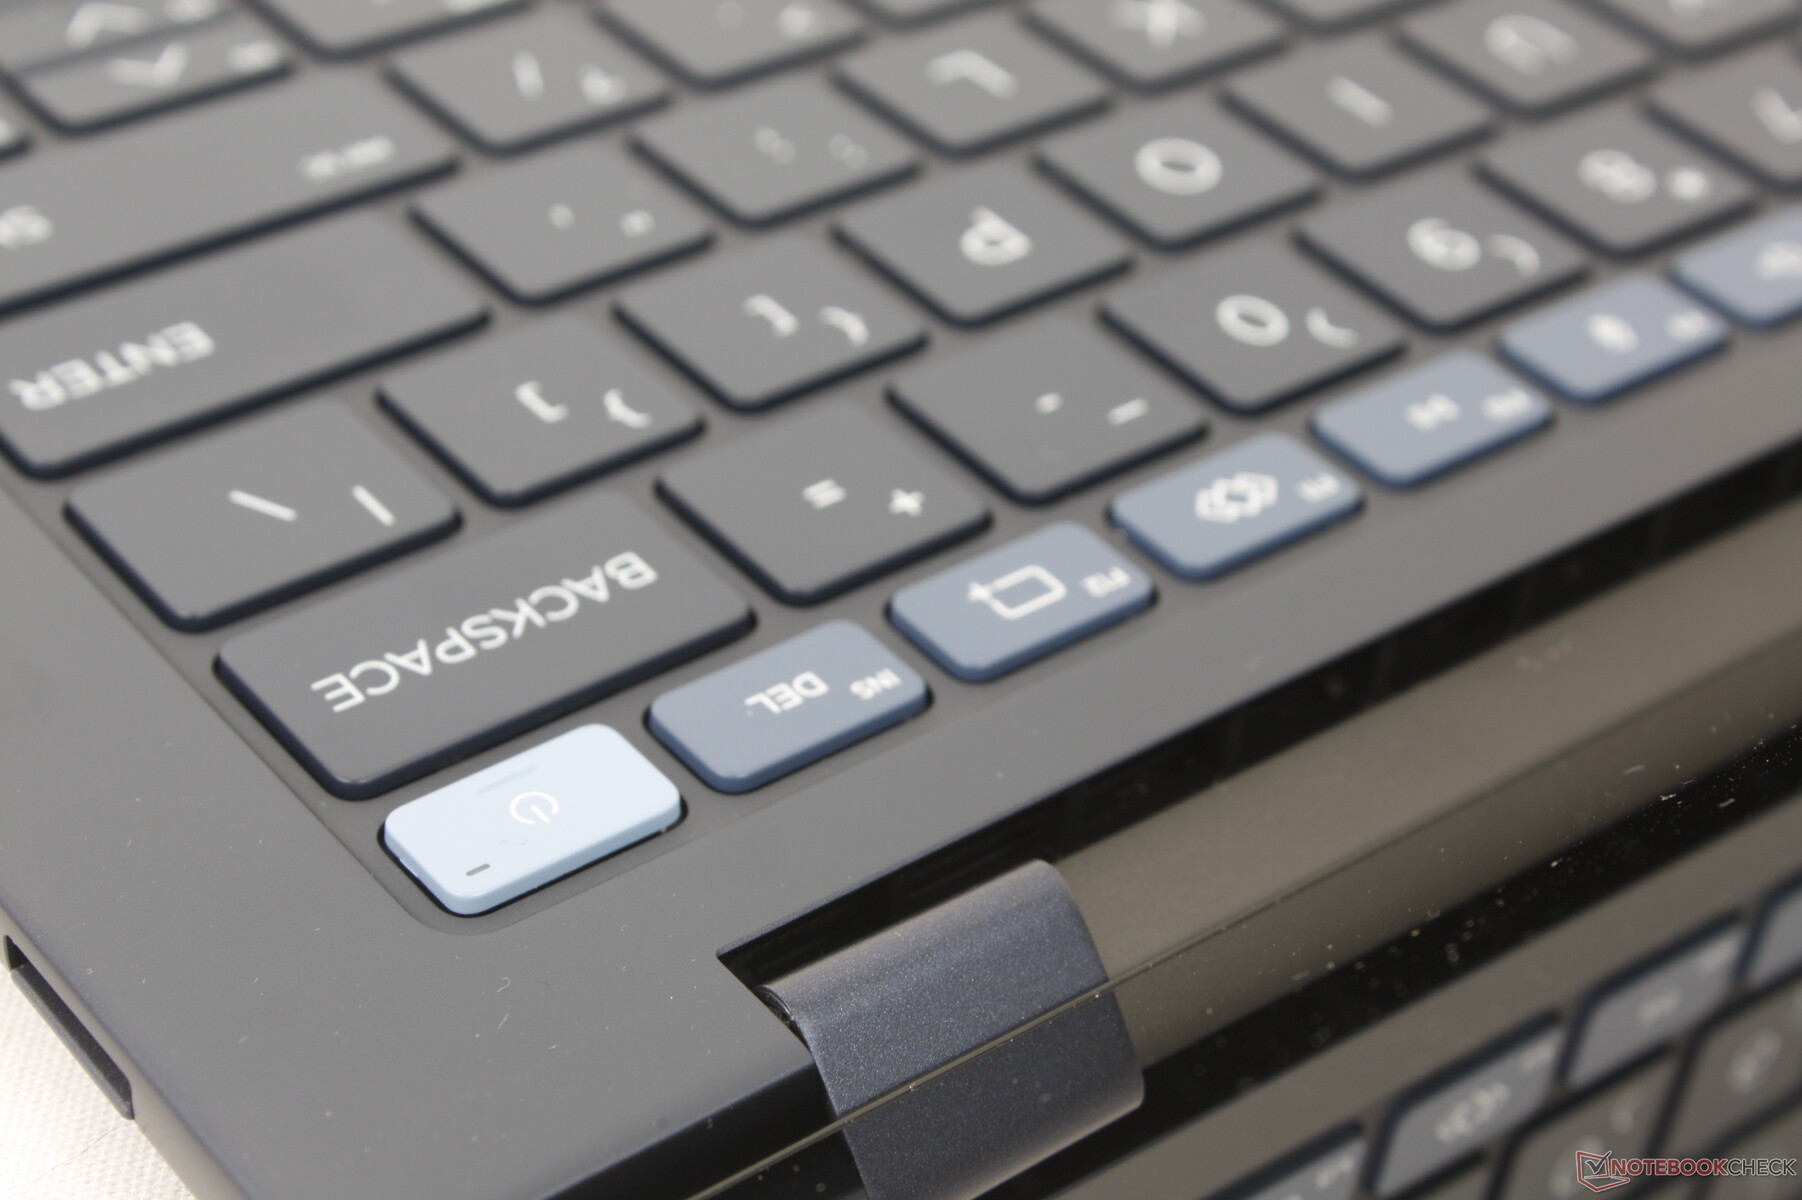
Keyboard
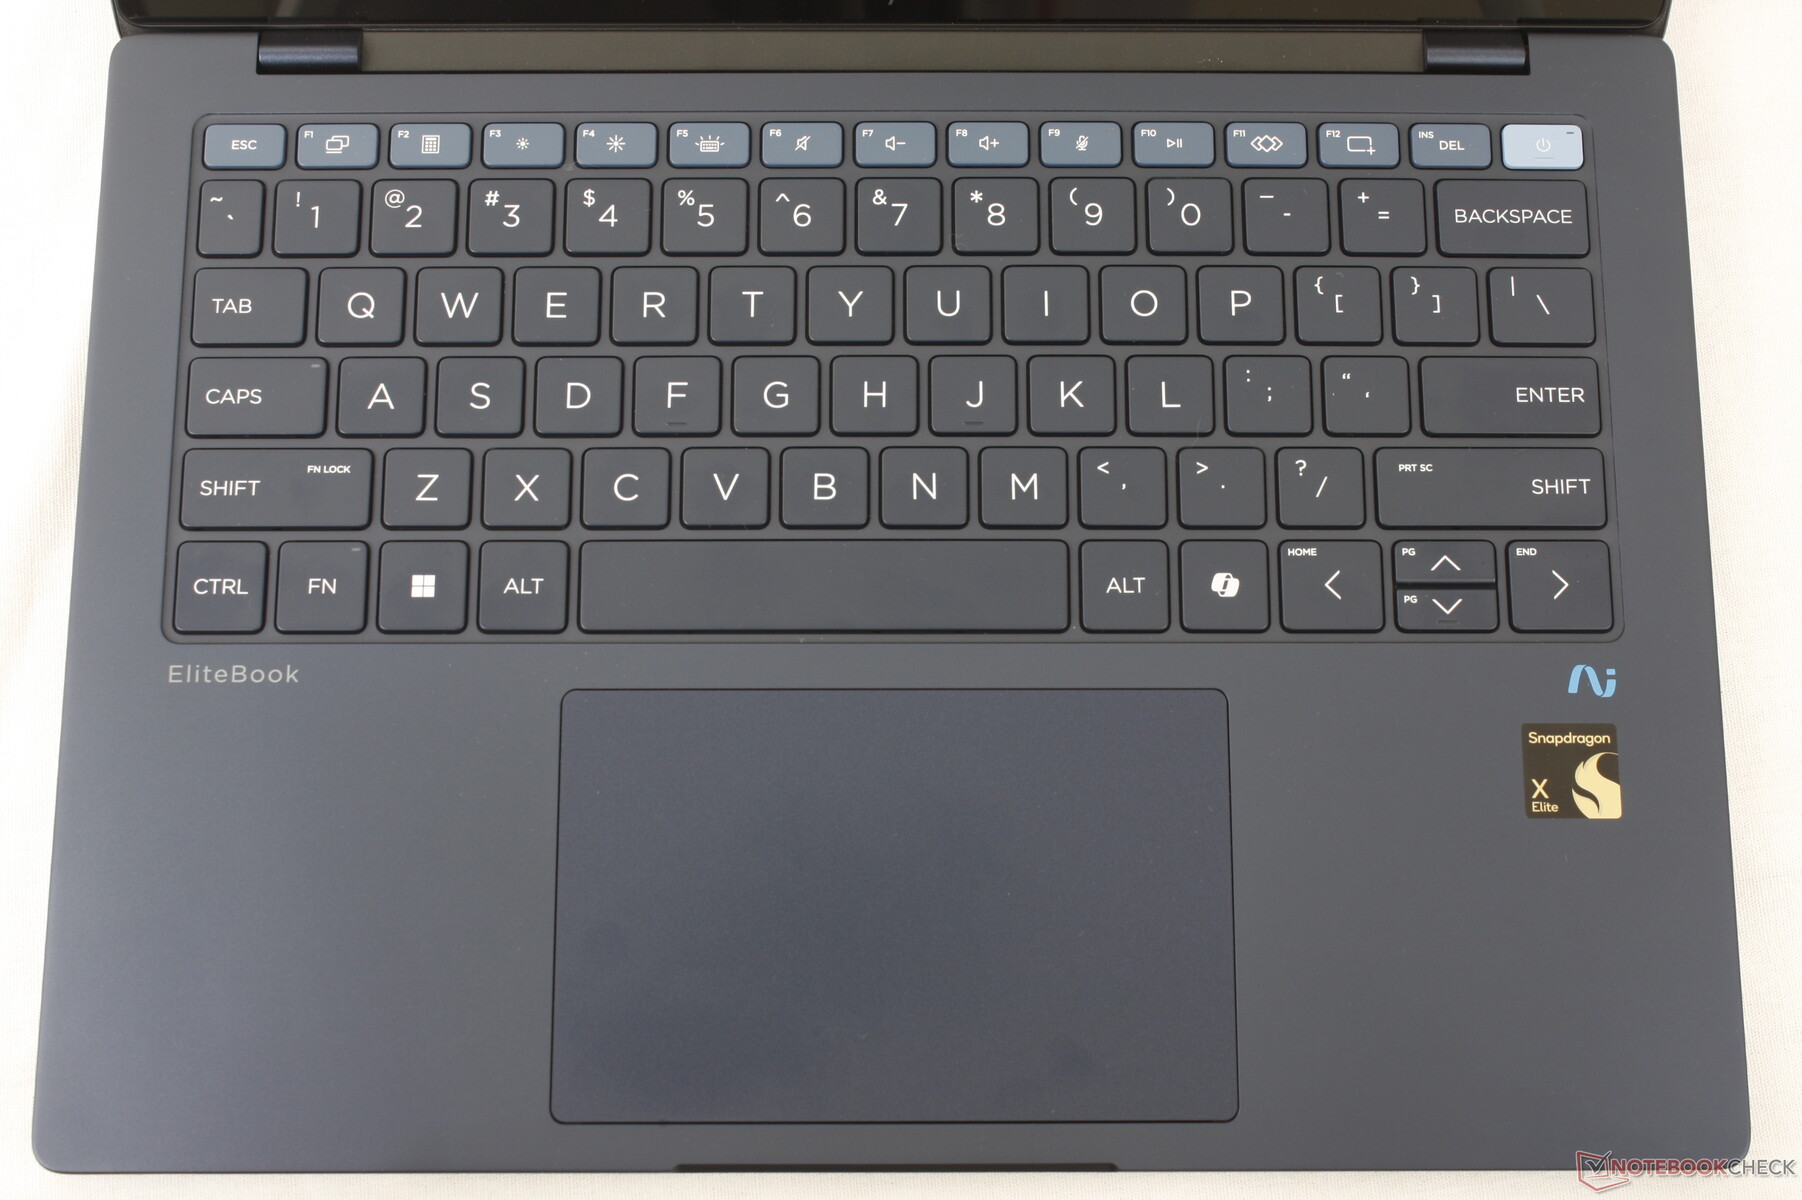
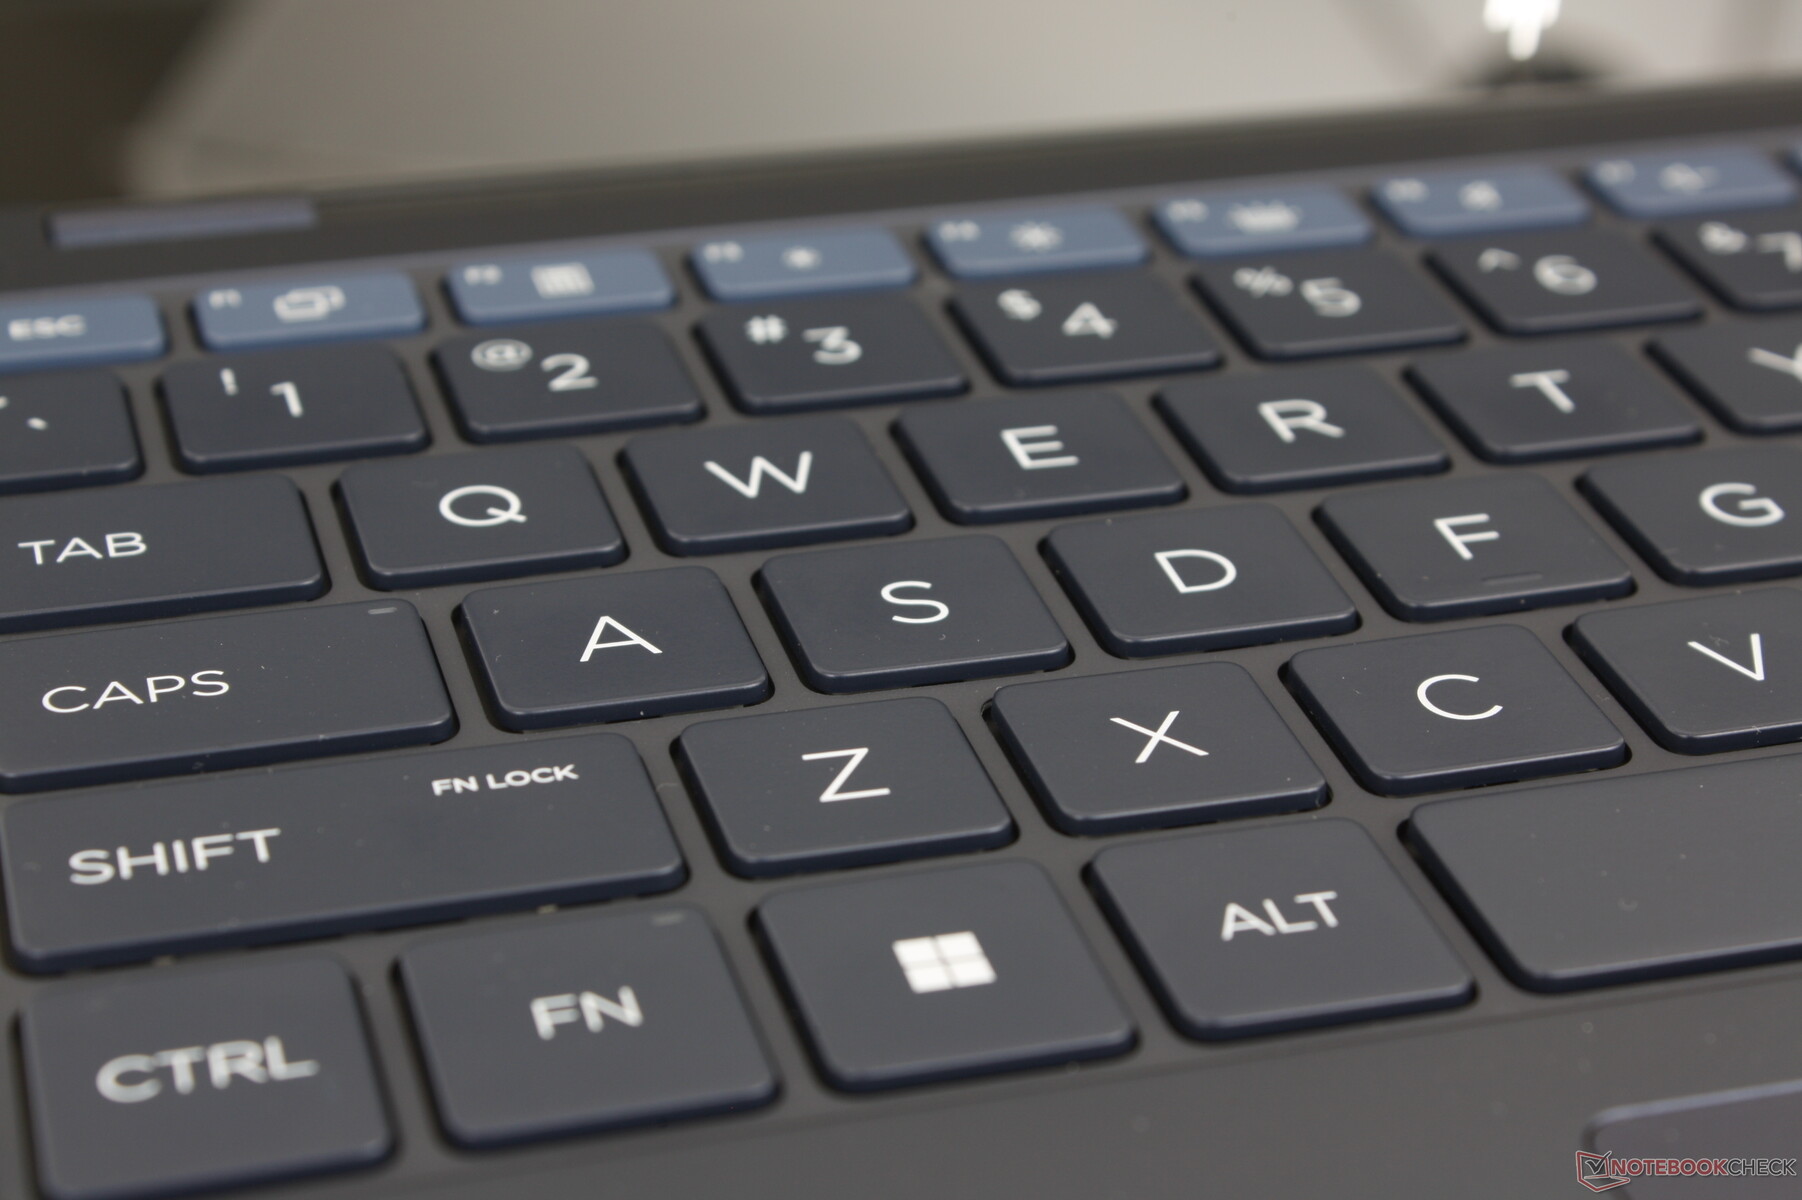
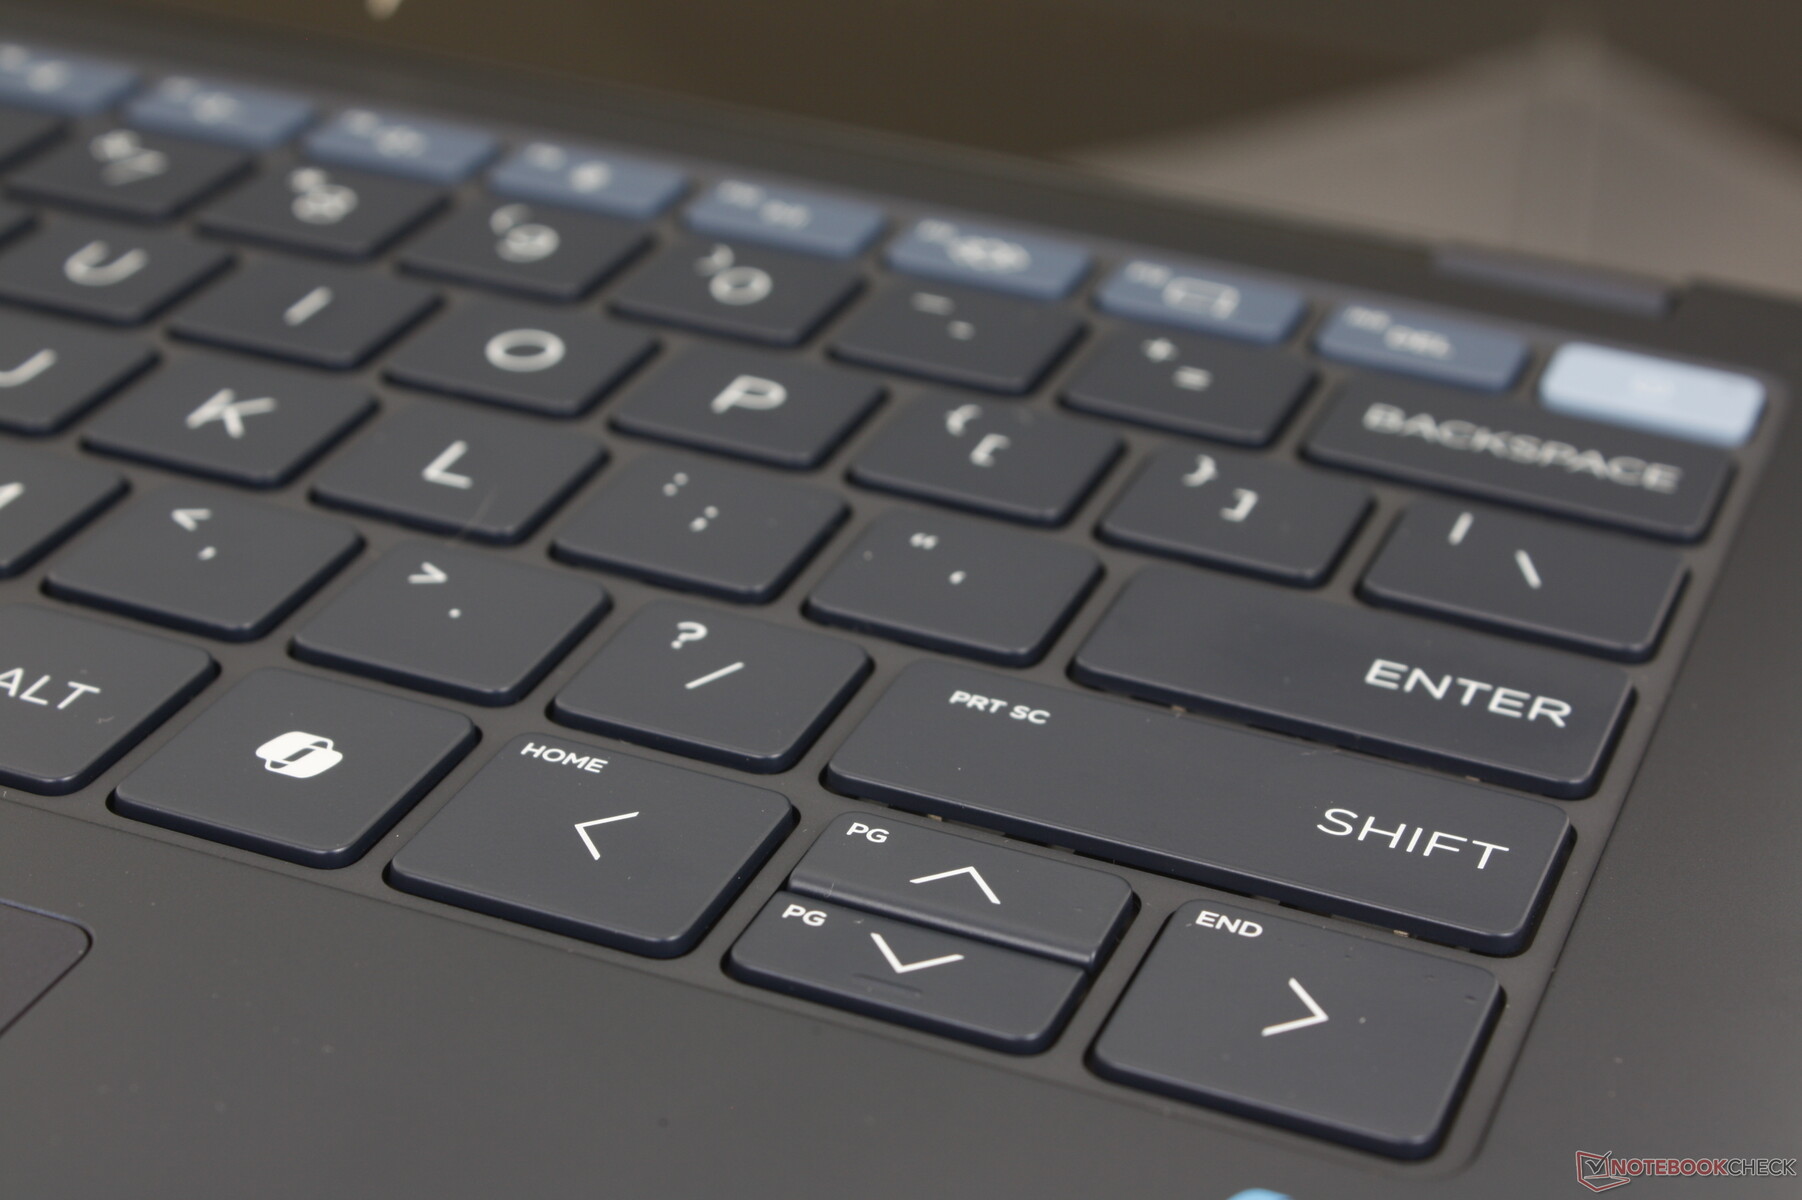
Keyboard layout is more similar to the Dragonfly Pro than the EliteBook 845 especially in terms of key size and font. Travel feels very shallow including the Space and Enter keys which could have benefited from stronger feedback.
All keys and symbols become illuminated when the backlight is active.
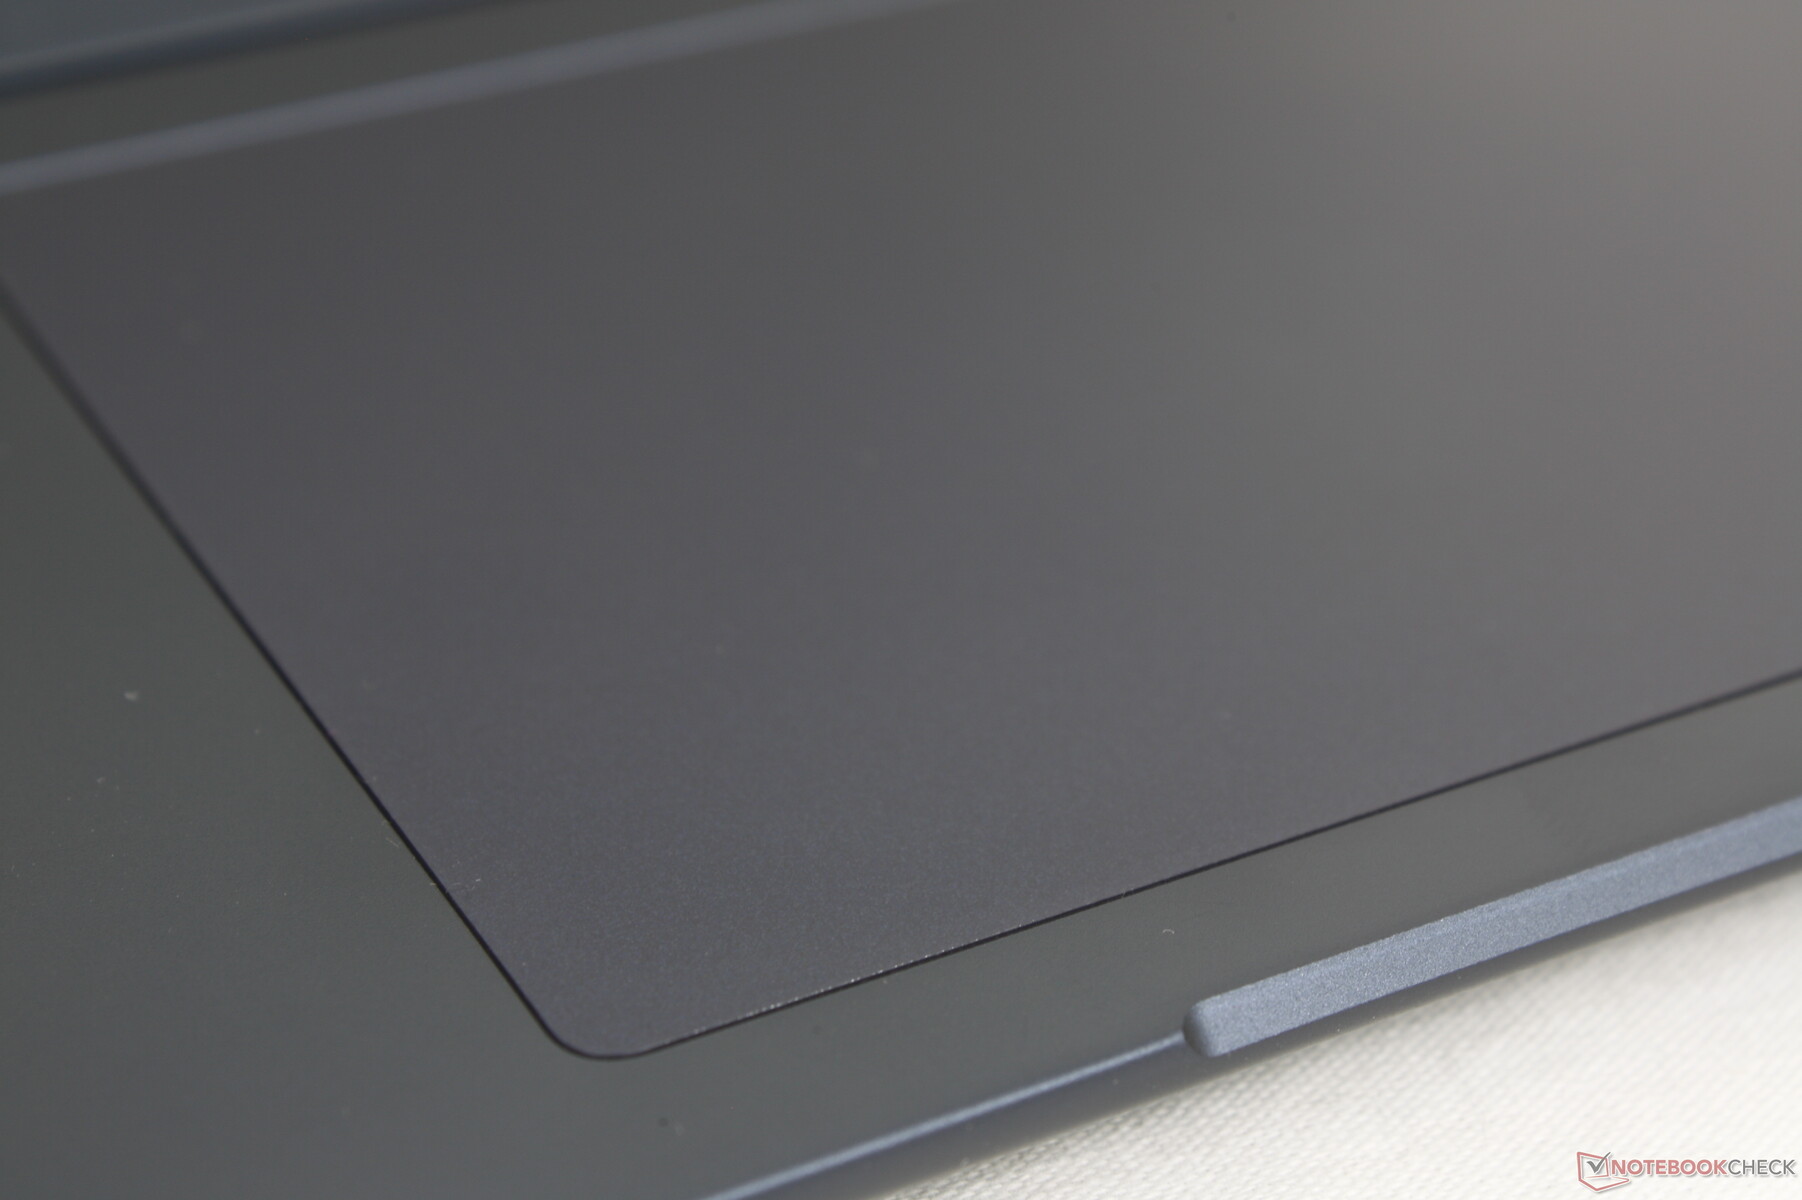
Touchpad
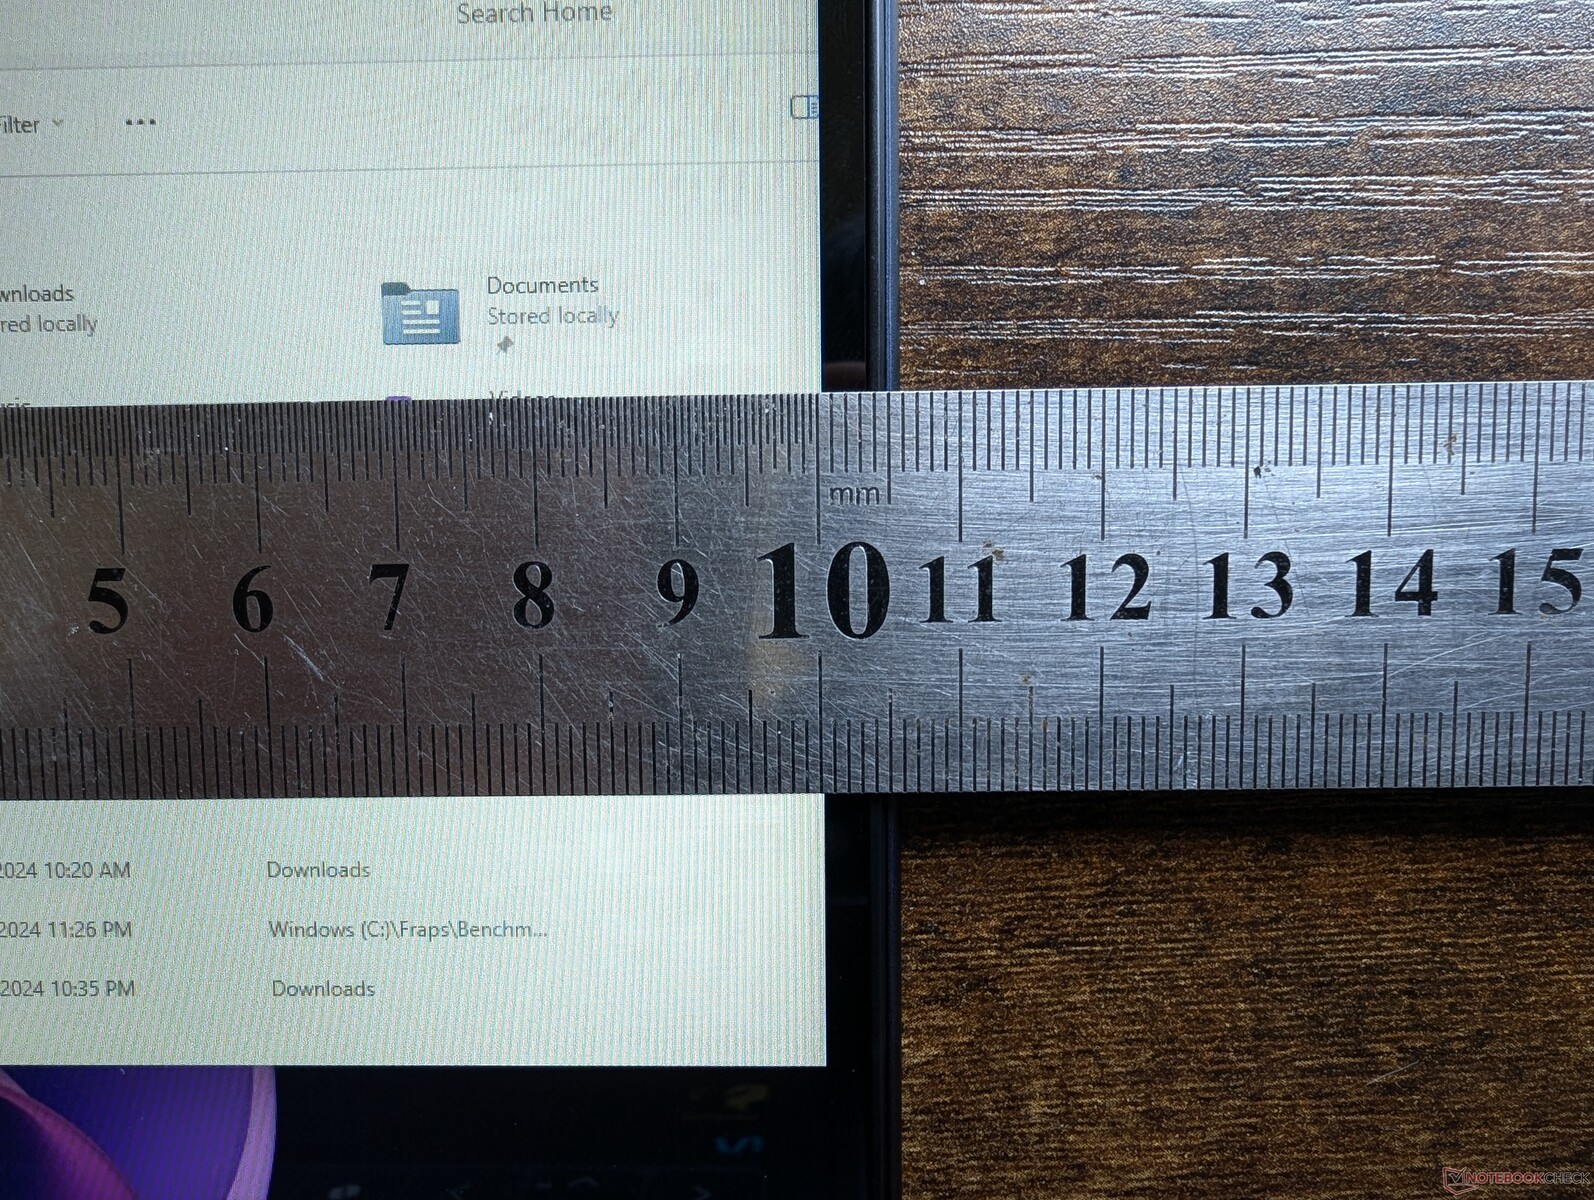
Surface area is ever-so-slightly wider than on the Dragonfly Pro (12.5 x 8 cm vs. 12.0 x 8 cm) to be even more spacious for comfortable multi-touch inputs. Traction is smooth with only a bit of stickiness when gliding at slower speeds for better accuracy. Feedback when pushing down on the surface is also sharper, firmer, and louder than on the XPS or Lenovo IdeaPad series. This is one of the more satisfying and reliable clickpads available at least when not accounting for trackpads with dedicated buttons.
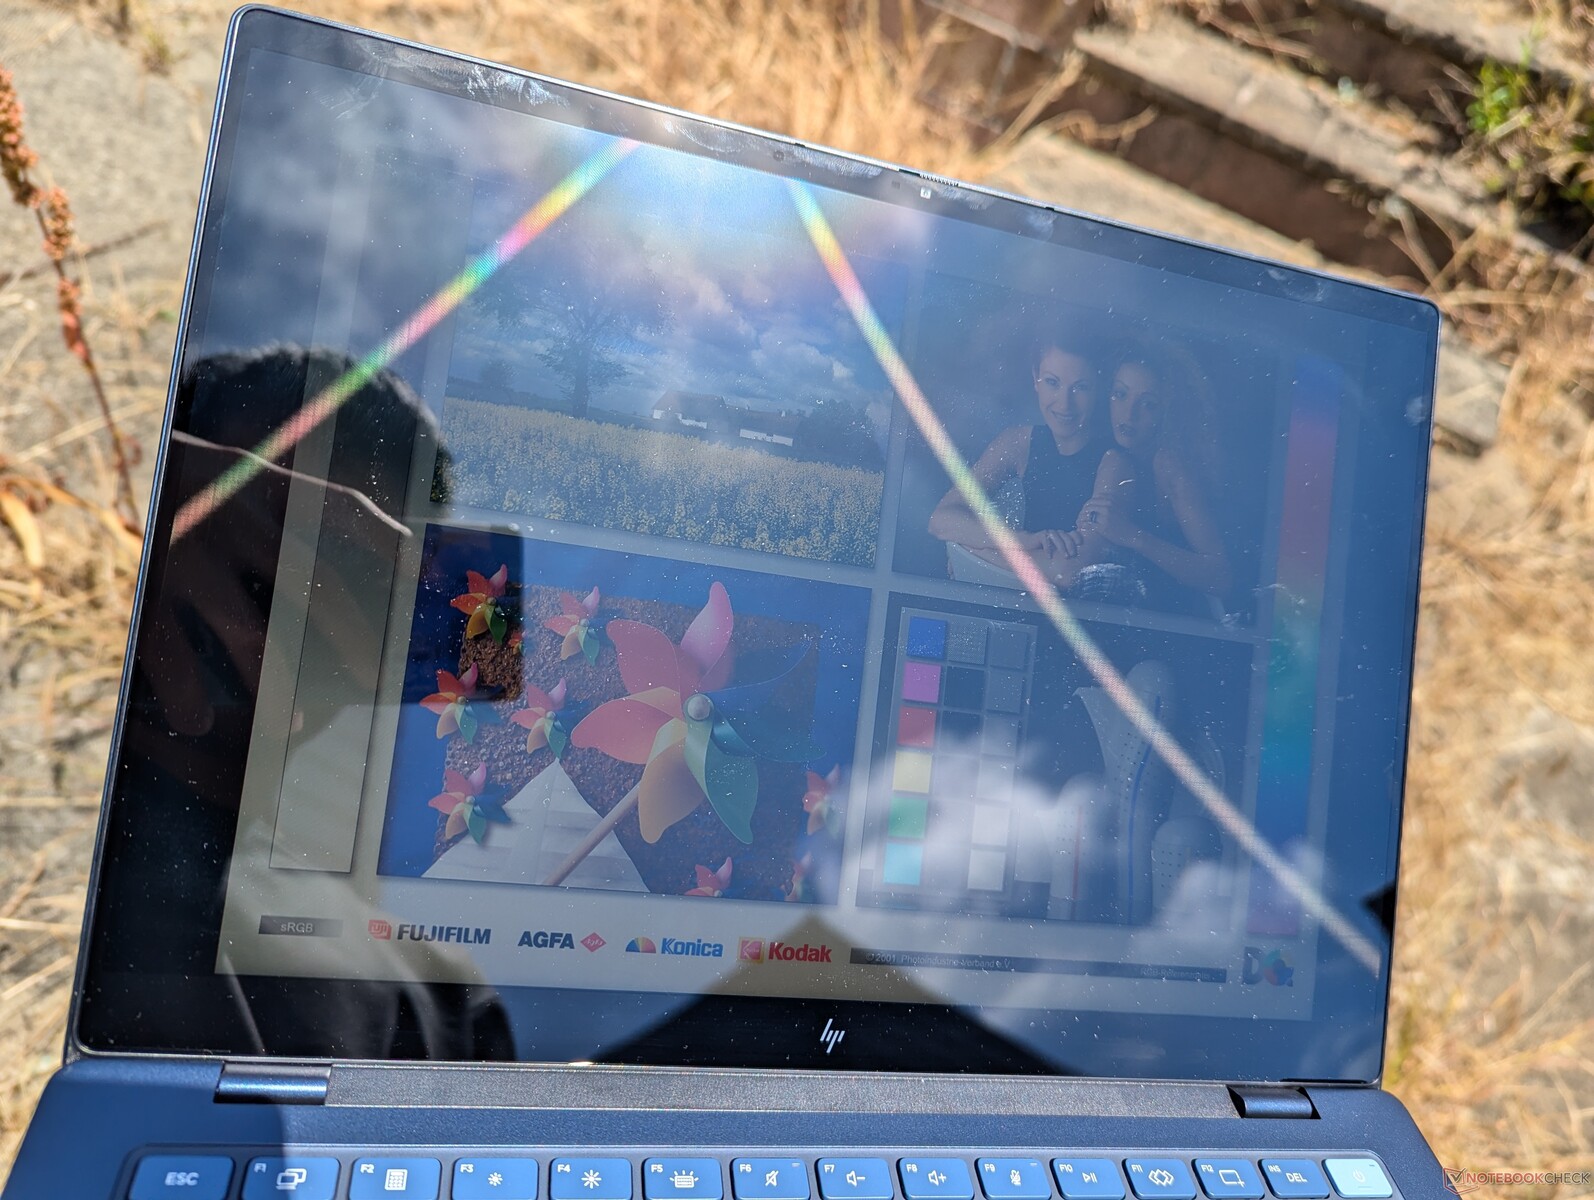
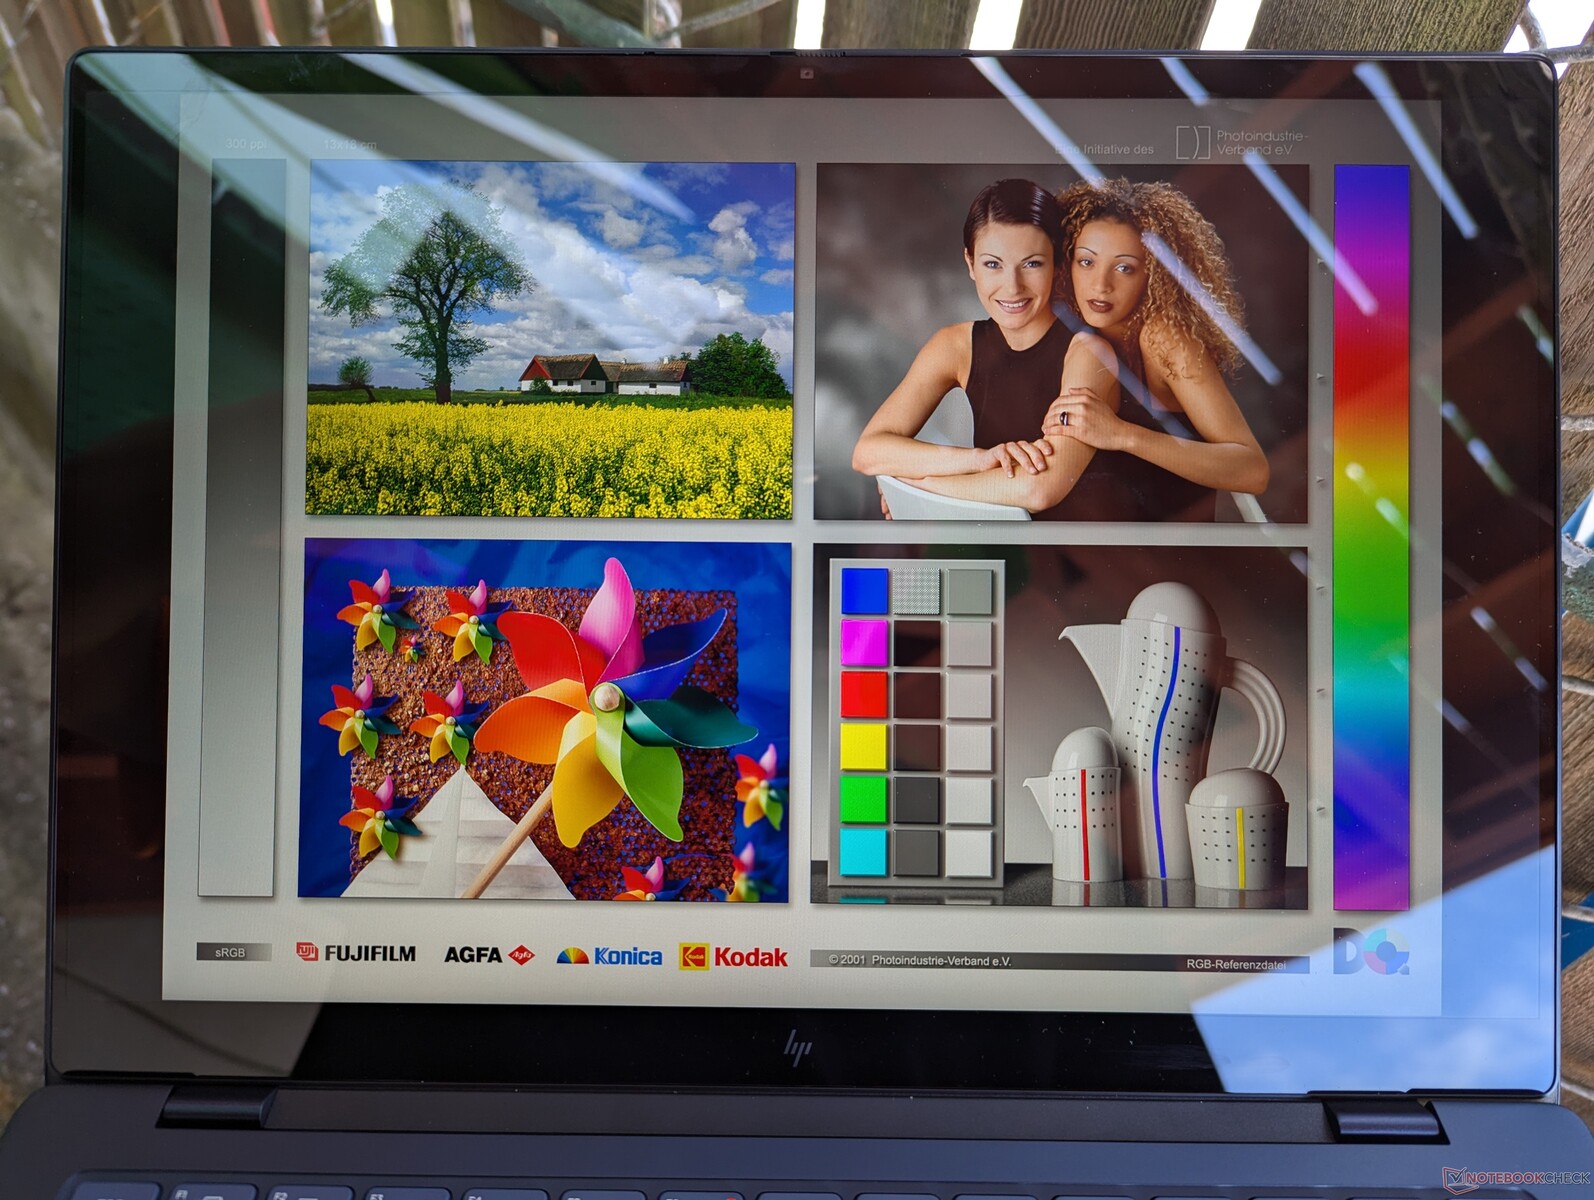
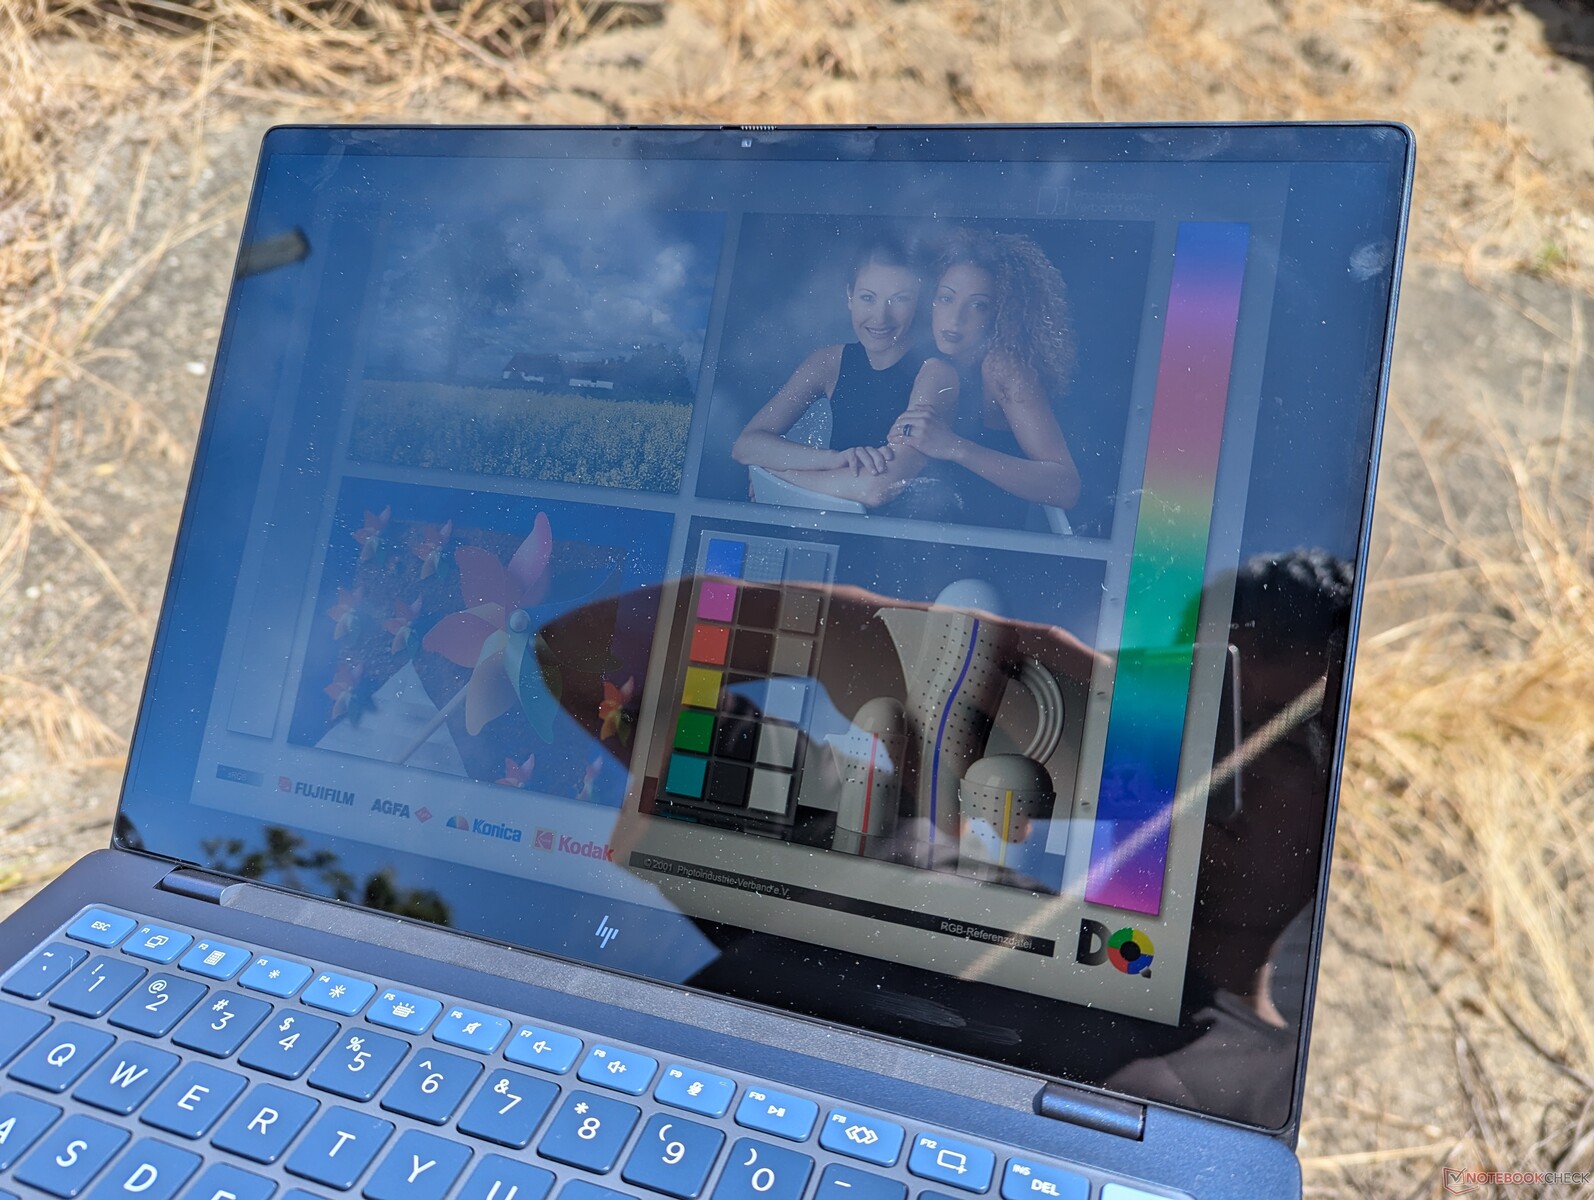
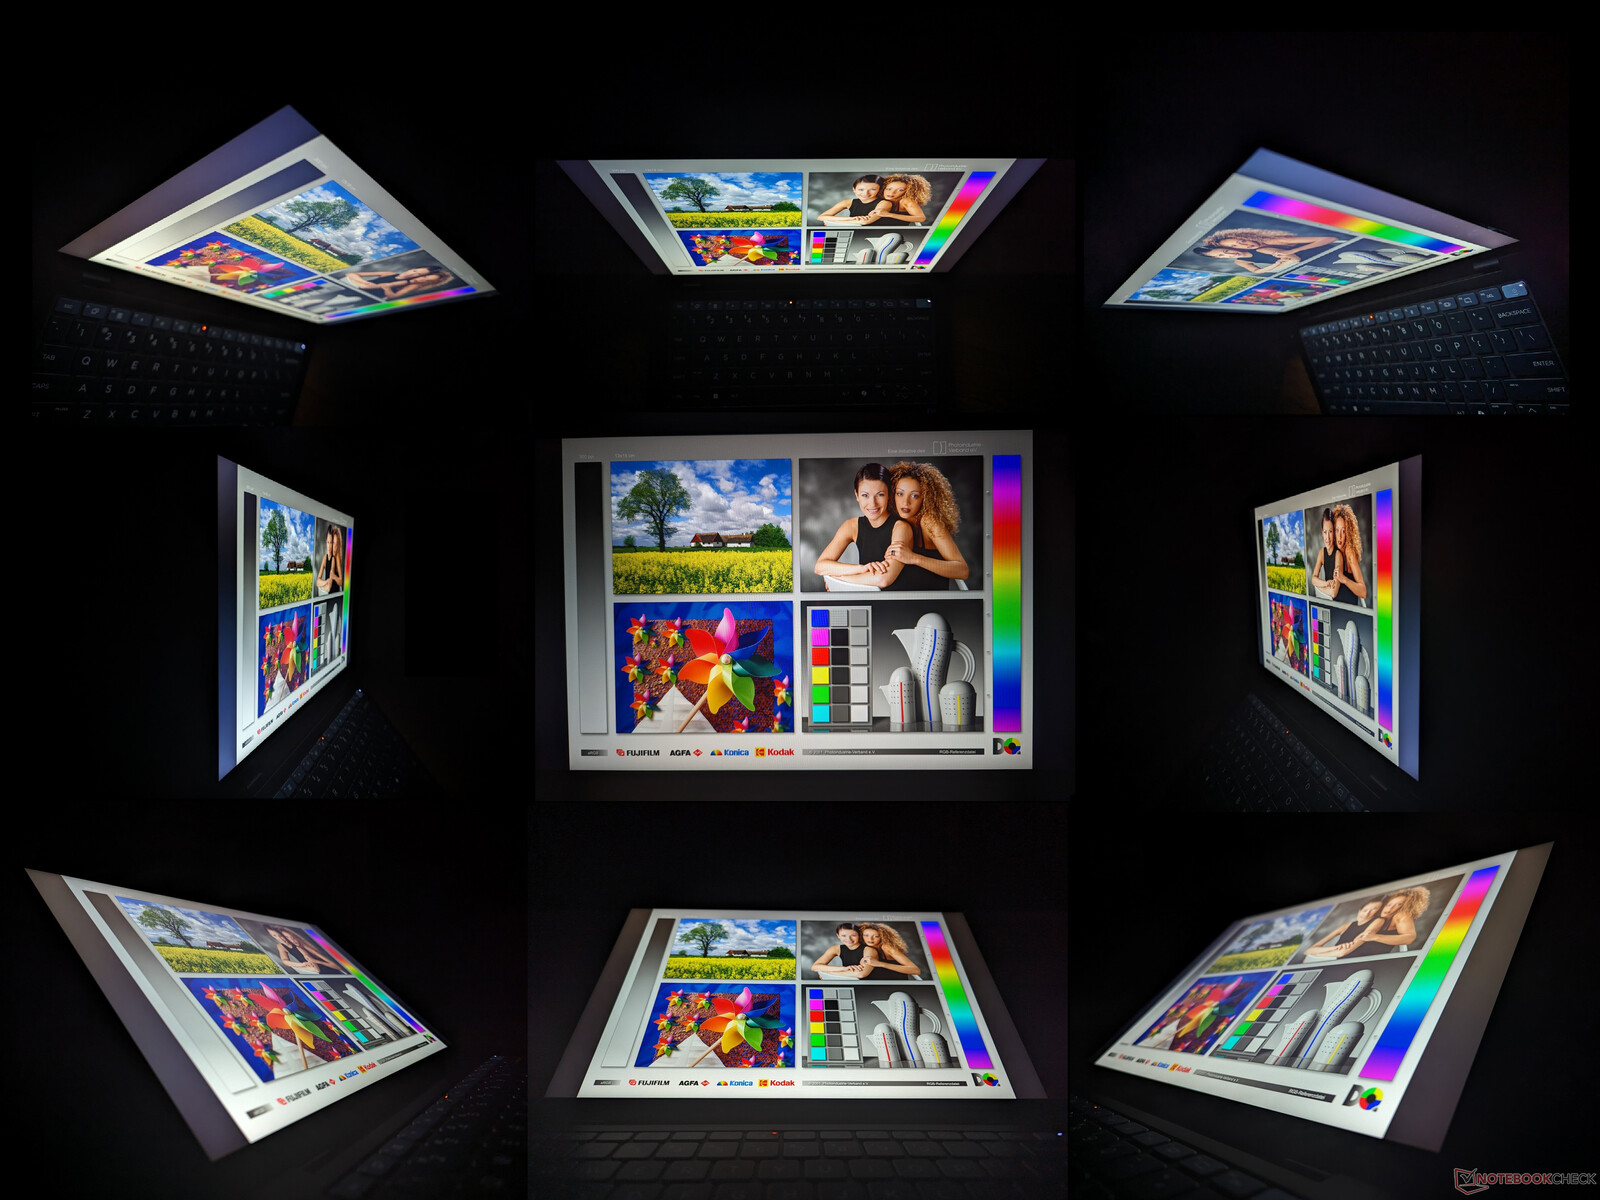
Display — Standard 60 Hz IPS
As special as the CPU may be, the touchscreen is quite run-of-the-mill. The IPS panel offers full sRGB colors, sub QHD resolution, and faster black-white and gray-gray response times than the 14-inch panel on the Dragonfly Pro. Otherwise, it lacks features found on more advanced panels like HDR support, higher refresh rates, and Windows VRR.

| |||||||||||||||||||||||||
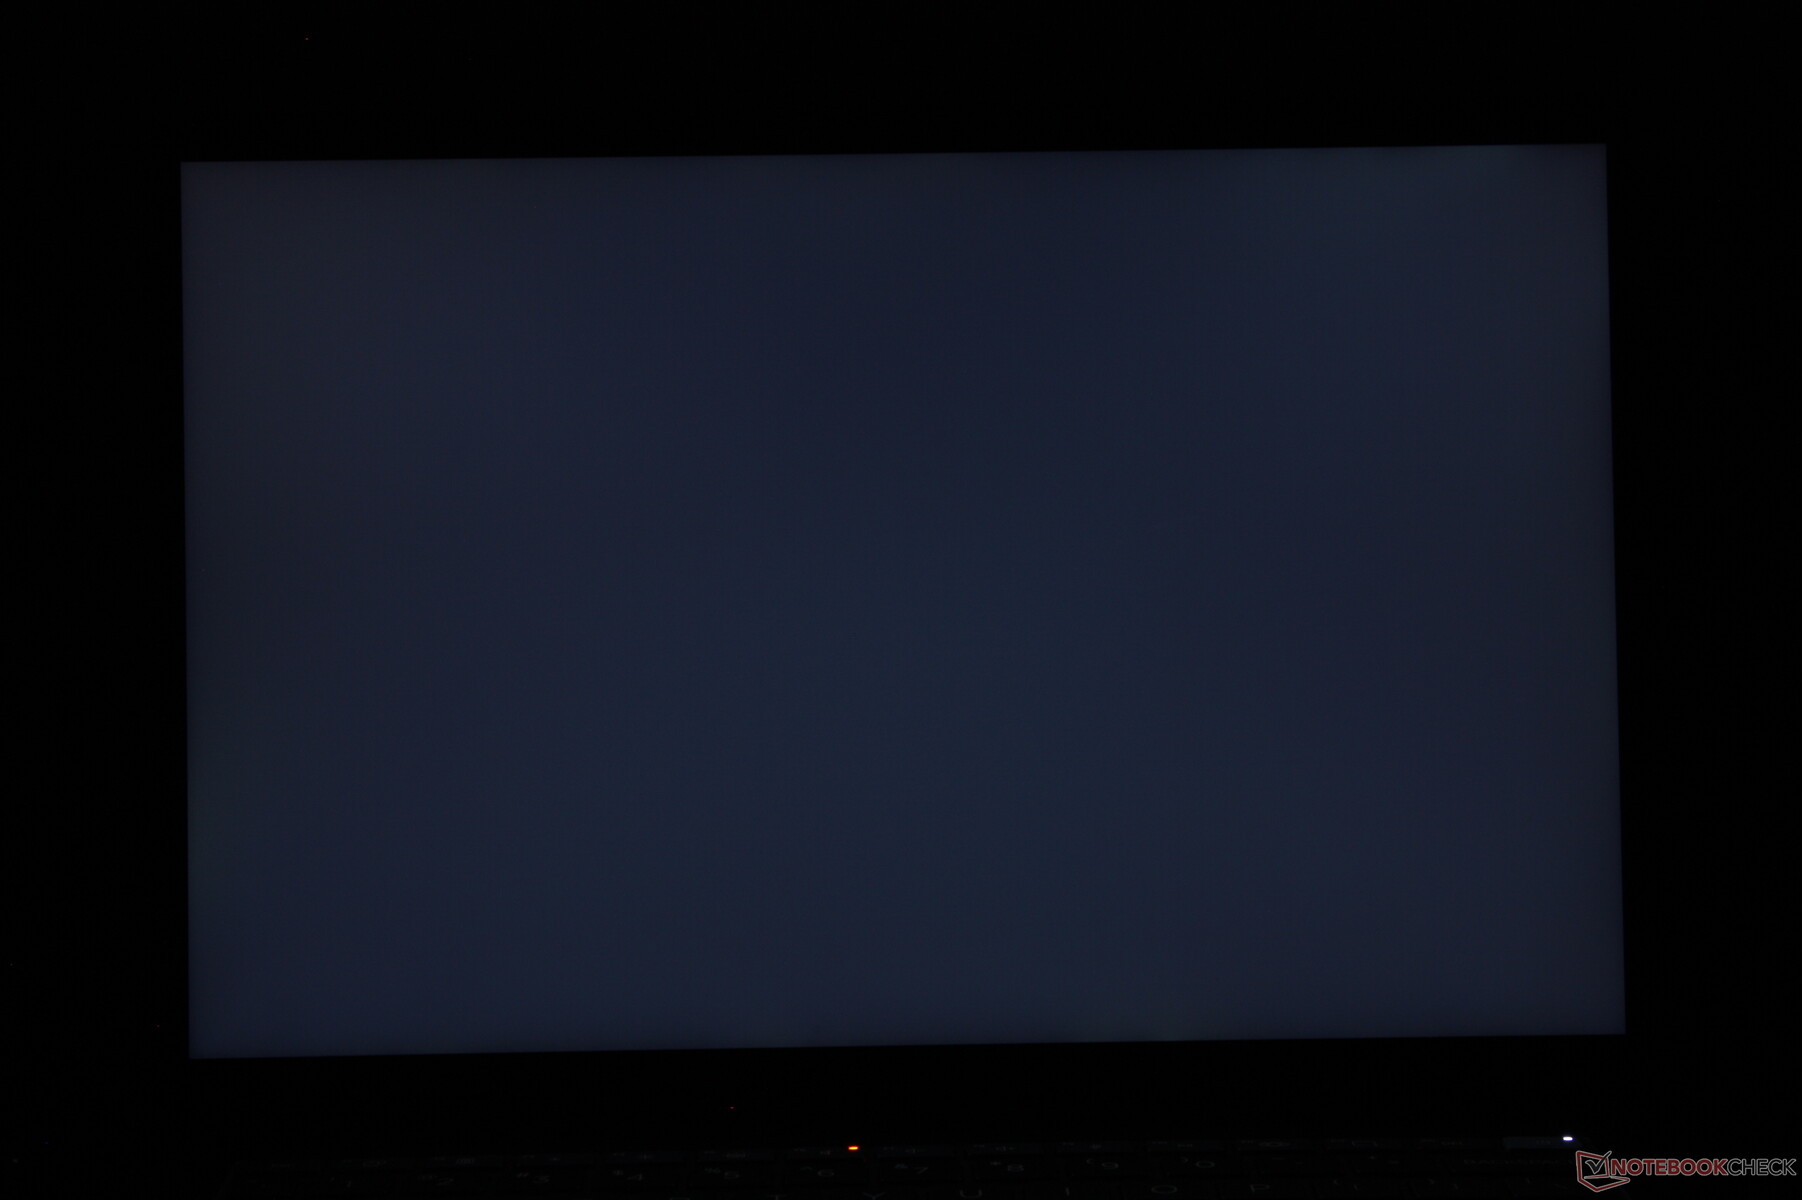
Brightness Distribution: 87 %
Center on Battery: 341.4 cd/m²
Contrast: 875:1 (Black: 0.39 cd/m²)
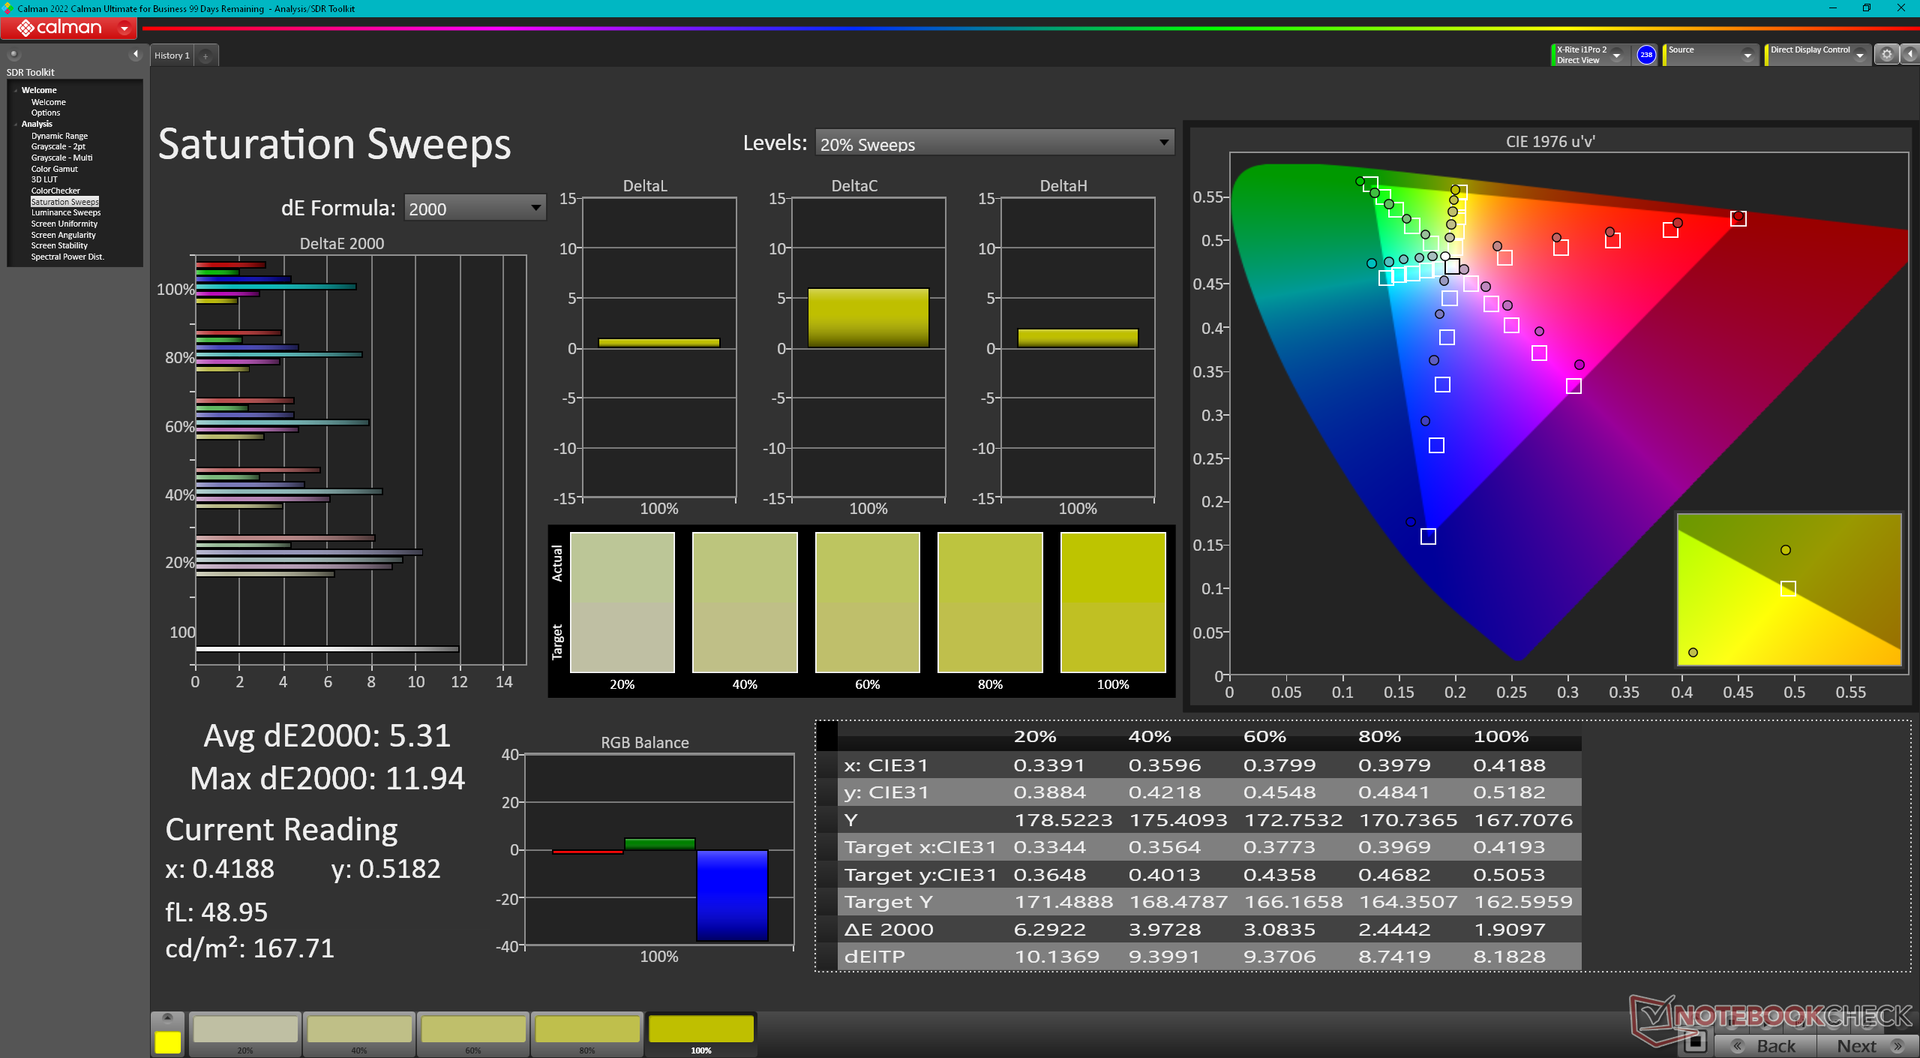
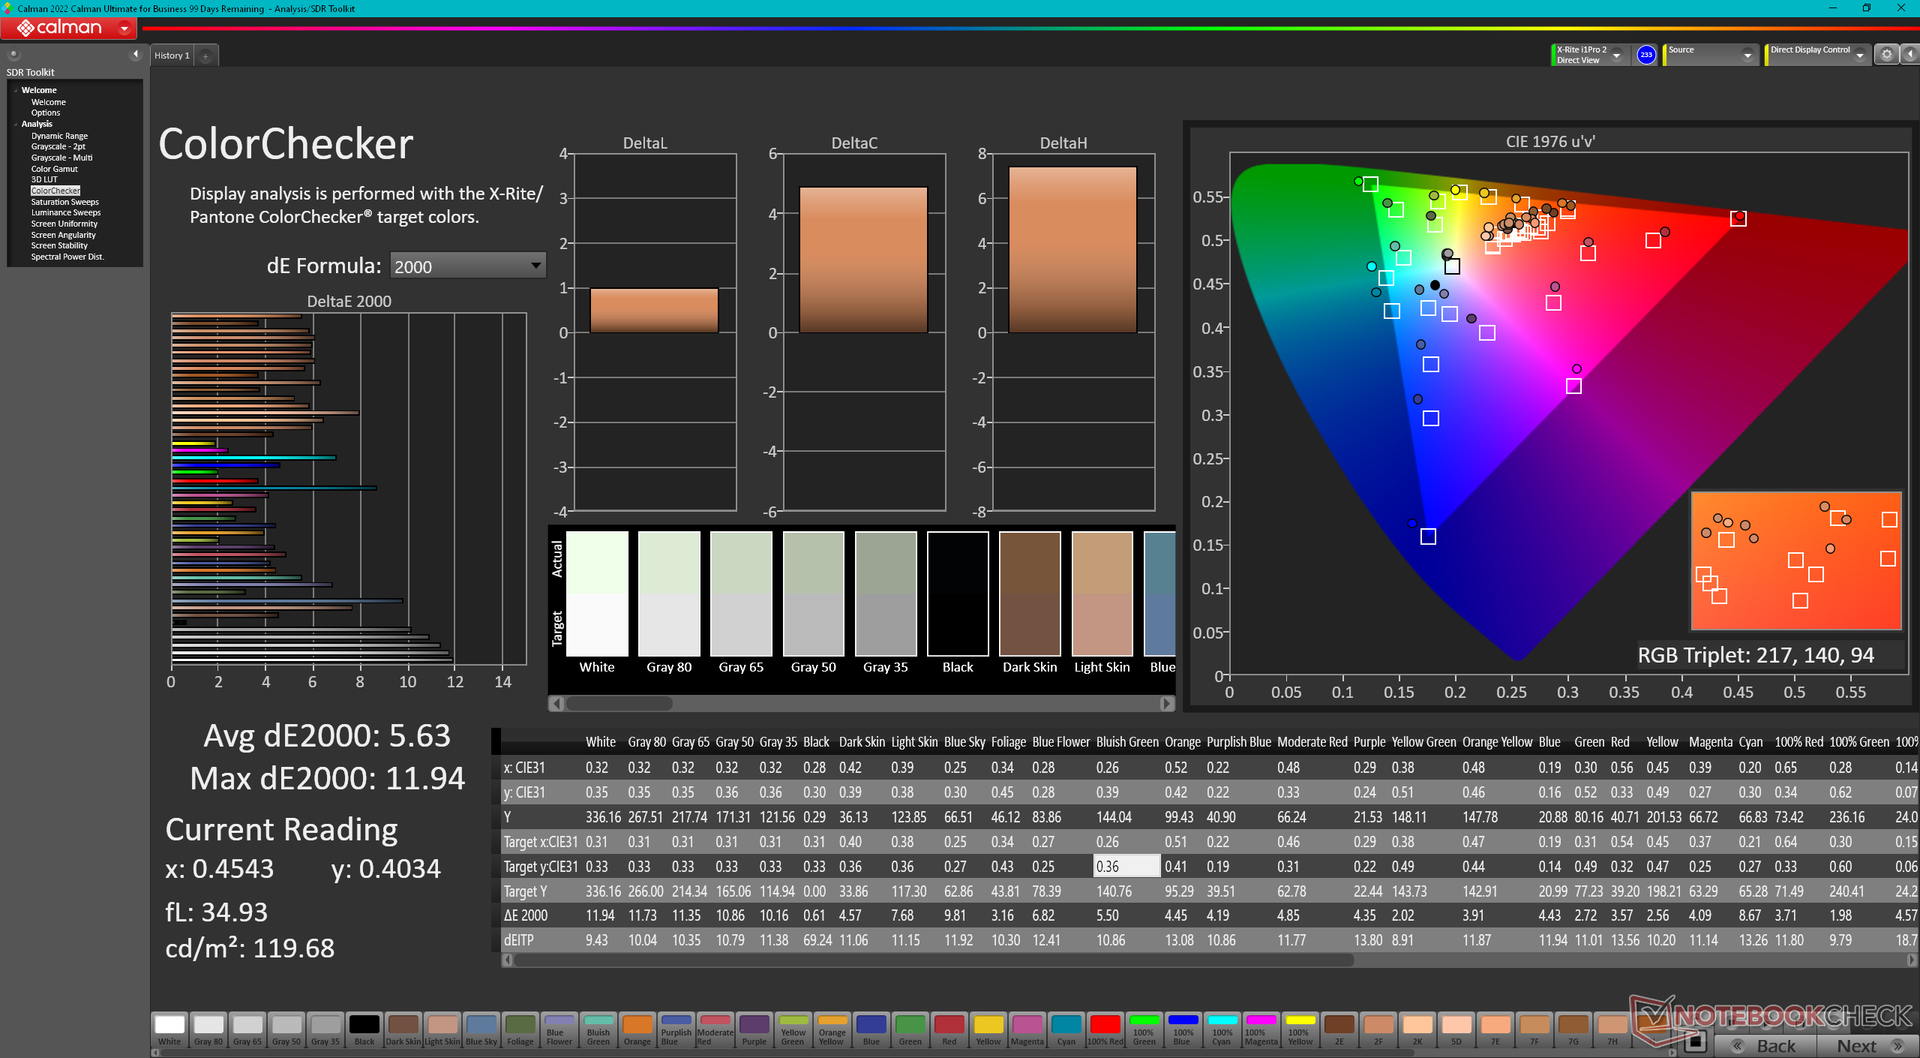
ΔE ColorChecker Calman: 5.63 | ∀{0.5-29.43 Ø4.73}
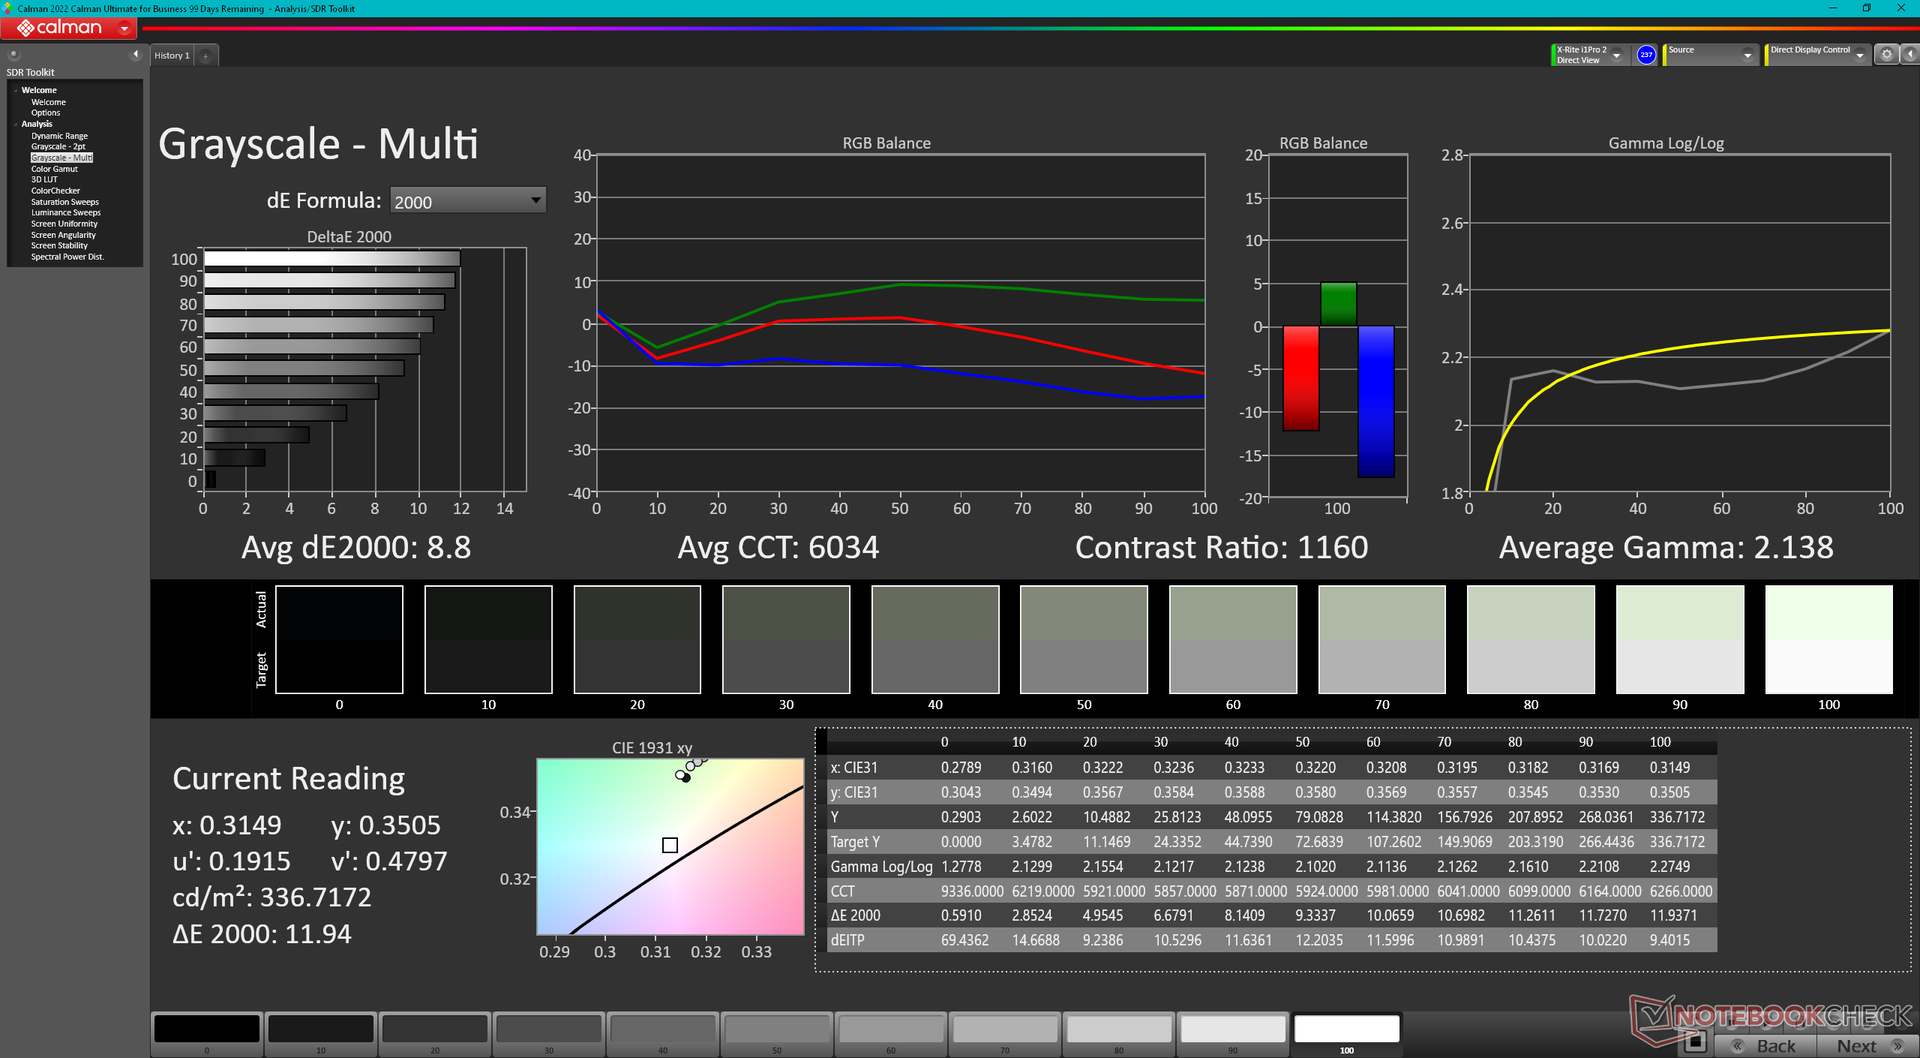
ΔE Greyscale Calman: 8.8 | ∀{0.09-98 Ø4.97}
Gamma: 2.14
CCT: 6034 K
| HP EliteBook Ultra G1q 14 IPS, 2240x1400, 14" | Asus Vivobook S 15 OLED Snapdragon ATNA56AC03-0, OLED, 2880x1620, 15.6" | HP Dragonfly Pro 2023 AU Optronics AUOA49A, IPS, 1920x1200, 14" | Dell Latitude 9450 2-in-1 AU Optronics B140QAN, IPS, 2560x1600, 14" | Lenovo ThinkPad X1 Carbon G12 Samsung ATNA40YK20-0, OLED, 2880x1800, 14" | Apple MacBook Pro 14 2023 M3 Max Mini-LED, 3024x1964, 14.2" | |
|---|---|---|---|---|---|---|
| Display | ||||||
| Display P3 Coverage (%) | 76.6 | 80.6 | 99.7 | 99.2 | ||
| sRGB Coverage (%) | 100 | 100 | 100 | |||
| AdobeRGB 1998 Coverage (%) | 77.4 | 80.1 | 98.2 | |||
| Response Times | 97% | -145% | -130% | 96% | -297% | |
| Response Time Grey 50% / Grey 80% * (ms) | 22.8 ? | 0.61 ? 97% | 65.6 ? -188% | 59.6 ? -161% | 0.91 ? 96% | 80.8 ? -254% |
| Response Time Black / White * (ms) | 17.9 ? | 0.67 ? 96% | 36 ? -101% | 35.6 ? -99% | 0.76 ? 96% | 78.8 ? -340% |
| PWM Frequency (Hz) | 240 ? | 240.3 | 14878 ? | |||
| Screen | 306% | 45% | 48% | 50% | 68% | |
| Brightness middle (cd/m²) | 341.4 | 378 11% | 425.9 25% | 501.4 47% | 417 22% | 610 79% |
| Brightness (cd/m²) | 315 | 379 20% | 405 29% | 491 56% | 417 32% | 600 90% |
| Brightness Distribution (%) | 87 | 98 13% | 87 0% | 88 1% | 98 13% | 96 10% |
| Black Level * (cd/m²) | 0.39 | 0.02 95% | 0.26 33% | 0.32 18% | ||
| Contrast (:1) | 875 | 18900 2060% | 1638 87% | 1567 79% | ||
| Colorchecker dE 2000 * | 5.63 | 1 82% | 2.81 50% | 2.52 55% | 1.26 78% | 1.7 70% |
| Colorchecker dE 2000 max. * | 11.94 | 2.6 78% | 4.91 59% | 4.87 59% | 3.6 70% | 2.3 81% |
| Greyscale dE 2000 * | 8.8 | 1.2 86% | 2.2 75% | 2.8 68% | 1.3 85% | 2.1 76% |
| Gamma | 2.14 103% | 2.19 100% | 2.04 108% | 2.17 101% | 2.27 97% | 2.22 99% |
| CCT | 6034 108% | 6460 101% | 6688 97% | 6270 104% | 6355 102% | 6874 95% |
| Colorchecker dE 2000 calibrated * | 0.49 | 0.45 | 0.68 | |||
| Total Average (Program / Settings) | 202% /
264% | -50% /
7% | -41% /
12% | 73% /
62% | -115% /
-24% |
* ... smaller is better
Average grayscale and color deltaE values could be better at 8.8 and 5.63 out of the box, respectively, to suggest that that the system is not pre-calibrated at factory. Color temperature in particular is a bit too warm at ~6000K. Calibration can also prove to be difficult as colorimeter software like i1Profiler may not function properly.
Display Response Times
| ↔ Response Time Black to White | ||
|---|---|---|
| 17.9 ms ... rise ↗ and fall ↘ combined | ↗ 10.3 ms rise | 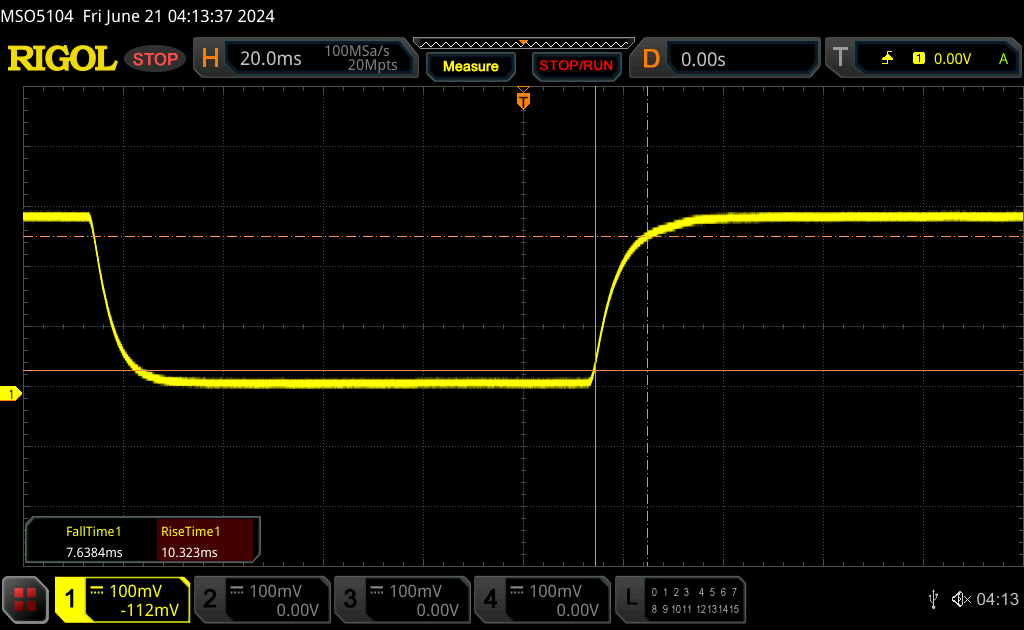 |
| ↘ 7.6 ms fall | ||
| The screen shows good response rates in our tests, but may be too slow for competitive gamers. In comparison, all tested devices range from 0.1 (minimum) to 240 (maximum) ms. » 40 % of all devices are better. This means that the measured response time is better than the average of all tested devices (19.9 ms). | ||
| ↔ Response Time 50% Grey to 80% Grey | ||
| 22.8 ms ... rise ↗ and fall ↘ combined | ↗ 9.3 ms rise | 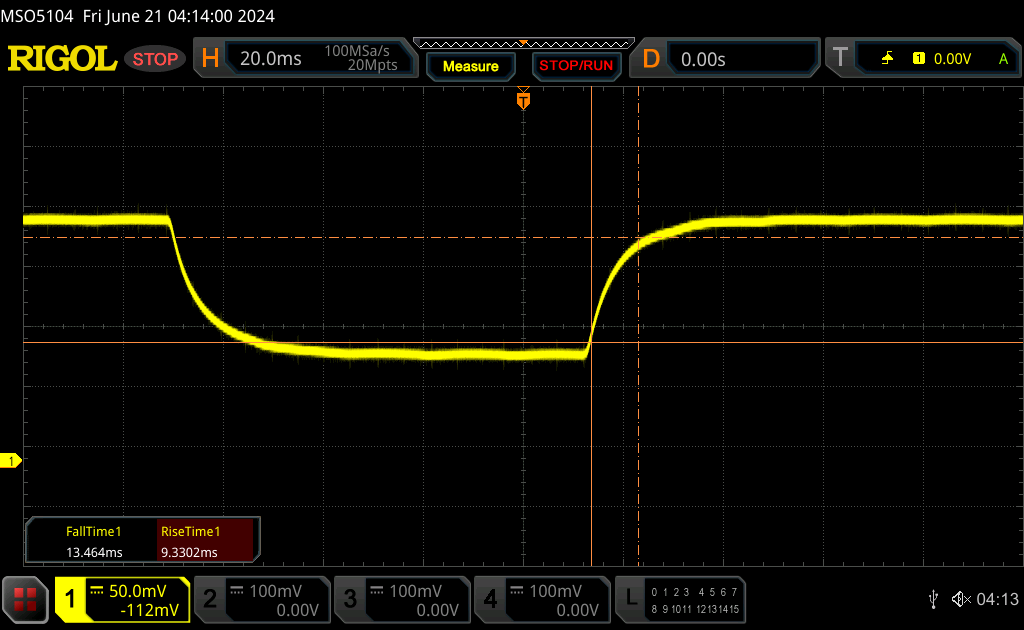 |
| ↘ 13.5 ms fall | ||
| The screen shows good response rates in our tests, but may be too slow for competitive gamers. In comparison, all tested devices range from 0.165 (minimum) to 636 (maximum) ms. » 34 % of all devices are better. This means that the measured response time is better than the average of all tested devices (31.1 ms). | ||
Screen Flickering / PWM (Pulse-Width Modulation)
| Screen flickering / PWM not detected | 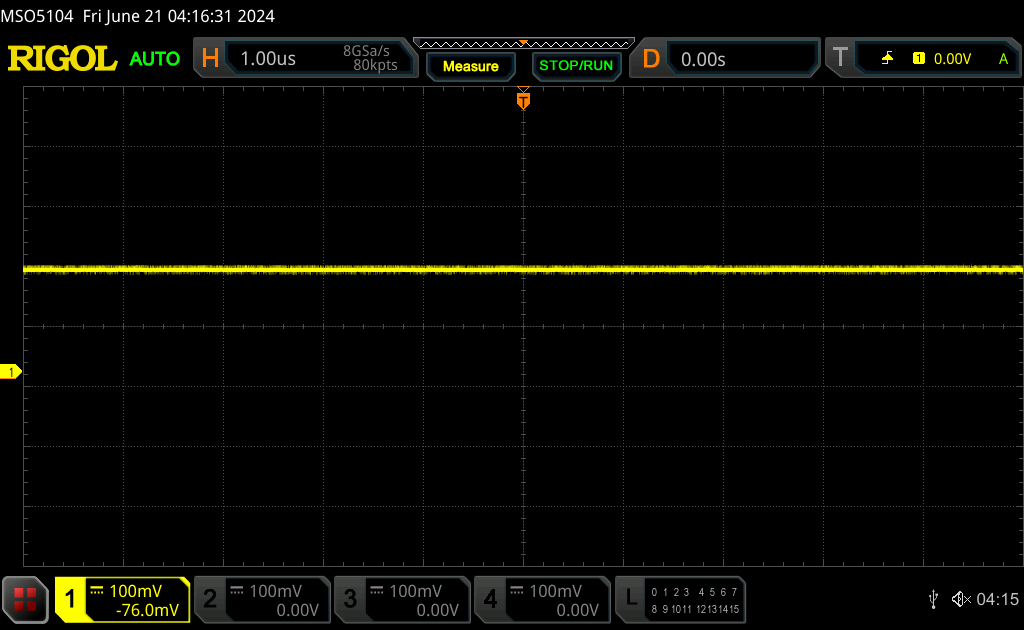 | ||
In comparison: 52 % of all tested devices do not use PWM to dim the display. If PWM was detected, an average of 7810 (minimum: 5 - maximum: 343500) Hz was measured. | |||
The maximum brightness of 350 to 400 nits is dimmer than the Macbook Pro 14 or EliteBook 830 where brightness levels can reach 600 nits or 1000 nits, respectively. While ~350 nits is great for indoor environments, outdoor lighting conditions will overwhelm the EliteBook Ultra screen.
Performance — Good Out Of The Gate, But Not Good Enough
Testing Conditions
We set Windows to Performance mode prior to running the benchmarks below. Many of the benchmarks must be emulated in order to run including 3DMark which can make direct comparisons to Intel or AMD chips more difficult. Few benchmarks are run natively such as CineBench R24, GeekBench 6, and PCMark 10 Applications which put the HP more in line with Core i7 Meteor Lake-U CPUs. Otherwise, the system will often have reduced scores especially in single-threaded applications when the benchmarks are emulated.
Processor
(July 3, 2024 update: Section has been updated to better distinguish between emulated and natively run benchmarks.)
Raw multi-core performance is neck-to-neck with the competing Core Ultra 7 165U and Ryzen 7 7840U or 8840U at best when benchmarks run natively on ARM. Otherwise, performance can be up to 20 percent slower when benchmarks must be emulated. Emulated results become even worse for single-core operations where our Snapdragon X Elite X1E-78-100 can be up to 35 to 40 percent slower than the aforementioned Intel and AMD alternatives. Similar results can be found when comparing the Qualcomm chip to the Apple M2 series or newer.
Performance drops over time when stressed as high clock rates are unsustainable for long periods. While this isn't uncommon, the dip in performance is steeper when compared to many Core-U or Ryzen-U alternatives. When running CineBench R15 xT in a loop, for example, the initial score of 2175 points would drop by 27 percent after six loops compared to just 12 percent on last year's AMD-powered Dragonfly Pro. We suspect this is due to the smaller cooling solution of the EliteBook Ultra G1q design as the larger Vivobook S 15 OLED with the same Qualcomm CPU can sustain higher scores under similar testing conditions.
Cinebench R15 Multi Loop
Cinebench 2024: CPU Multi Core | CPU Single Core
Cinebench R23: Multi Core | Single Core
Cinebench R20: CPU (Multi Core) | CPU (Single Core)
Cinebench R15: CPU Multi 64Bit | CPU Single 64Bit
Blender: v2.79 BMW27 CPU
7-Zip 18.03: 7z b 4 | 7z b 4 -mmt1
Geekbench 6.6: Multi-Core | Single-Core
Geekbench 5.5: Multi-Core | Single-Core
HWBOT x265 Benchmark v2.2: 4k Preset
LibreOffice : 20 Documents To PDF
R Benchmark 2.5: Overall mean
| CPU Performance rating | |
| Apple MacBook Pro 14 2023 M3 Max -5! | |
| Asus ZenBook 14X UX3404VC -4! | |
| Lenovo Yoga Pro 7 14APH G8 | |
| MSI Stealth 14 Studio A13V -4! | |
| Apple MacBook Pro 14 2023 M3 Pro -5! | |
| Huawei MateBook X Pro 2024 | |
| Apple MacBook Pro 14 2023 M2 Pro -10! | |
| Dell Inspiron 14 7445 2-in-1 -2! | |
| Asus Zenbook 14 OLED UM3406HA | |
| Lenovo ThinkPad X1 Carbon G12 -1! | |
| Lenovo ThinkPad T14 G3-21AJS00400 -4! | |
| HP Dragonfly Pro 2023 -6! | |
| Dell Latitude 9450 2-in-1 -2! | |
| Apple MacBook Pro 14 2021 M1 Max 24-Core GPU -9! | |
| Asus Vivobook S 15 OLED Snapdragon | |
| Acer TravelMate P4 TMP414-53-58XQ -2! | |
| Average Qualcomm Snapdragon X Elite X1E-78-100 | |
| HP EliteBook Ultra G1q 14 | |
| HP EliteBook 1040 G10 818N7EA -2! | |
| Cinebench 2024 / CPU Multi Core | |
| Apple MacBook Pro 14 2023 M3 Max | |
| Asus Vivobook S 15 OLED Snapdragon | |
| Apple MacBook Pro 14 2023 M3 Pro | |
| Average Qualcomm Snapdragon X Elite X1E-78-100 (746 - 1132, n=9) | |
| Lenovo Yoga Pro 7 14APH G8 | |
| Huawei MateBook X Pro 2024 | |
| HP EliteBook Ultra G1q 14 | |
| Lenovo ThinkPad X1 Carbon G12 | |
| Asus Zenbook 14 OLED UM3406HA | |
| Cinebench 2024 / CPU Single Core | |
| Apple MacBook Pro 14 2023 M3 Pro | |
| Apple MacBook Pro 14 2023 M3 Max | |
| Huawei MateBook X Pro 2024 | |
| Asus Vivobook S 15 OLED Snapdragon | |
| Average Qualcomm Snapdragon X Elite X1E-78-100 (102.8 - 108, n=6) | |
| HP EliteBook Ultra G1q 14 | |
| Lenovo Yoga Pro 7 14APH G8 | |
| Asus Zenbook 14 OLED UM3406HA | |
Cinebench 2024: CPU Multi Core | CPU Single Core
Cinebench R23: Multi Core | Single Core
Cinebench R20: CPU (Multi Core) | CPU (Single Core)
Cinebench R15: CPU Multi 64Bit | CPU Single 64Bit
Blender: v2.79 BMW27 CPU
7-Zip 18.03: 7z b 4 | 7z b 4 -mmt1
Geekbench 6.6: Multi-Core | Single-Core
Geekbench 5.5: Multi-Core | Single-Core
HWBOT x265 Benchmark v2.2: 4k Preset
LibreOffice : 20 Documents To PDF
R Benchmark 2.5: Overall mean
* ... smaller is better
AIDA64: FP32 Ray-Trace | FPU Julia | CPU SHA3 | CPU Queen | FPU SinJulia | FPU Mandel | CPU AES | CPU ZLib | FP64 Ray-Trace | CPU PhotoWorxx
| Performance rating | |
| Lenovo ThinkPad X1 Carbon G12 | |
| Dell Latitude 9450 2-in-1 | |
| Asus Vivobook S 15 OLED Snapdragon | |
| Average Qualcomm Snapdragon X Elite X1E-78-100 | |
| HP EliteBook Ultra G1q 14 | |
| AIDA64 / FP32 Ray-Trace | |
| Dell Latitude 9450 2-in-1 | |
| Lenovo ThinkPad X1 Carbon G12 | |
| HP EliteBook Ultra G1q 14 | |
| Asus Vivobook S 15 OLED Snapdragon | |
| Average Qualcomm Snapdragon X Elite X1E-78-100 (6943 - 8203, n=6) | |
| AIDA64 / FPU Julia | |
| Dell Latitude 9450 2-in-1 | |
| Lenovo ThinkPad X1 Carbon G12 | |
| HP EliteBook Ultra G1q 14 | |
| Average Qualcomm Snapdragon X Elite X1E-78-100 (20304 - 27958, n=6) | |
| Asus Vivobook S 15 OLED Snapdragon | |
| AIDA64 / CPU SHA3 | |
| Asus Vivobook S 15 OLED Snapdragon | |
| Average Qualcomm Snapdragon X Elite X1E-78-100 (3036 - 3319, n=6) | |
| HP EliteBook Ultra G1q 14 | |
| Dell Latitude 9450 2-in-1 | |
| Lenovo ThinkPad X1 Carbon G12 | |
| AIDA64 / CPU Queen | |
| Lenovo ThinkPad X1 Carbon G12 | |
| Average Qualcomm Snapdragon X Elite X1E-78-100 (67909 - 68494, n=6) | |
| Asus Vivobook S 15 OLED Snapdragon | |
| HP EliteBook Ultra G1q 14 | |
| Dell Latitude 9450 2-in-1 | |
| AIDA64 / FPU SinJulia | |
| Lenovo ThinkPad X1 Carbon G12 | |
| Dell Latitude 9450 2-in-1 | |
| Asus Vivobook S 15 OLED Snapdragon | |
| Average Qualcomm Snapdragon X Elite X1E-78-100 (1321 - 2303, n=6) | |
| HP EliteBook Ultra G1q 14 | |
| AIDA64 / FPU Mandel | |
| Dell Latitude 9450 2-in-1 | |
| Lenovo ThinkPad X1 Carbon G12 | |
| Asus Vivobook S 15 OLED Snapdragon | |
| HP EliteBook Ultra G1q 14 | |
| Average Qualcomm Snapdragon X Elite X1E-78-100 (11546 - 14598, n=6) | |
| AIDA64 / CPU AES | |
| HP EliteBook Ultra G1q 14 | |
| Lenovo ThinkPad X1 Carbon G12 | |
| Average Qualcomm Snapdragon X Elite X1E-78-100 (53201 - 66840, n=6) | |
| Asus Vivobook S 15 OLED Snapdragon | |
| Dell Latitude 9450 2-in-1 | |
| AIDA64 / CPU ZLib | |
| Lenovo ThinkPad X1 Carbon G12 | |
| HP EliteBook Ultra G1q 14 | |
| Average Qualcomm Snapdragon X Elite X1E-78-100 (658 - 794, n=6) | |
| Dell Latitude 9450 2-in-1 | |
| Asus Vivobook S 15 OLED Snapdragon | |
| AIDA64 / FP64 Ray-Trace | |
| Dell Latitude 9450 2-in-1 | |
| Lenovo ThinkPad X1 Carbon G12 | |
| Asus Vivobook S 15 OLED Snapdragon | |
| Average Qualcomm Snapdragon X Elite X1E-78-100 (2955 - 4271, n=6) | |
| HP EliteBook Ultra G1q 14 | |
| AIDA64 / CPU PhotoWorxx | |
| Dell Latitude 9450 2-in-1 | |
| Lenovo ThinkPad X1 Carbon G12 | |
| Asus Vivobook S 15 OLED Snapdragon | |
| Average Qualcomm Snapdragon X Elite X1E-78-100 (27950 - 39220, n=6) | |
| HP EliteBook Ultra G1q 14 | |
System Performance
Naturally, several of our usual benchmark applications would not run in an ARM environment which is to be expected:
- Far Cry 5: Fails to launch
- X-Plane: Low settings only; Crashes on Medium and High settings
- Baldur's Gate 3: Fails to launch in DX12 mode
- HWiNFO64: ARM version coming soon
- i1Profiler: Fails to recognize colorimeter
- LatencyMon: No ARM version
- 3DMark06: SysInfo error; Can be circumvented
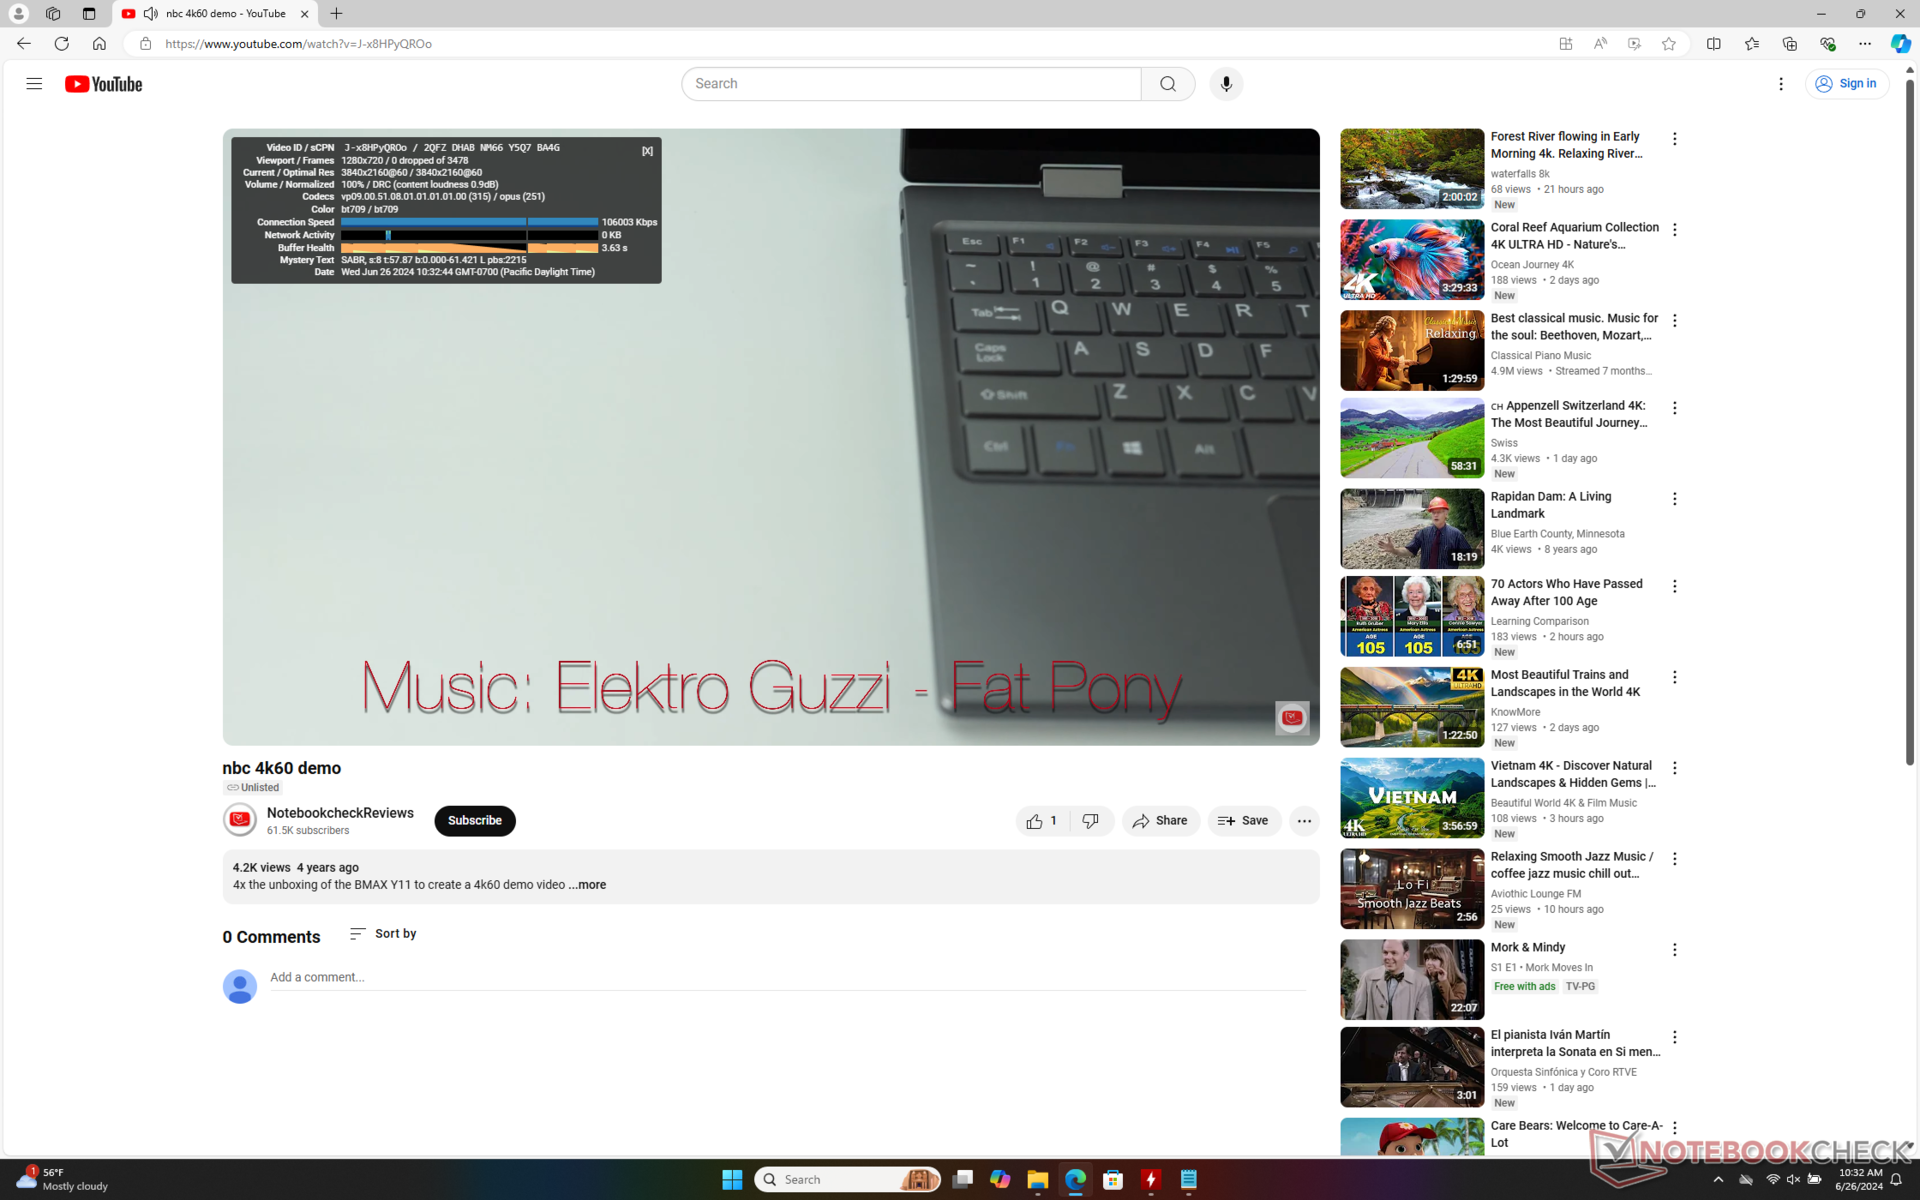
It's worth mentioning that the majority of the above applications are for benchmarking purposes which most buyers will not be running. Day-to-day productivity applications like browsers, video players, and Microsoft Office run without issues.
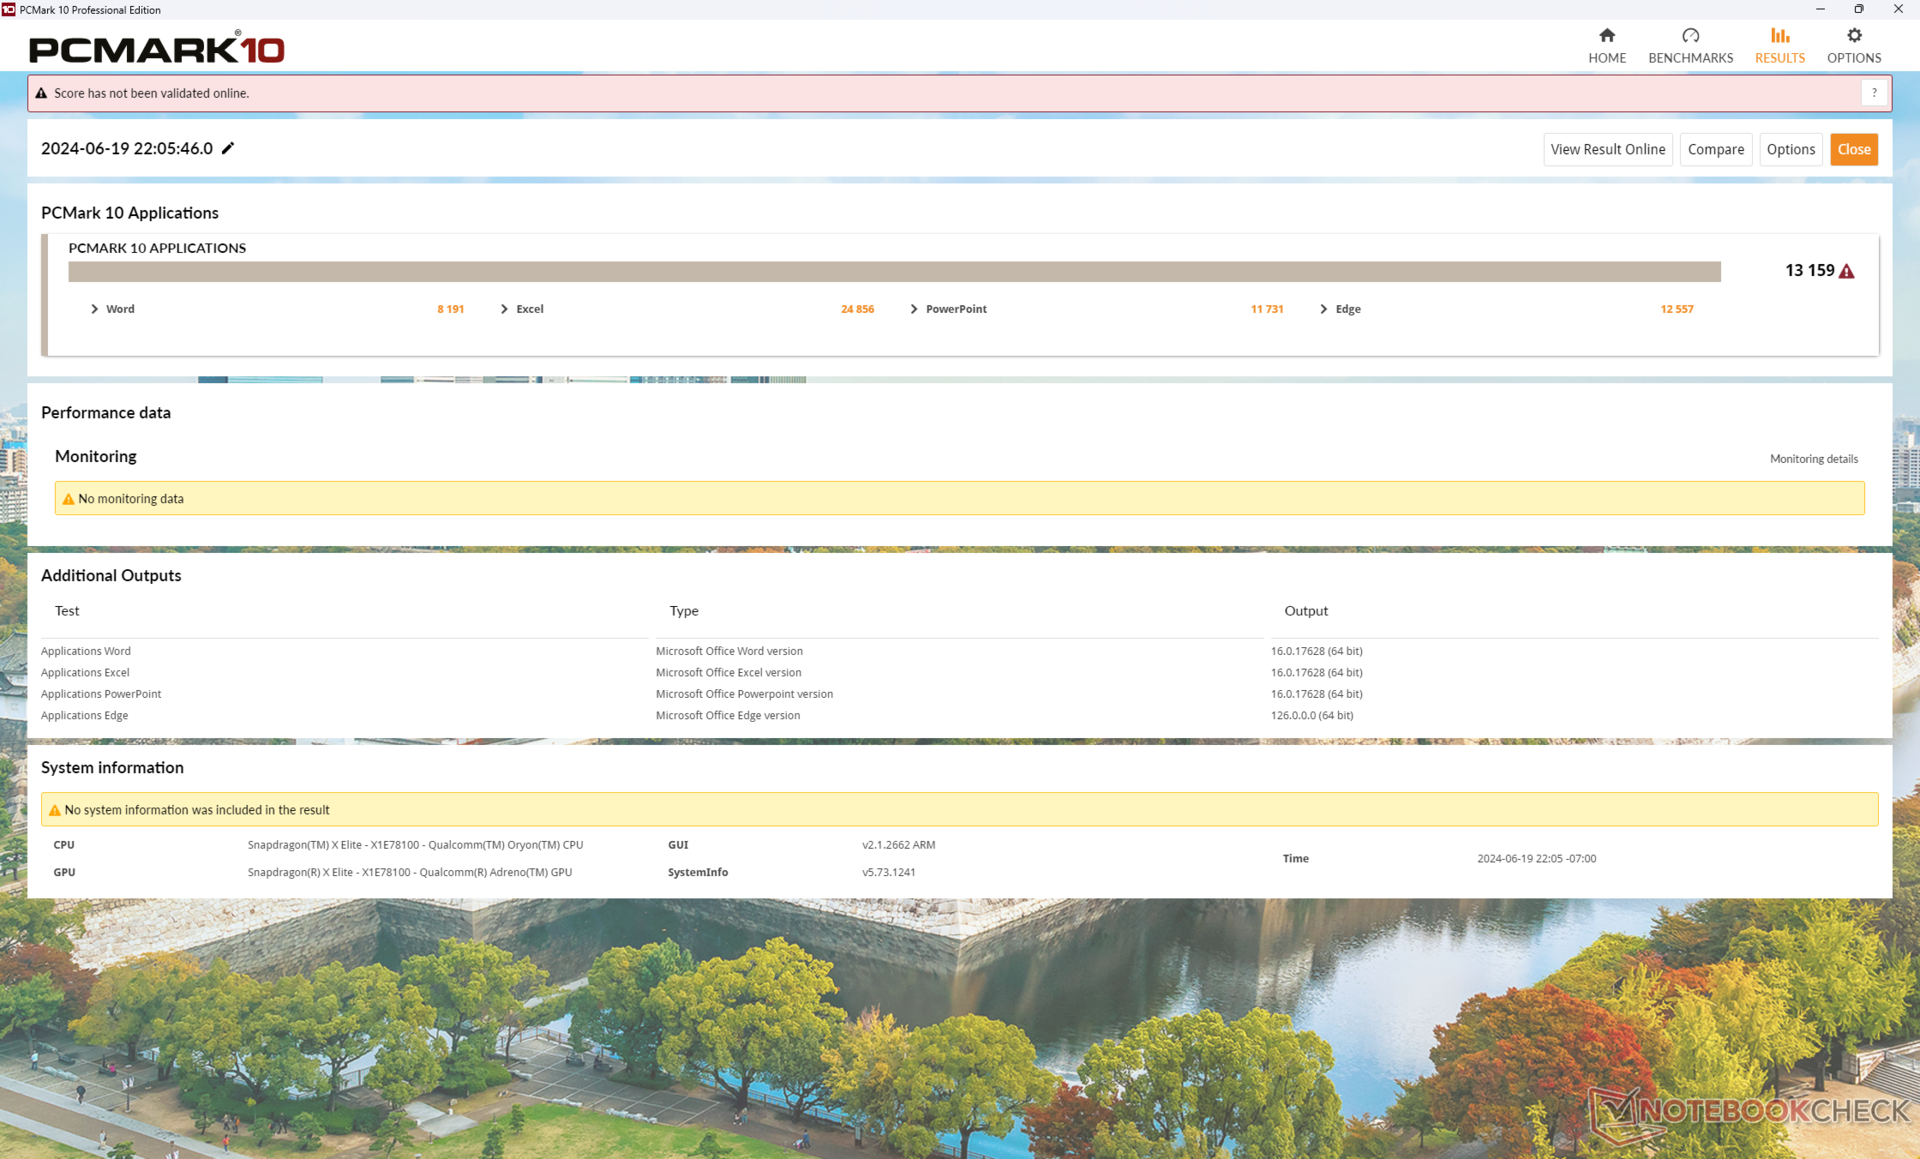
| Laptop Model | Word Score | Excel Score | PowerPoint Score | Edge Score | Combined Score |
| EliteBook Ultra G1q 14 (Snapdragon X Elite X1E-78-100) | 8191 | 24856 | 11731 | 12557 | 13159 |
| Latitude 7350 (Core Ultra 5 135U) | 5710 (-30%) | 18505 (-26%) | 10244 (-30%) | 12767 (-13%) | 10842 (-18%) |
PCMark 10 Standard is also incompatible with ARM and so we ran PCMark 10 Applications instead. Our scores in the table above would be higher than what we recorded on the Latitude 7350 equipped with the Core Ultra 5 135U to suggest that the Qualcomm machine is more comparable to the Core Ultra 7 series rather than a lower-end SKU when it comes to day-to-day applications.
Interestingly, WebXPRT and Kraken scores would be much lower on our HP than on our Asus system despite rerunning the tests. Updating Chrome to the latest version at the time of review addresses this concern. Performance differences between emulated and native or older and newer versions of applications can therefore have significant effects on Windows on ARM.
| Browser Version | WebXPRT 3 | WebXPRT 4 | Kraken 1.1 |
| Chrome 105.0.0.0 | 134 | 114 | 1065 ms |
| Chrome 126.0.6478.127 | 395 (+195%) | 286 (+151%) | 459.8 ms (-57%) |
WebXPRT 3: Overall
WebXPRT 4: Overall
Mozilla Kraken 1.1: Total
| WebXPRT 4 / Overall | |
| HP EliteBook Ultra G1q 14 | |
| Asus Vivobook S 15 OLED Snapdragon | |
| Average Qualcomm Snapdragon X Elite X1E-78-100, Qualcomm SD X Adreno X1-85 3.8 TFLOPS (271 - 297, n=6) | |
| Asus ZenBook 14X UX3404VC | |
| Huawei MateBook X Pro 2024 | |
| Lenovo ThinkPad X1 Carbon G12 | |
| Dell Inspiron 14 7445 2-in-1 | |
| Dell Latitude 9450 2-in-1 | |
| Apple MacBook Pro 14 2023 M2 Pro | |
| Lenovo Yoga Pro 7 14APH G8 | |
| Asus Zenbook 14 OLED UM3406HA | |
| Lenovo ThinkPad T14 G3-21AJS00400 | |
| MSI Stealth 14 Studio A13V | |
| HP EliteBook 1040 G10 818N7EA | |
| HP Dragonfly Pro 2023 | |
WebXPRT 3: Overall
WebXPRT 4: Overall
Mozilla Kraken 1.1: Total
* ... smaller is better
| AIDA64 / Memory Copy | |
| Dell Latitude 9450 2-in-1 | |
| Lenovo ThinkPad X1 Carbon G12 | |
| Asus Vivobook S 15 OLED Snapdragon | |
| Average Qualcomm Snapdragon X Elite X1E-78-100 (45988 - 66715, n=6) | |
| HP EliteBook Ultra G1q 14 | |
| AIDA64 / Memory Read | |
| Asus Vivobook S 15 OLED Snapdragon | |
| Average Qualcomm Snapdragon X Elite X1E-78-100 (60078 - 122210, n=6) | |
| Lenovo ThinkPad X1 Carbon G12 | |
| HP EliteBook Ultra G1q 14 | |
| Dell Latitude 9450 2-in-1 | |
| AIDA64 / Memory Write | |
| Lenovo ThinkPad X1 Carbon G12 | |
| Dell Latitude 9450 2-in-1 | |
| Asus Vivobook S 15 OLED Snapdragon | |
| Average Qualcomm Snapdragon X Elite X1E-78-100 (35073 - 49282, n=6) | |
| HP EliteBook Ultra G1q 14 | |
| AIDA64 / Memory Latency | |
| Dell Latitude 9450 2-in-1 | |
| Lenovo ThinkPad X1 Carbon G12 | |
| Asus Vivobook S 15 OLED Snapdragon | |
| Average Qualcomm Snapdragon X Elite X1E-78-100 (7.2 - 8.9, n=6) | |
| HP EliteBook Ultra G1q 14 | |
* ... smaller is better
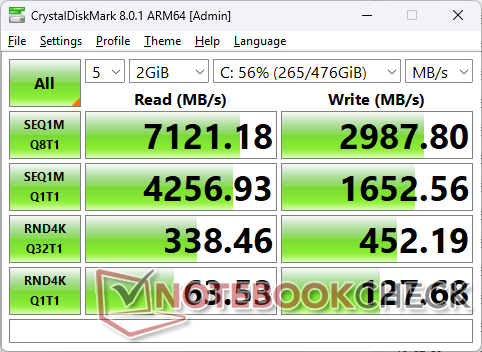
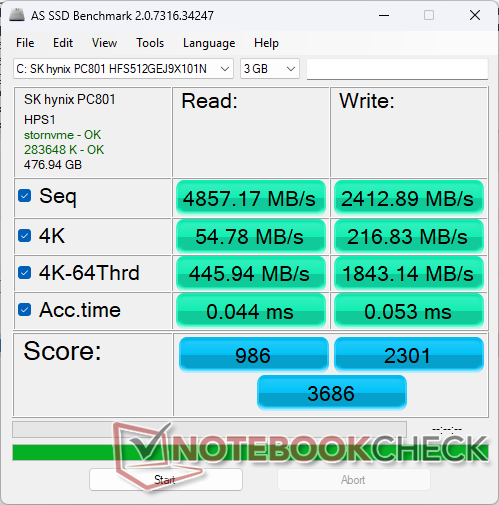
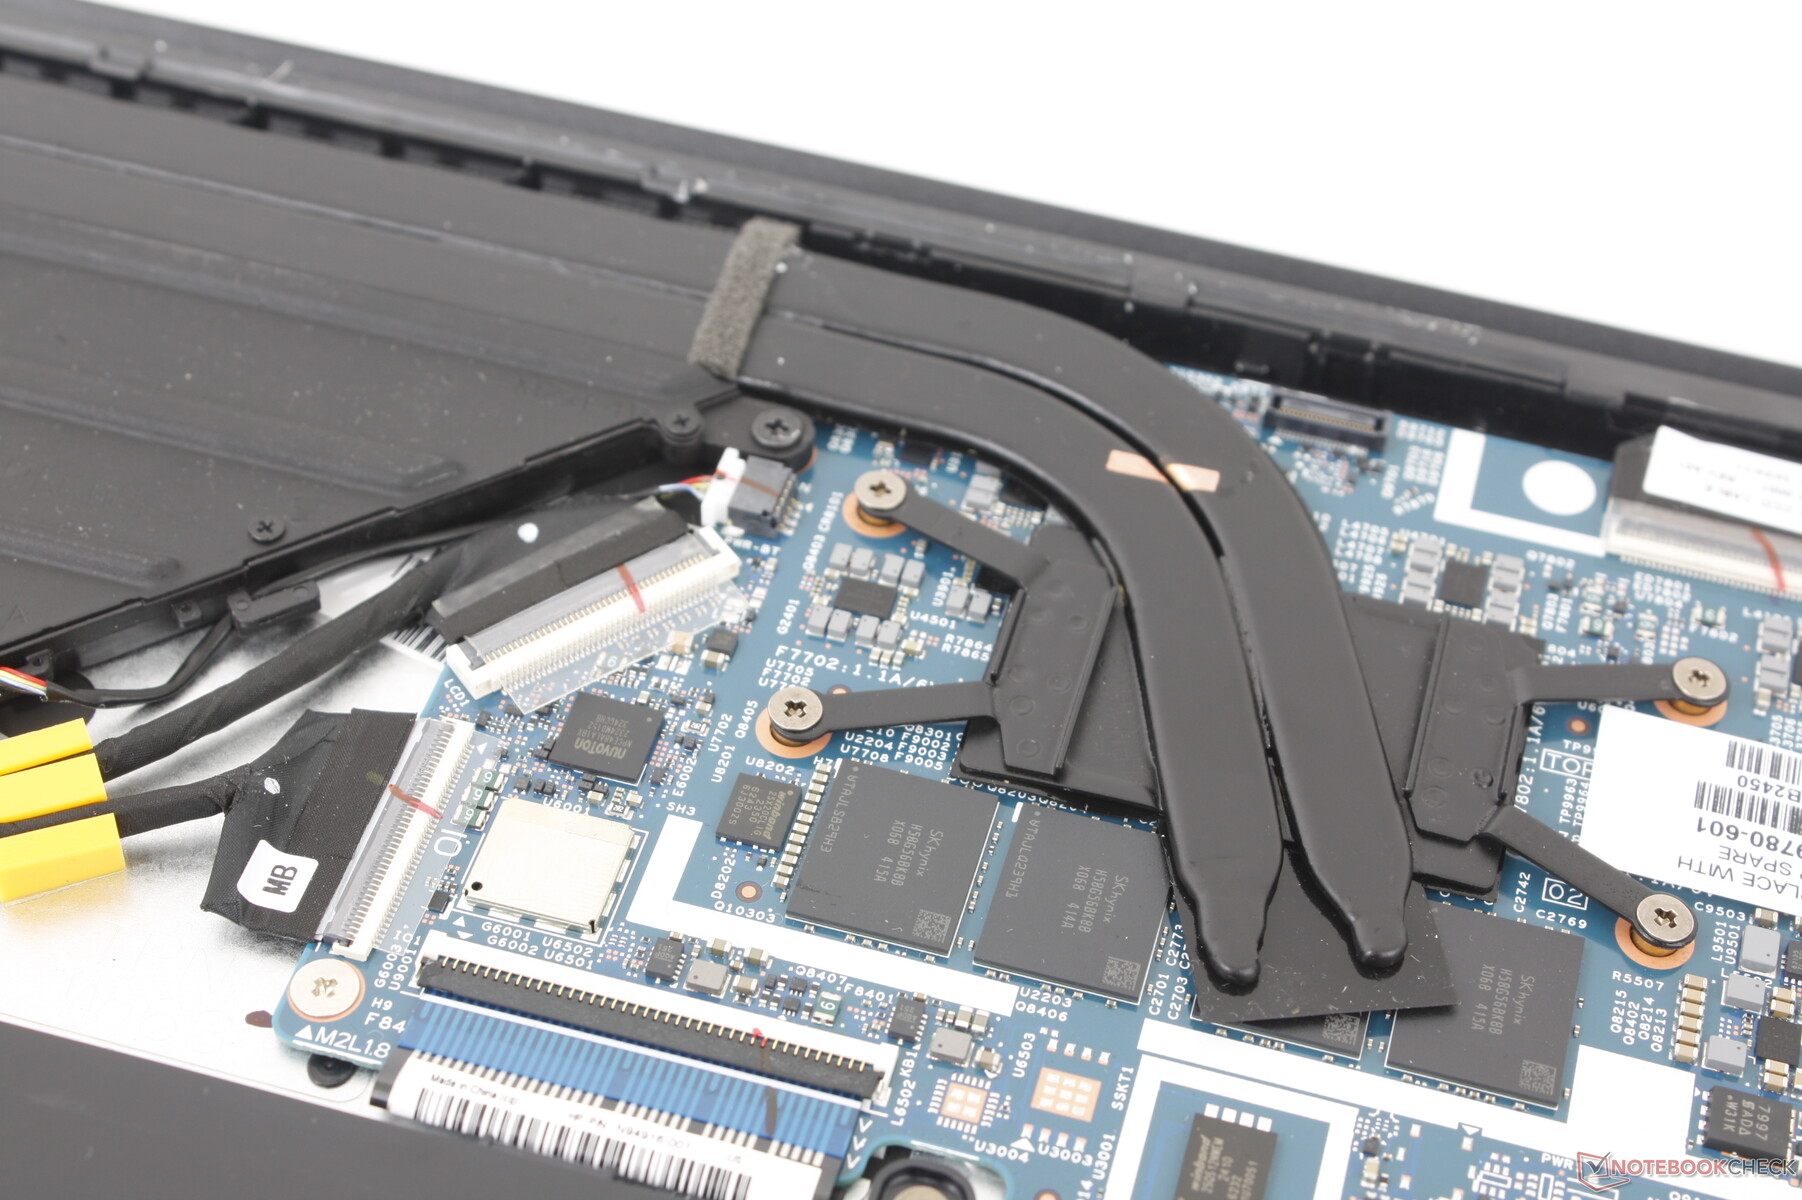
Storage Devices
Our unit comes with the SK hynix PC801 HFS512GEJ9X101N which is a common PCIe4 x4 drive found on other high-end models like the Lenovo Yoga 9 14IRP G8 or EliteBook 840 G9. Unfortunately, the one in our EliteBook Ultra G1q 14 tends to throttle as shown by our DiskSpd loop test results below. Transfer rates would be steady for the first few minutes before falling to 3500 MB/s.

| Drive Performance rating - Percent | |
| HP EliteBook Ultra G1q 14 | |
| Lenovo ThinkPad X1 Carbon G12 | |
| HP Dragonfly Pro 2023 | |
| Dell Latitude 9450 2-in-1 | |
| Asus Vivobook S 15 OLED Snapdragon | |
* ... smaller is better
Disk Throttling: DiskSpd Read Loop, Queue Depth 8
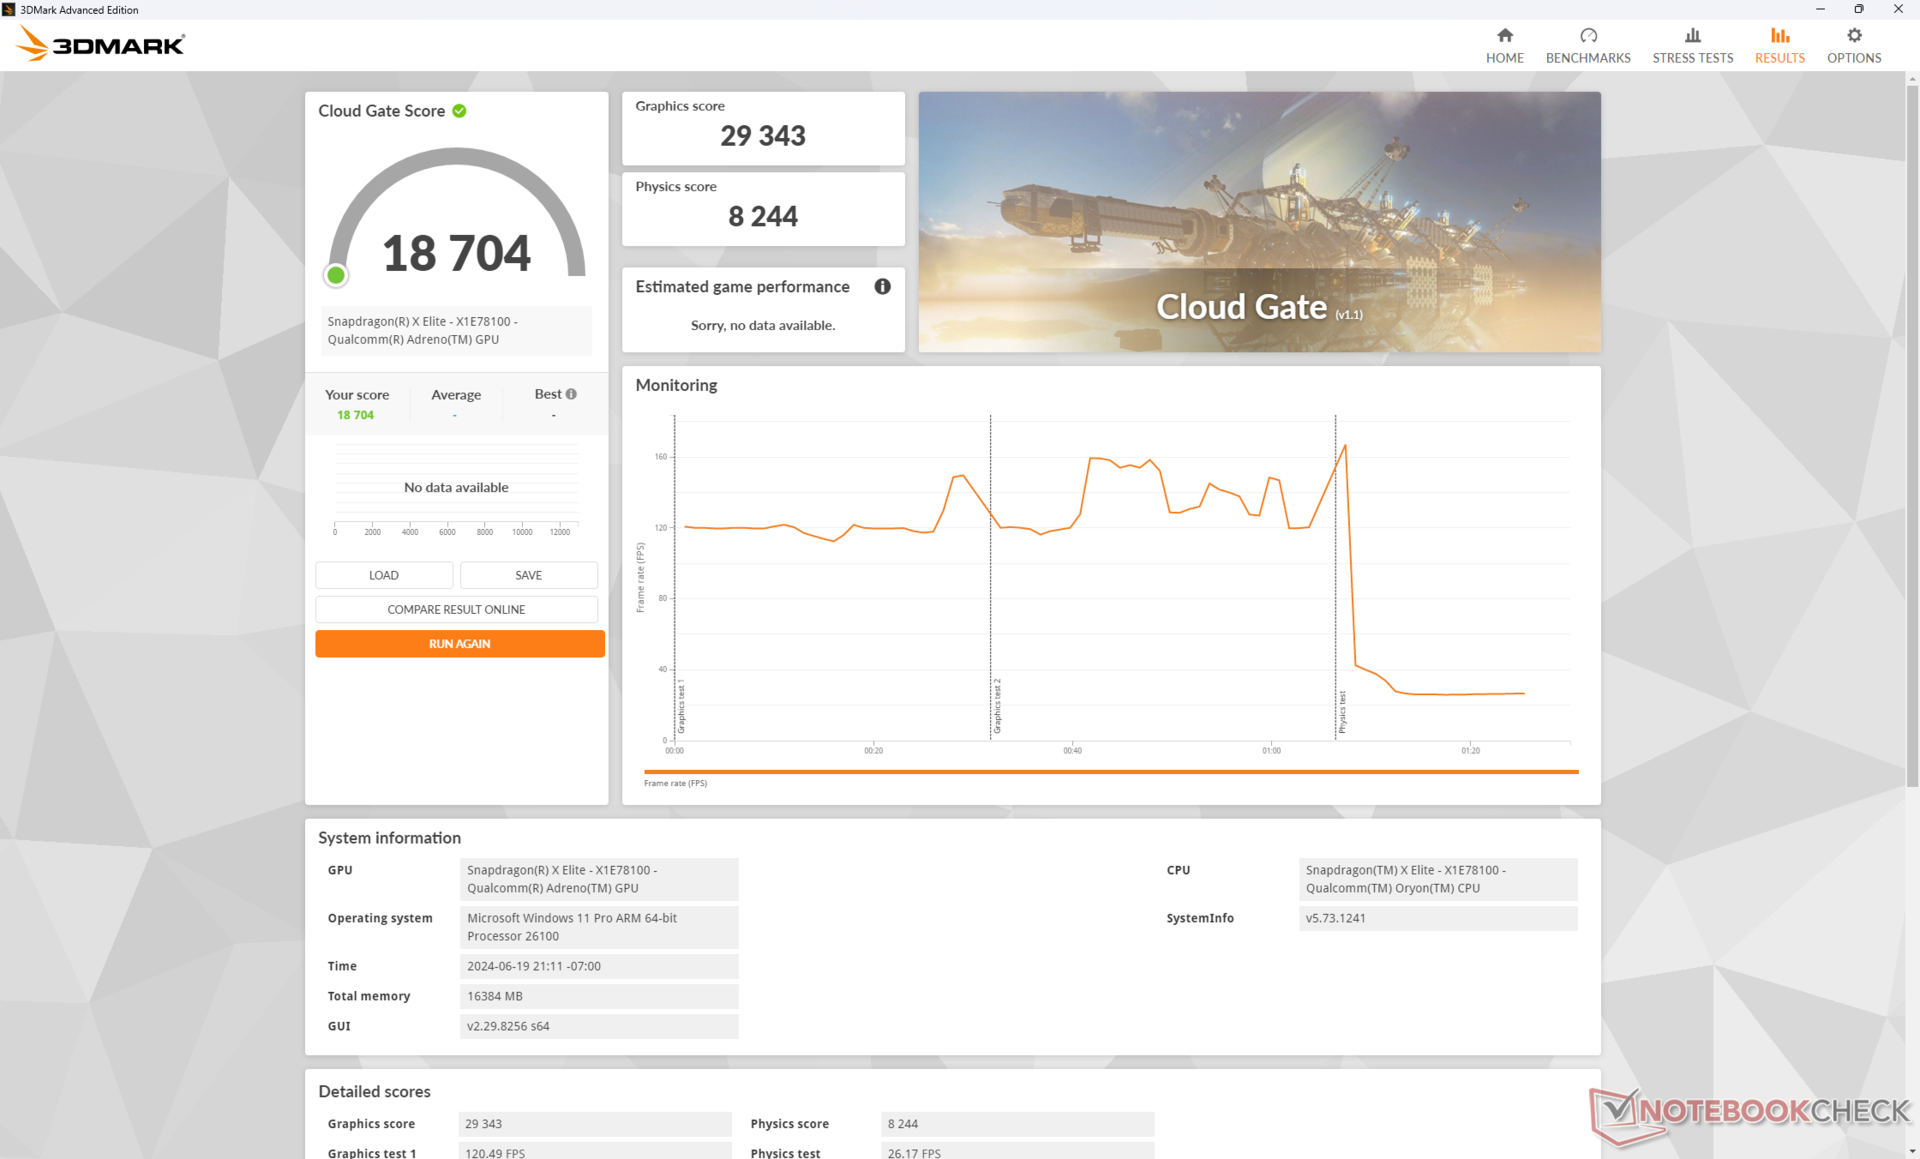
GPU Performance
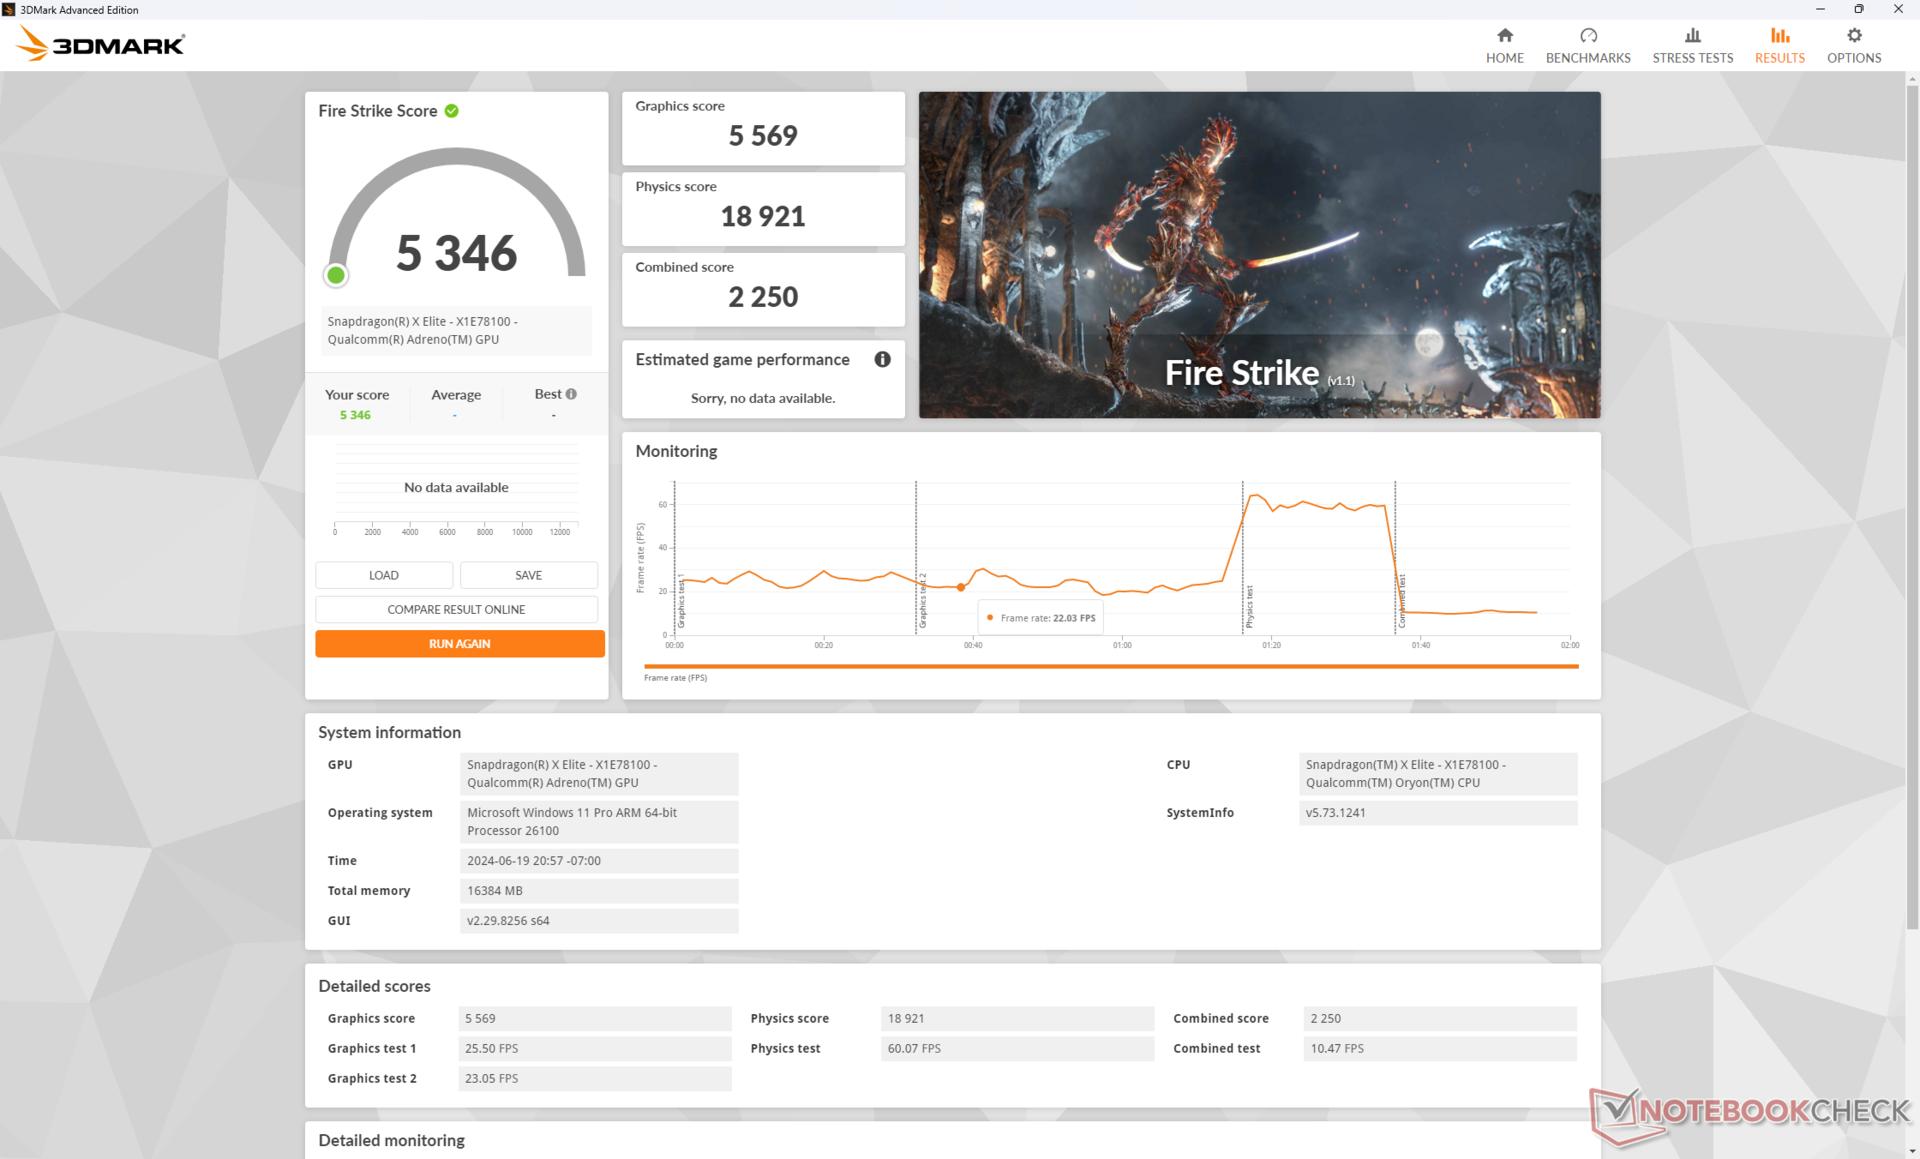
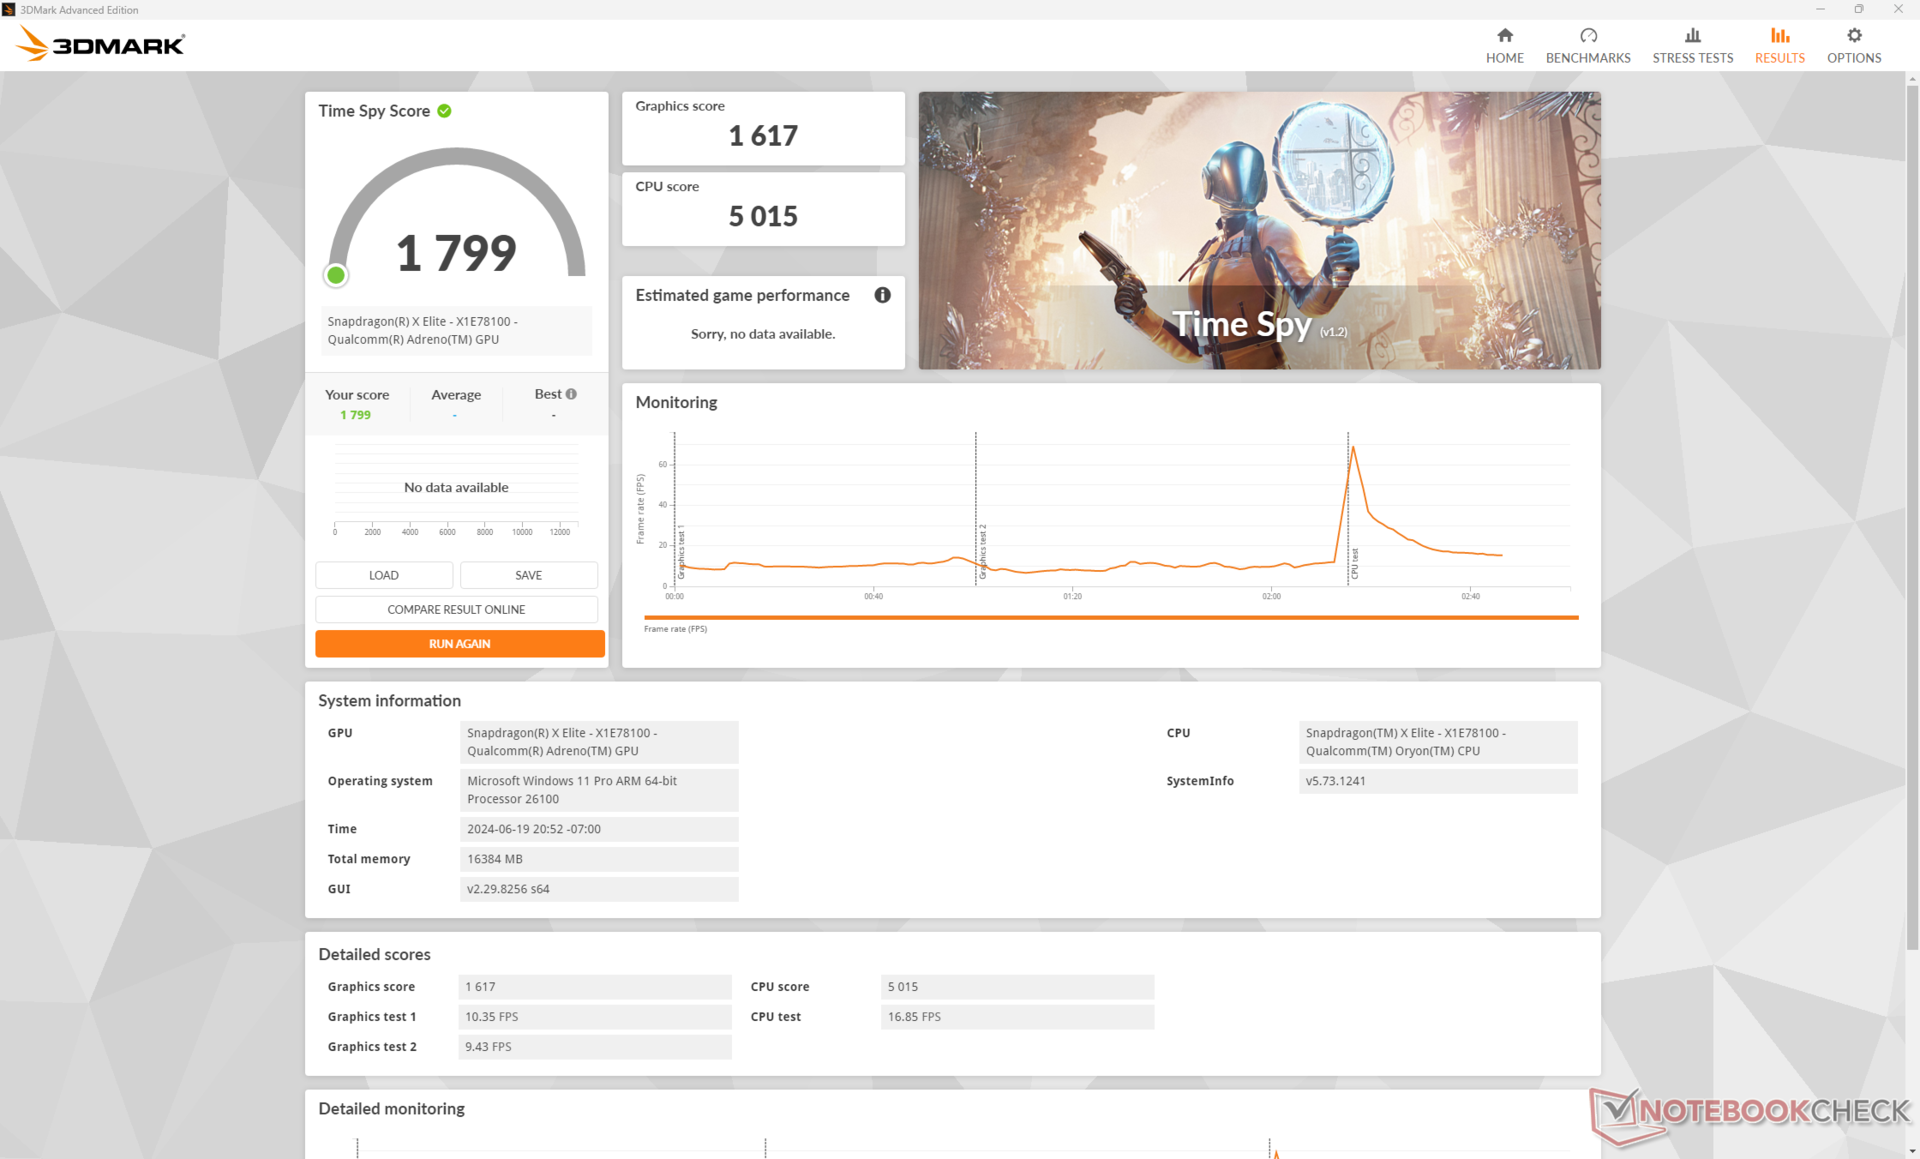
Emulated 3DMark results from our Snapdragon X Adreno are more comparable to the Arc 4 or older Iris Xe 96 EUs rather than the Arc 8 or Radeon 680M/780M series. This means that the latest integrated GPUs from Intel and AMD can be anywhere between 50 to 80 percent faster than the Qualcomm solution in terms of raw graphics horsepower.
| Power Profile | Physics Score | Graphics Score | Combined Score |
| Performance Mode | 18921 | 5569 | 2250 |
| Balanced Mode | 18781 (-1%) | 5574 (-0%) | 2301 (-0%) |
| Battery Power | 6013 (-68%) | 5573 (-0%) | 1885 (-16%) |
There appears to be no performance deficit when running on Balanced mode instead of Performance mode as shown by our Fire Strike results table above. However, running on battery power reduces processor performance significantly unlike on most Core-U or Ryzen-U-powered subnotebooks where smaller performance deficits are more common. The Lenovo ThinkBook 14 2-in-1 G4, for example, would experience no deficit at all between its Performance and Battery modes. We did not experience major performance declines when running the ARM-powered Asus VivoBook on battery power, either. HP says a BIOS update (F.07) is coming soon to address this concern.
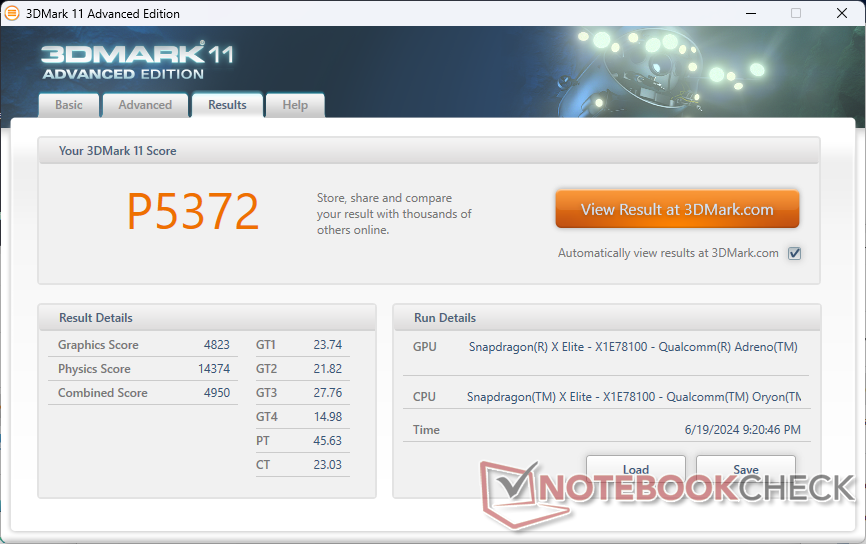
| 3DMark 11 Performance | 5372 points | |
| 3DMark Cloud Gate Standard Score | 18704 points | |
| 3DMark Fire Strike Score | 5346 points | |
| 3DMark Time Spy Score | 1799 points | |
Help | ||
* ... smaller is better
Gaming Performance
Users interested in an ARM-powered Windows PC for gaming purposes are not looking at the right place as this Snapdragon chip was not designed for gamers. With that said, Qualcomm notoriously boasted the ability to run Baldur's Gate 3 at 1080p and 30 FPS which immediately caught the attention of most reviewers. Without the help of FSR, however, we're only able to average 23 FPS and 35 FPS on 1080p Low and 720p Low settings, respectively. Performance in other games would be similarly disappointing with results that come in much slower than the competing Arc 8 or Radeon 680M as predicted by the synthetic 3DMark results above.
Perhaps the worst and most noticeable issue at the moment is the uneven frame pacing or frame skipping we experienced on most tested games. Even if average frame rates are decent like on Tiny Tina's Wonderlands, frame skips would occur much more frequently than on an Intel or AMD alternative to the point of distraction. Qualcomm definitely has a long way to go before their drivers can become as mature as the competition.
| Performance rating - Percent | |
| Apple MacBook Pro 14 2023 M3 Max -4! | |
| Lenovo ThinkPad X1 Carbon G12 | |
| HP Dragonfly Pro 2023 -1! | |
| Dell Latitude 9450 2-in-1 -1! | |
| Asus Vivobook S 15 OLED Snapdragon -1! | |
| HP EliteBook Ultra G1q 14 | |
| The Witcher 3 - 1920x1080 Ultra Graphics & Postprocessing (HBAO+) | |
| Apple MacBook Pro 14 2023 M3 Max | |
| Lenovo ThinkPad X1 Carbon G12 | |
| HP Dragonfly Pro 2023 | |
| Asus Vivobook S 15 OLED Snapdragon | |
| Dell Latitude 9450 2-in-1 | |
| HP EliteBook Ultra G1q 14 | |
| Final Fantasy XV Benchmark - 1920x1080 High Quality | |
| Lenovo ThinkPad X1 Carbon G12 | |
| HP Dragonfly Pro 2023 | |
| Dell Latitude 9450 2-in-1 | |
| Asus Vivobook S 15 OLED Snapdragon | |
| HP EliteBook Ultra G1q 14 | |
| Strange Brigade - 1920x1080 ultra AA:ultra AF:16 | |
| Lenovo ThinkPad X1 Carbon G12 | |
| HP Dragonfly Pro 2023 | |
| Asus Vivobook S 15 OLED Snapdragon | |
| Dell Latitude 9450 2-in-1 | |
| HP EliteBook Ultra G1q 14 | |
| Dota 2 Reborn - 1920x1080 ultra (3/3) best looking | |
| Lenovo ThinkPad X1 Carbon G12 | |
| HP Dragonfly Pro 2023 | |
| Dell Latitude 9450 2-in-1 | |
| Asus Vivobook S 15 OLED Snapdragon | |
| HP EliteBook Ultra G1q 14 | |
| Tiny Tina's Wonderlands - 1920x1080 High Preset (DX12) | |
| Lenovo ThinkPad X1 Carbon G12 | |
| HP EliteBook Ultra G1q 14 | |
Witcher 3 FPS Chart
| low | med. | high | ultra | |
|---|---|---|---|---|
| The Witcher 3 (2015) | 109.2 | 70.9 | 39.7 | 17.5 |
| Dota 2 Reborn (2015) | 77.9 | 60.9 | 55.9 | 49.3 |
| Final Fantasy XV Benchmark (2018) | 51 | 23 | 14.3 | |
| X-Plane 11.11 (2018) | 36.4 | |||
| Strange Brigade (2018) | 114.3 | 43.6 | 36.7 | 32 |
| Tiny Tina's Wonderlands (2022) | 41.5 | 30.8 | 20.6 | 16.8 |
| F1 22 (2022) | 57.6 | 51 | 36.2 | 27 |
| Baldur's Gate 3 (2023) | 23.1 | 19.6 | 17.1 | 16.6 |
| Cyberpunk 2077 (2023) | 22.1 | 18.3 |
Emissions — Barely Audible
System Noise
Fan noise is quieter than most other 14-inch subnotebooks. The internal fan tends to stabilize at just 25 dB(A) when browsing the web or video streaming against a silent background of 23.4 dB(A) to be essentially inaudible during use. At worst, the system would stay just below 35 dB(A) when gaming or running very demanding tasks which is still noticeably quieter than most traditional alternatives like the MacBook Pro 14 or ThinkPad X1 Carbon G12.
Noise level
| Idle |
| 23.4 / 23.4 / 24.3 dB(A) |
| Load |
| 25 / 34.8 dB(A) |
 | ||
30 dB silent 40 dB(A) audible 50 dB(A) loud |
||
min: | ||
| HP EliteBook Ultra G1q 14 Adreno X1-85 3.8 TFLOPS, SD X Elite X1E-78-100, SK hynix PC801 HFS512GEJ9X101N BF | Asus Vivobook S 15 OLED Snapdragon Adreno X1-85 3.8 TFLOPS, SD X Elite X1E-78-100, Micron 2400 MTFDKBA1T0QFM | HP Dragonfly Pro 2023 Radeon 680M, R7 7736U, PSEIB512GABBMC0 | Dell Latitude 9450 2-in-1 Graphics 4-Core iGPU (Arrow Lake), Ultra 7 165U | Lenovo ThinkPad X1 Carbon G12 Arc 8-Core, Ultra 7 155H, Kioxia XG8 KXG8AZNV1T02 | Apple MacBook Pro 14 2023 M3 Max M3 Max 40-Core GPU, Apple M3 Max 16-Core, Apple SSD AP2048Z | |
|---|---|---|---|---|---|---|
| Noise | -11% | -7% | -18% | -9% | -13% | |
| off / environment * (dB) | 23.4 | 24.3 -4% | 23 2% | 23.9 -2% | 23.8 -2% | 24.8 -6% |
| Idle Minimum * (dB) | 23.4 | 24.3 -4% | 23 2% | 23.9 -2% | 24 -3% | 24.8 -6% |
| Idle Average * (dB) | 23.4 | 24.3 -4% | 23 2% | 23.9 -2% | 24 -3% | 24.8 -6% |
| Idle Maximum * (dB) | 24.3 | 26.2 -8% | 23 5% | 23.9 2% | 24 1% | 24.8 -2% |
| Load Average * (dB) | 25 | 32.5 -30% | 27.8 -11% | 36.4 -46% | 31.5 -26% | 25.8 -3% |
| Witcher 3 ultra * (dB) | 30.6 | 40.6 -33% | 44.7 -46% | 37.8 -24% | 43.4 -42% | |
| Load Maximum * (dB) | 34.8 | 39.8 -14% | 40.3 -16% | 44.7 -28% | 37.8 -9% | 43.4 -25% |
| Cyberpunk 2077 ultra * (dB) | 35.2 |
* ... smaller is better
Temperature
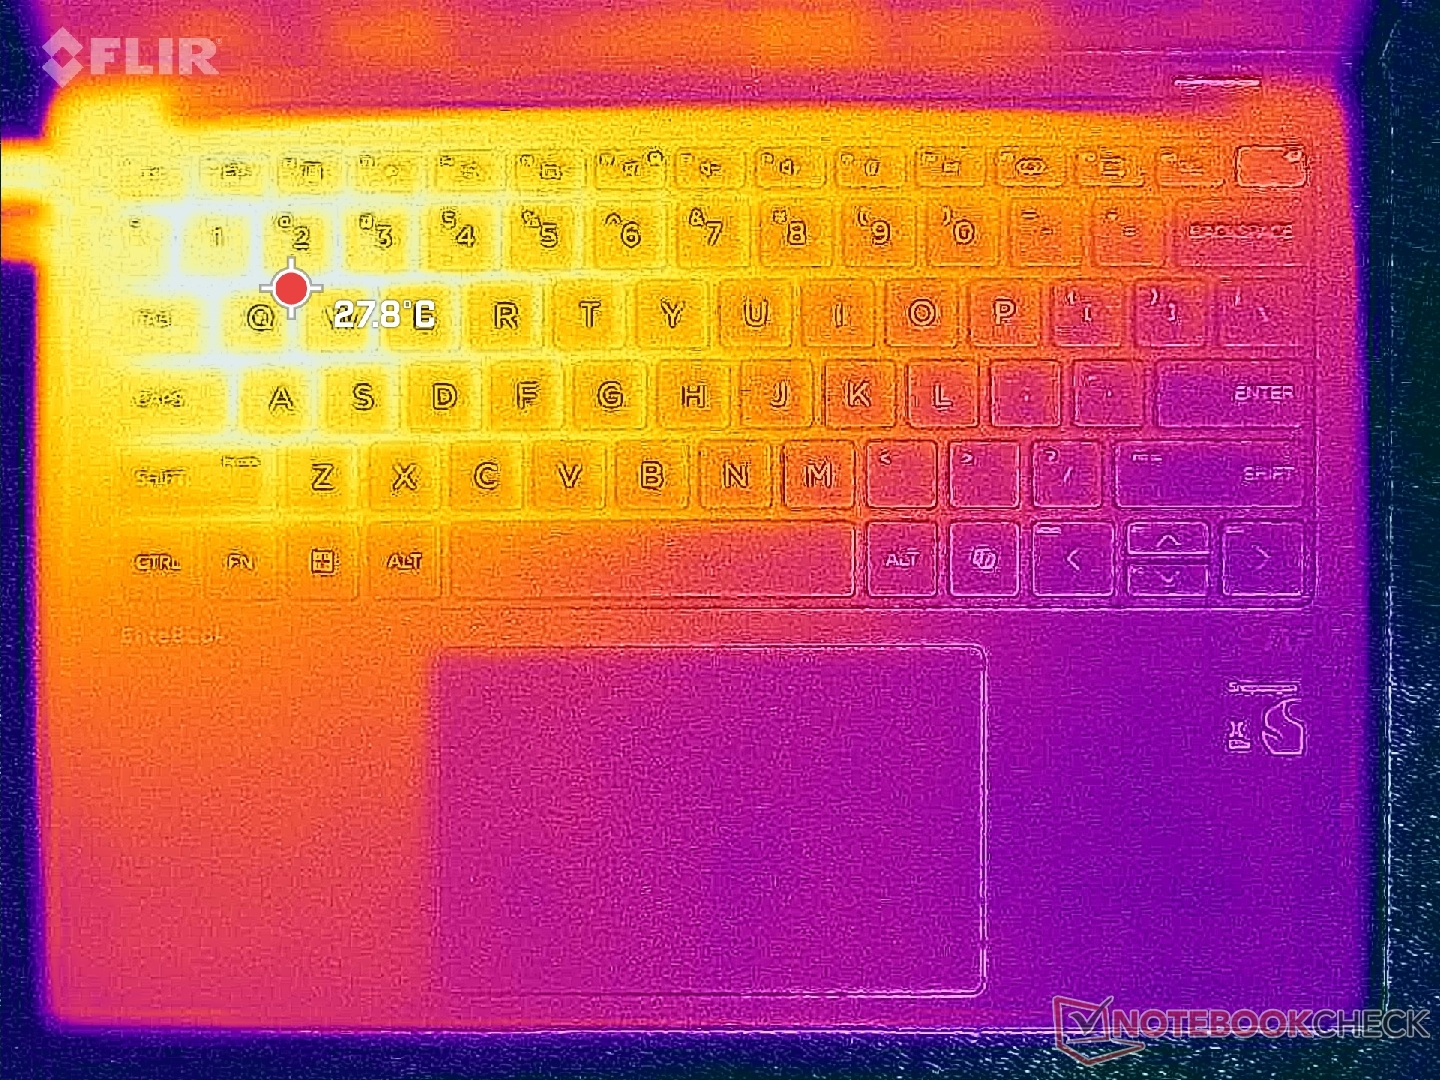
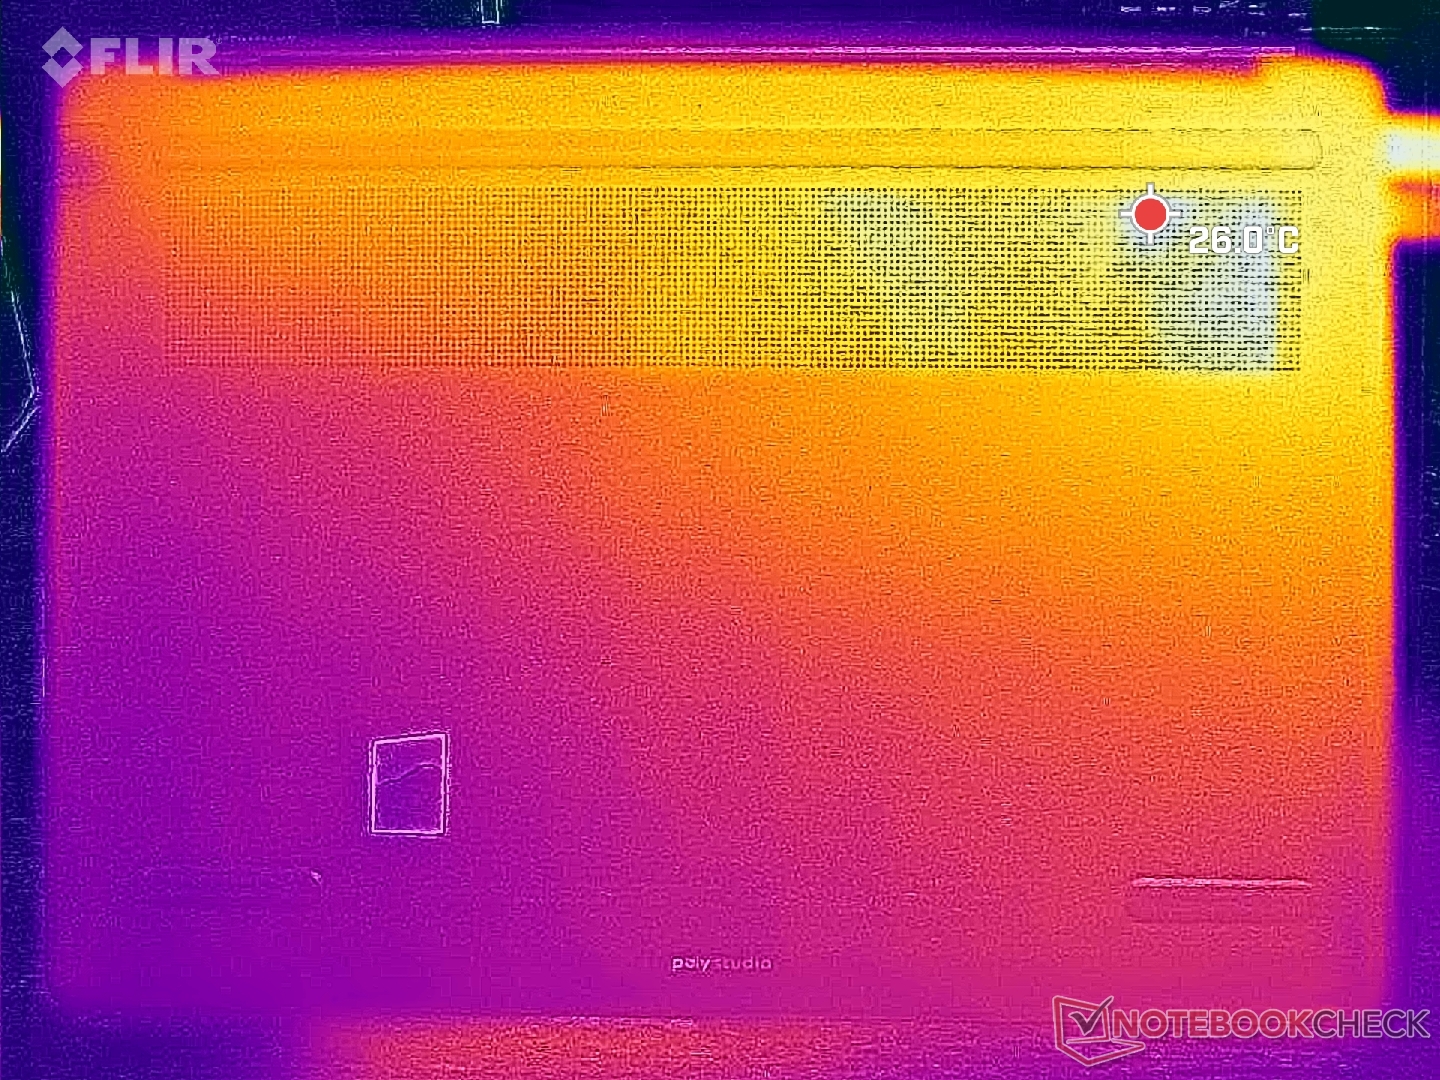
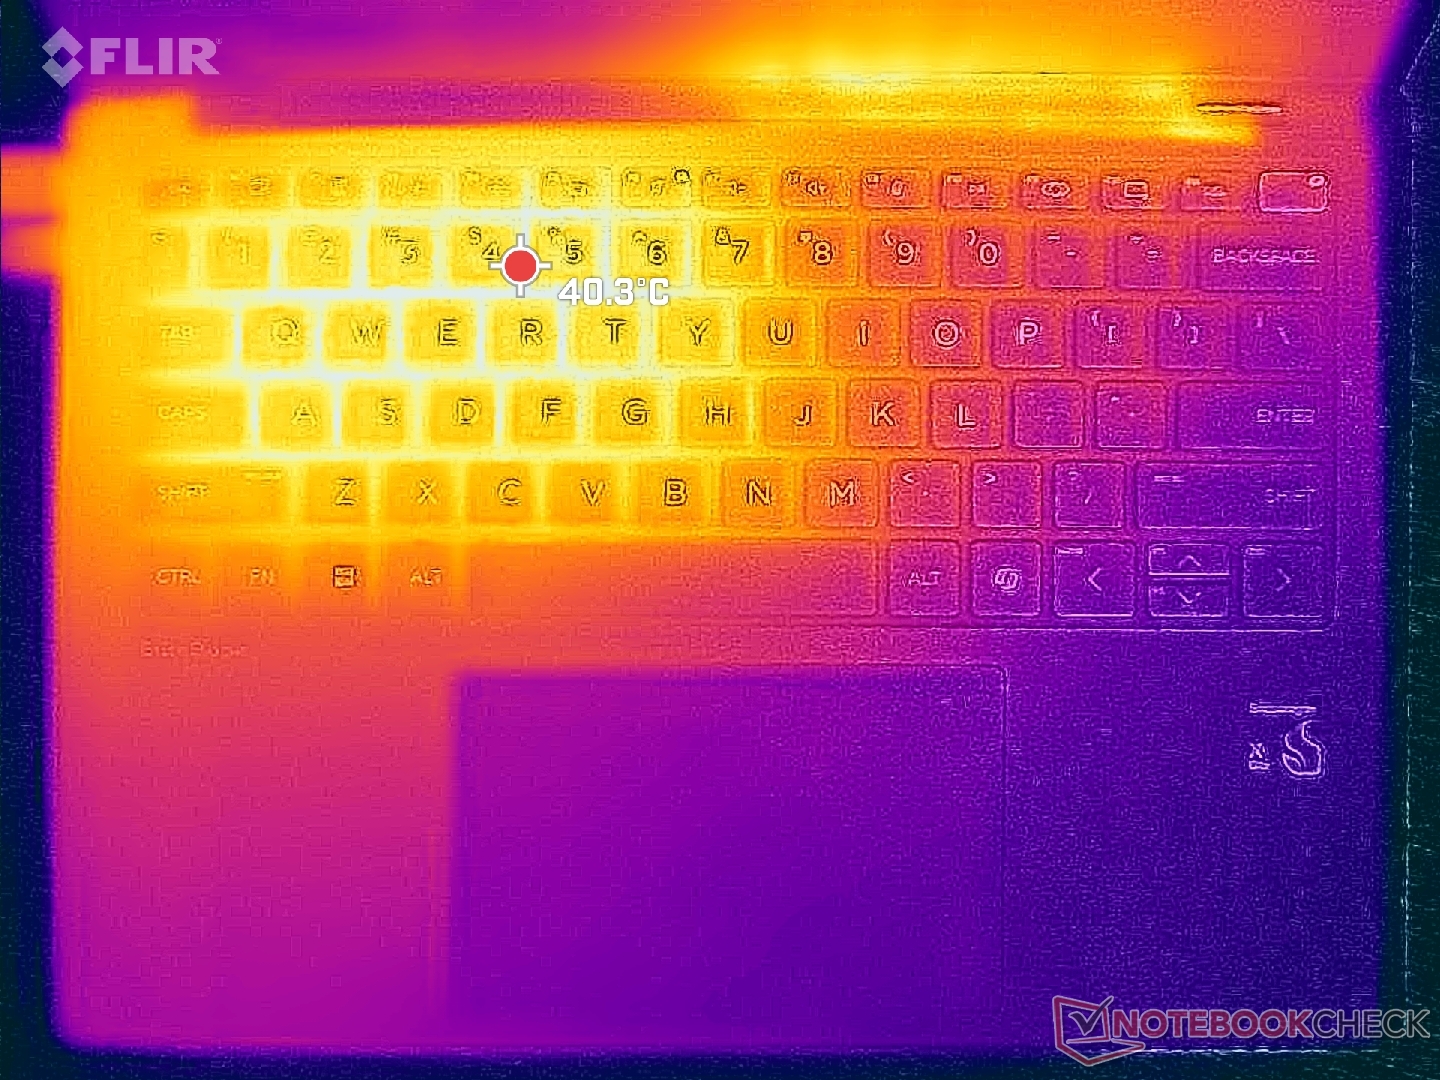
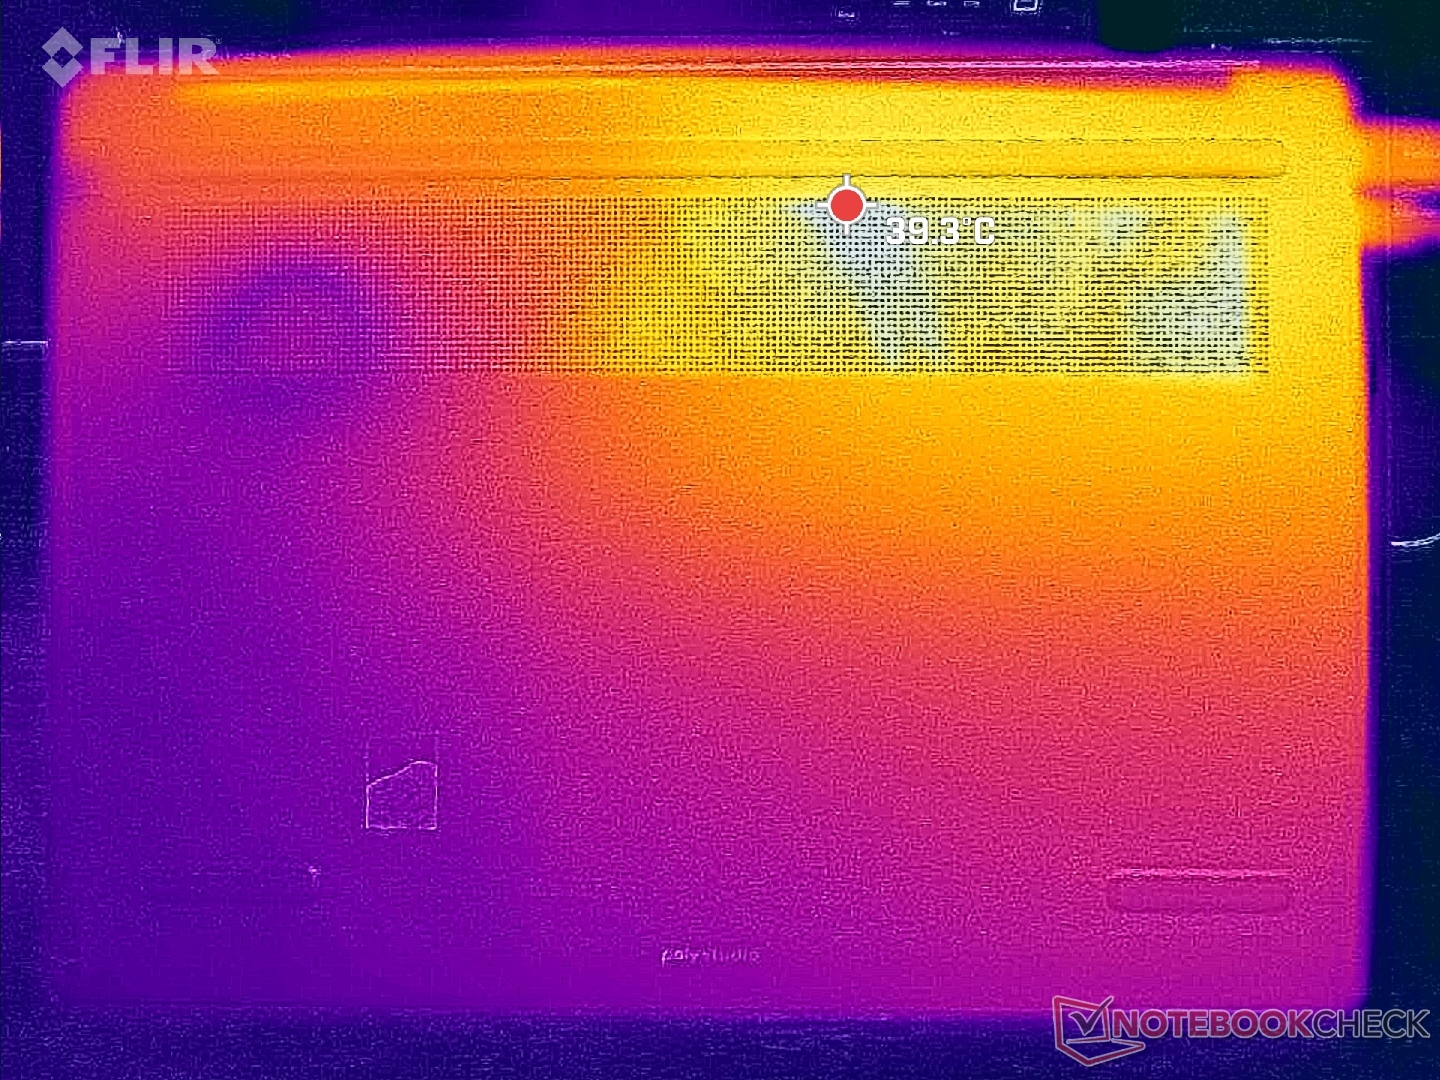
The left half of the system is always warmer than the right due to the asymmetric cooling solution within. The hot spot near the WASD keys can reach over 40 C when stressed compared to the right side of the keyboard which can be almost 10 C cooler. The temperature differences between the two halves of the chassis are noticeable during use but never uncomfortably so.
Average surface temperatures are quite close to what we recorded on the Dragonfly Pro to suggest that the EliteBook Ultra G1q doesn't run any cooler or warmer despite their significant motherboard differences.
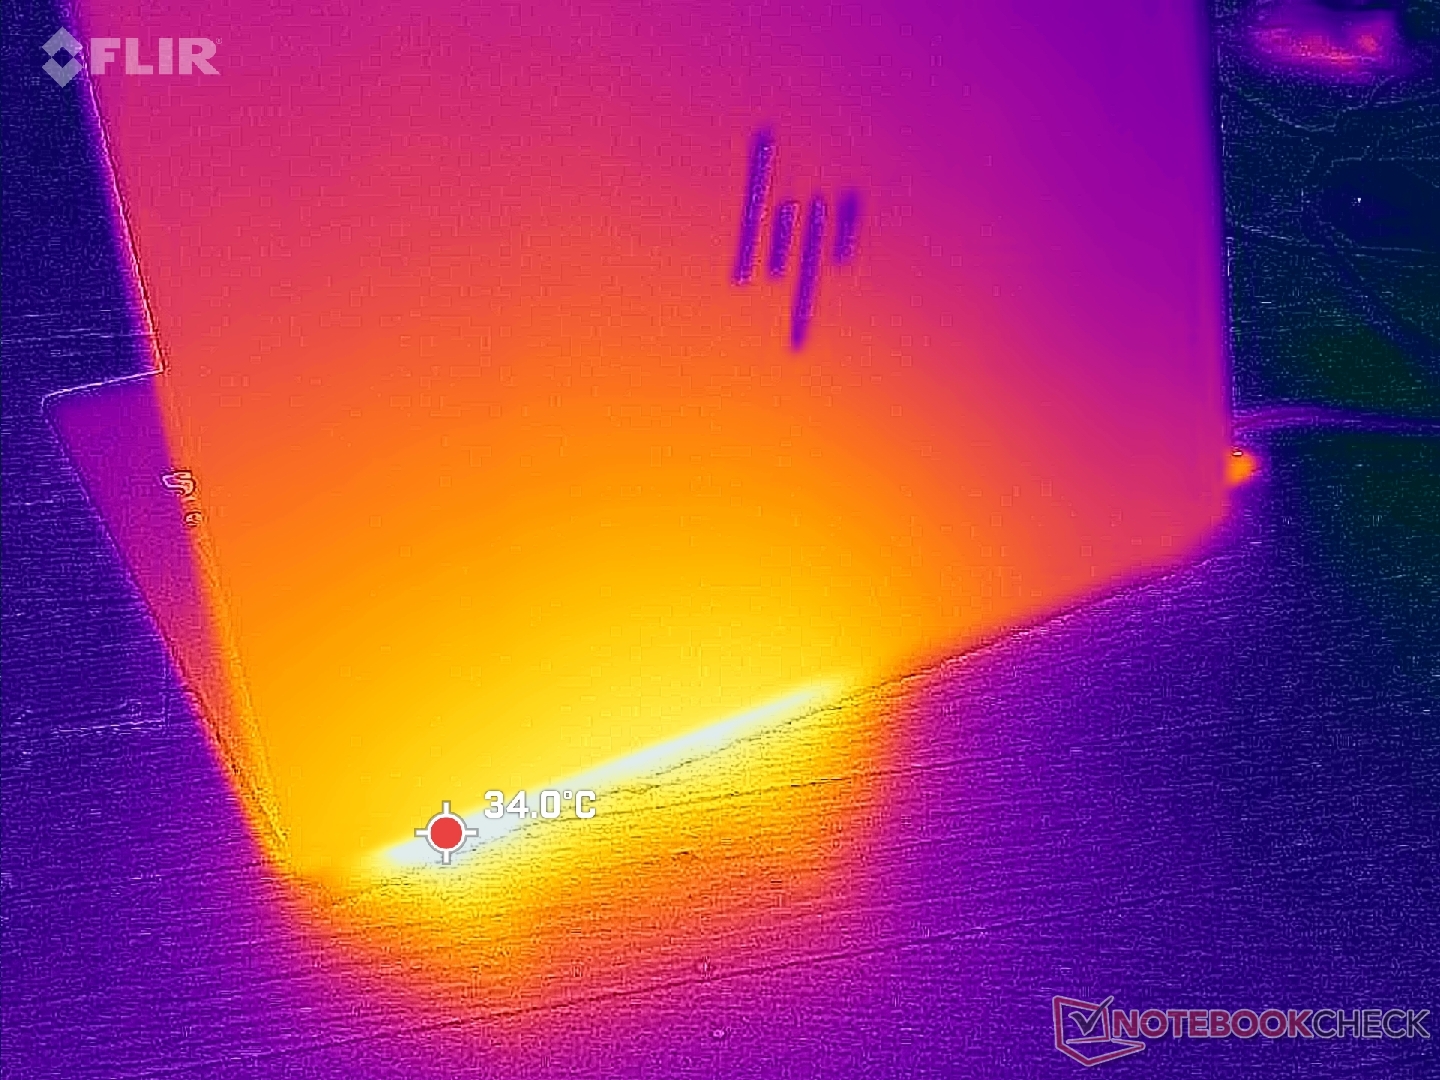
(±) The maximum temperature on the upper side is 40.8 °C / 105 F, compared to the average of 35.9 °C / 97 F, ranging from 21.4 to 59 °C for the class Subnotebook.
(±) The bottom heats up to a maximum of 40.4 °C / 105 F, compared to the average of 39.2 °C / 103 F
(+) In idle usage, the average temperature for the upper side is 27.8 °C / 82 F, compared to the device average of 30.8 °C / 87 F.
(+) The palmrests and touchpad are cooler than skin temperature with a maximum of 28.2 °C / 82.8 F and are therefore cool to the touch.
(±) The average temperature of the palmrest area of similar devices was 28.2 °C / 82.8 F (0 °C / 0 F).
| HP EliteBook Ultra G1q 14 Qualcomm Snapdragon X Elite X1E-78-100, Qualcomm SD X Adreno X1-85 3.8 TFLOPS | Asus Vivobook S 15 OLED Snapdragon Qualcomm Snapdragon X Elite X1E-78-100, Qualcomm SD X Adreno X1-85 3.8 TFLOPS | HP Dragonfly Pro 2023 AMD Ryzen 7 7736U, AMD Radeon 680M | Dell Latitude 9450 2-in-1 Intel Core Ultra 7 165U, Intel Graphics 4-Core iGPU (Meteor / Arrow Lake) | Lenovo ThinkPad X1 Carbon G12 Intel Core Ultra 7 155H, Intel Arc 8-Core iGPU | Apple MacBook Pro 14 2023 M3 Max Apple M3 Max 16-Core, Apple M3 Max 40-Core GPU | |
|---|---|---|---|---|---|---|
| Heat | -2% | 14% | 11% | -0% | 9% | |
| Maximum Upper Side * (°C) | 40.8 | 43.6 -7% | 38.6 5% | 35.4 13% | 44.2 -8% | 45.9 -13% |
| Maximum Bottom * (°C) | 40.4 | 53.1 -31% | 42.8 -6% | 37.8 6% | 41.2 -2% | 42.1 -4% |
| Idle Upper Side * (°C) | 32.2 | 26.7 17% | 22.2 31% | 27.2 16% | 29.4 9% | 23.4 27% |
| Idle Bottom * (°C) | 31.2 | 27.2 13% | 23.6 24% | 28.2 10% | 31.2 -0% | 23.8 24% |
* ... smaller is better
Speakers
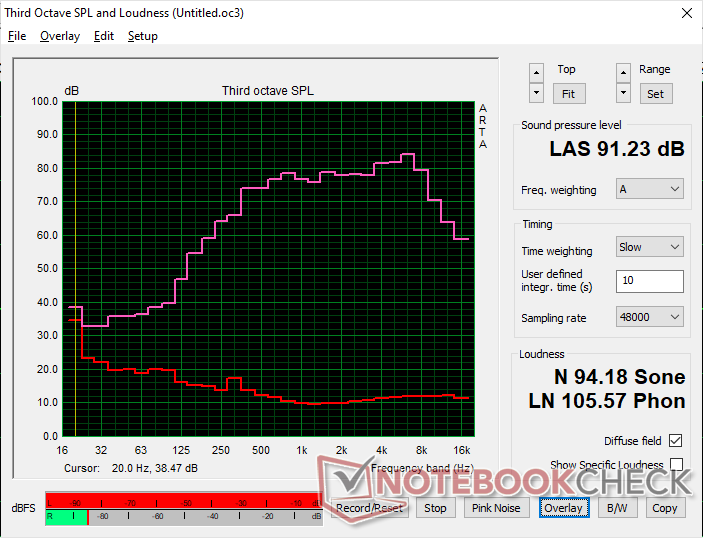
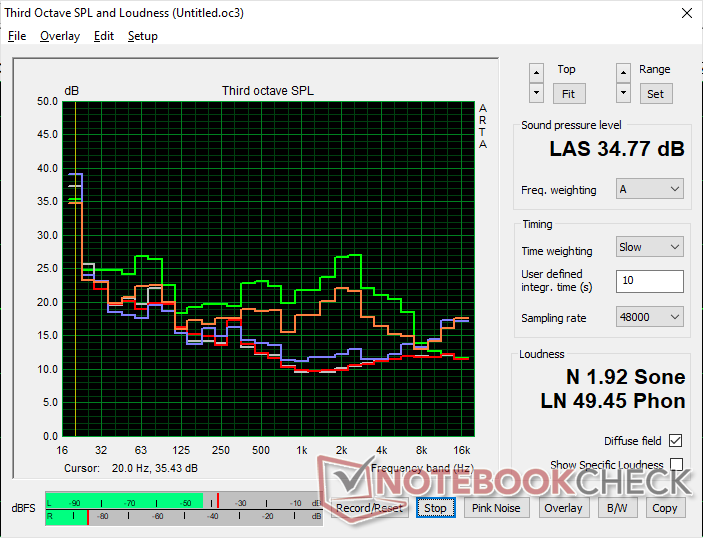
HP EliteBook Ultra G1q 14 audio analysis
(+) | speakers can play relatively loud (91.2 dB)
Bass 100 - 315 Hz
(-) | nearly no bass - on average 21.6% lower than median
(±) | linearity of bass is average (7.1% delta to prev. frequency)
Mids 400 - 2000 Hz
(+) | balanced mids - only 1.4% away from median
(+) | mids are linear (3.6% delta to prev. frequency)
Highs 2 - 16 kHz
(+) | balanced highs - only 4.2% away from median
(+) | highs are linear (4.5% delta to prev. frequency)
Overall 100 - 16.000 Hz
(+) | overall sound is linear (14.4% difference to median)
Compared to same class
» 29% of all tested devices in this class were better, 6% similar, 66% worse
» The best had a delta of 5%, average was 18%, worst was 53%
Compared to all devices tested
» 18% of all tested devices were better, 4% similar, 78% worse
» The best had a delta of 4%, average was 24%, worst was 134%
Apple MacBook Pro 16 2021 M1 Pro audio analysis
(+) | speakers can play relatively loud (84.7 dB)
Bass 100 - 315 Hz
(+) | good bass - only 3.8% away from median
(+) | bass is linear (5.2% delta to prev. frequency)
Mids 400 - 2000 Hz
(+) | balanced mids - only 1.3% away from median
(+) | mids are linear (2.1% delta to prev. frequency)
Highs 2 - 16 kHz
(+) | balanced highs - only 1.9% away from median
(+) | highs are linear (2.7% delta to prev. frequency)
Overall 100 - 16.000 Hz
(+) | overall sound is linear (4.6% difference to median)
Compared to same class
» 0% of all tested devices in this class were better, 0% similar, 100% worse
» The best had a delta of 5%, average was 17%, worst was 45%
Compared to all devices tested
» 0% of all tested devices were better, 0% similar, 100% worse
» The best had a delta of 4%, average was 24%, worst was 134%
Energy Management
Power Consumption
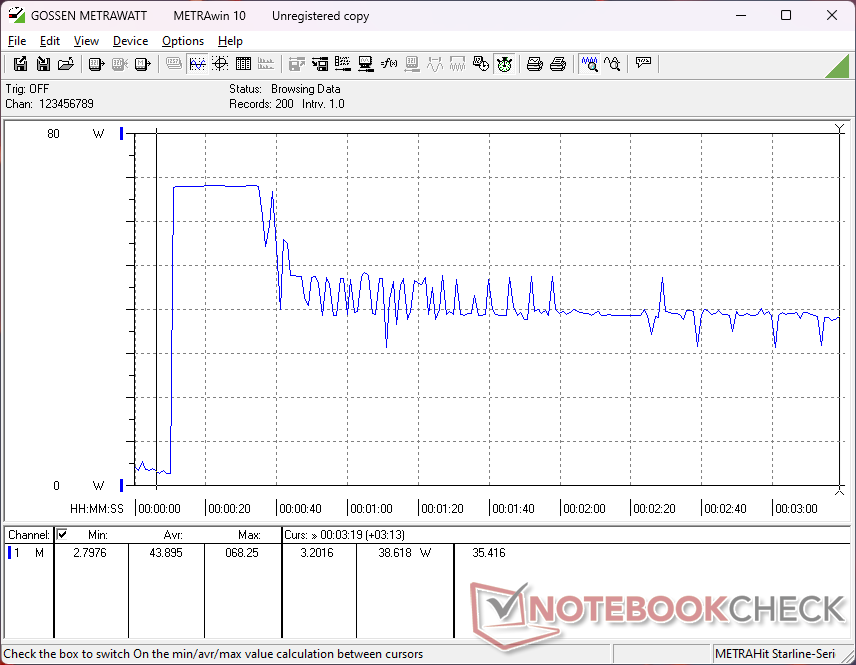
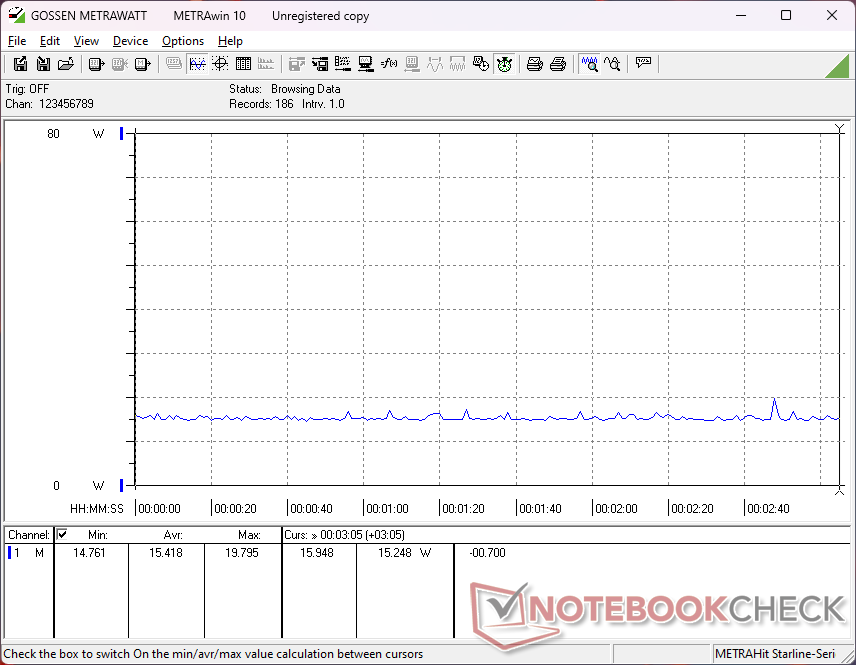
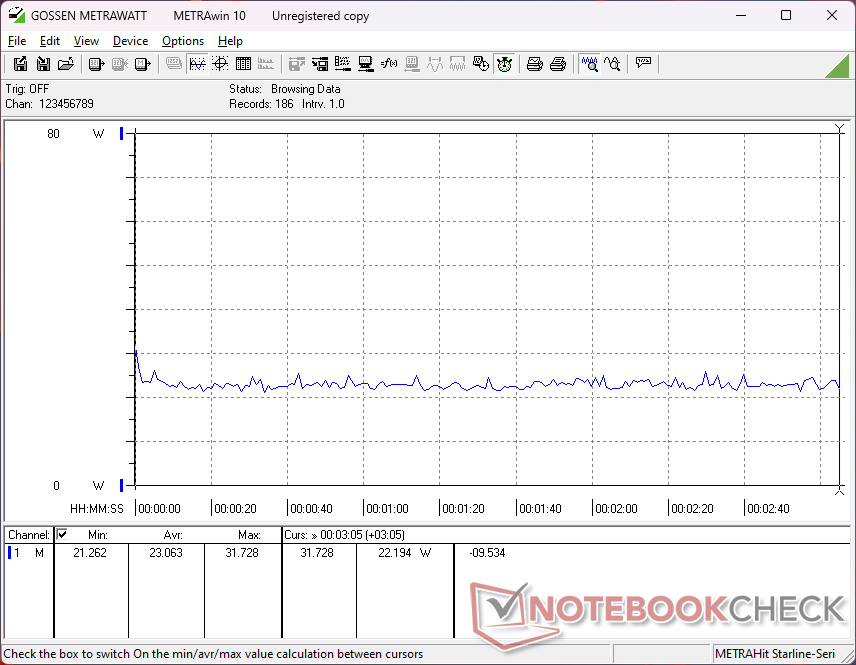
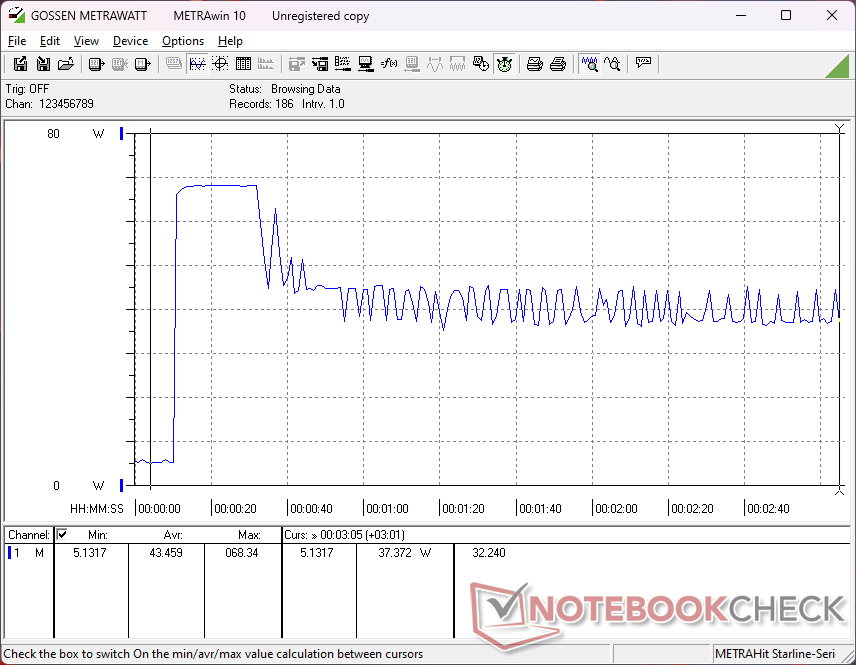
ARM devices are well known for their power-sipping behavior and the EliteBook Ultra G1q 14 is no different. Idling on desktop demands between 3 W and 6 W depending on the brightness level which is lower than most other subnotebooks. Similarly, running more demanding loads like games would draw around 24 W only compared to 35 W to 55 W on the Core U-powered Latitude 9450 2-in-1. The EliteBook Ultra G1q 14 may be the slower machine generally speaking, but at least its consumption levels are lower to compensate.
| Off / Standby | |
| Idle | |
| Load |
|
Key:
min: | |
| HP EliteBook Ultra G1q 14 SD X Elite X1E-78-100, Adreno X1-85 3.8 TFLOPS, SK hynix PC801 HFS512GEJ9X101N BF, IPS, 2240x1400, 14" | Asus Vivobook S 15 OLED Snapdragon SD X Elite X1E-78-100, Adreno X1-85 3.8 TFLOPS, Micron 2400 MTFDKBA1T0QFM, OLED, 2880x1620, 15.6" | HP Dragonfly Pro 2023 R7 7736U, Radeon 680M, PSEIB512GABBMC0, IPS, 1920x1200, 14" | Dell Latitude 9450 2-in-1 Ultra 7 165U, Graphics 4-Core iGPU (Arrow Lake), , IPS, 2560x1600, 14" | Lenovo ThinkPad X1 Carbon G12 Ultra 7 155H, Arc 8-Core, Kioxia XG8 KXG8AZNV1T02, OLED, 2880x1800, 14" | Apple MacBook Pro 14 2023 M3 Max Apple M3 Max 16-Core, M3 Max 40-Core GPU, Apple SSD AP2048Z, Mini-LED, 3024x1964, 14.2" | |
|---|---|---|---|---|---|---|
| Power Consumption | -31% | -46% | -52% | -74% | -148% | |
| Idle Minimum * (Watt) | 2.5 | 4.4 -76% | 3.2 -28% | 3.2 -28% | 3.9 -56% | 2.6 -4% |
| Idle Average * (Watt) | 5.7 | 6.2 -9% | 5.4 5% | 6.4 -12% | 5.8 -2% | 11.8 -107% |
| Idle Maximum * (Watt) | 5.8 | 7.5 -29% | 5.6 3% | 10.8 -86% | 16 -176% | 12.2 -110% |
| Load Average * (Watt) | 24.2 | 33.6 -39% | 42.2 -74% | 54.6 -126% | 46.1 -90% | 99.9 -313% |
| Witcher 3 ultra * (Watt) | 23.1 | 29.9 -29% | 60 -160% | 35.5 -54% | 50.4 -118% | 92.5 -300% |
| Cyberpunk 2077 ultra external monitor * (Watt) | 26.8 | 38.9 -45% | ||||
| Cyberpunk 2077 ultra * (Watt) | 33.5 | 39 -16% | ||||
| Load Maximum * (Watt) | 66.4 | 69.3 -4% | 82 -23% | 70.2 -6% | 67.4 -2% | 101.7 -53% |
* ... smaller is better
Power Consumption Witcher 3 / Stresstest
Power Consumption external Monitor
Battery Life
The 59 Wh battery is similar in capacity to more traditional Windows laptops like the Dell Latitude 9450 2-in-1 or Lenovo ThinkPad X1 Carbon G12. Battery life is excellent as to be expected from an ARM-based machine, but it's only comparable to other modern Ryzen-U or Core-U-based alternatives like the Dragonfly Pro or aforementioned Dell. Owners can expect around 13 hours of real-world browsing on a full charge.
Recharging from empty takes a little over two hours with the included AC adapter which is average for a subnotebook.
| HP EliteBook Ultra G1q 14 SD X Elite X1E-78-100, Adreno X1-85 3.8 TFLOPS, 59 Wh | Asus Vivobook S 15 OLED Snapdragon SD X Elite X1E-78-100, Adreno X1-85 3.8 TFLOPS, 70 Wh | HP Dragonfly Pro 2023 R7 7736U, Radeon 680M, 65 Wh | Dell Latitude 9450 2-in-1 Ultra 7 165U, Graphics 4-Core iGPU (Arrow Lake), 60 Wh | Lenovo ThinkPad X1 Carbon G12 Ultra 7 155H, Arc 8-Core, 57 Wh | Apple MacBook Pro 14 2023 M3 Max Apple M3 Max 16-Core, M3 Max 40-Core GPU, 72.6 Wh | |
|---|---|---|---|---|---|---|
| Battery runtime | -13% | 12% | 8% | -32% | -14% | |
| Reader / Idle (h) | 20.4 | 23.2 14% | 21.7 6% | 17.8 -13% | ||
| WiFi v1.3 (h) | 13.2 | 13.1 -1% | 13 -2% | 13.6 3% | 7.8 -41% | 15.2 15% |
| Load (h) | 2.1 | 1.6 -24% | 2.6 24% | 2.4 14% | 1.2 -43% | 1.2 -43% |
| H.264 (h) | 14.8 | 18 |
Pros
Cons
Verdict — A Good Start, But Not Good Enough
If you want to convince a layperson to choose Windows on ARM over traditional alternatives from Apple or others, then it will have to excel in several categories including performance, price, battery life, and form factor. Let's take a look at each:
Performance. Performance is comparable to the Core Ultra 7 155U/165U at best when applications run natively on ARM while being as slow as the older Core i7-1165G7 at worst when applications are emulated particularly when it comes to single-core operations. Graphics performance is underwhelming as well when compared to the latest integrated Arc and Radeon solutions from Intel and AMD, respectively.
Price. At $1700, the HP EliteBook Ultra G1q 14 costs about the same as other business-centric Core Ultra 7 subnotebooks like the Dell Latitude 7350 or Lenovo ThinkPad X1 Carbon.
Battery Life. Runtimes are excellent and longer than most Intel or AMD subnotebooks due to the high performance-per-watt. Nevertheless, Intel and AMD alternatives with comparable results are available including the 2023 Dragonfly Pro or Dell Latitude 9450 2-in-1.
Form Factor. The small size, portable weight, and quiet fan noise are highlights of the HP Qualcomm machine. However, models like the LG Gram 14, Samsung Galaxy Book4 Pro, or ThinkPad X1 Carbon G12 can be smaller or even lighter.
The challenge with the EliteBook Ultra G1q 14 isn't that it's a bad machine, but that the current competition of Intel/AMD machines is extremely tough. Buyers already have a handful of excellent subnotebooks to choose from (including from HP's own portfolio) that can match or exceed the features and capabilities of the EliteBook Ultra G1q 14 especially when it comes to compatibility. Thus, it's harder to recommend the EliteBook Ultra G1q 14 over many of the aforementioned alternatives for the vast majority of users.
The EliteBook Ultra G1q 14 is a good start for Qualcomm, but it's going to need to do much more as the latest from Intel and AMD are a step ahead for the same price.
Many of the shortcomings of the EliteBook Ultra G1q 14 could have been forgiven had it launched for a much lower starting price than the competition. Unfortunately, it costs about the same while offering no major advantages when it comes to performance or features. It's a great start, but Qualcomm and PC makers have a long way to go before Windows on ARM can convince users to make the jump.
Price and Availability
HP is now shipping the EliteBook Ultra G1q 14 for $1699.
Note: We have recently updated our rating system and the results of version 8 are not comparable with the results of version 7. More information is available here .
HP EliteBook Ultra G1q 14
- 07/02/2024 v8
Allen Ngo
 Total Sustainability Score:
 Transparency
The selection of devices to be reviewed is made by our editorial team. The test sample was provided to the author as a loan by the manufacturer or retailer for the purpose of this review. The lender had no influence on this review, nor did the manufacturer receive a copy of this review before publication. There was no obligation to publish this review. As an independent media company, Notebookcheck is not subjected to the authority of manufacturers, retailers or publishers.
This is how Notebookcheck is testing
Every year, Notebookcheck independently reviews hundreds of laptops and smartphones using standardized procedures to ensure that all results are comparable. We have continuously developed our test methods for around 20 years and set industry standards in the process. In our test labs, high-quality measuring equipment is utilized by experienced technicians and editors. These tests involve a multi-stage validation process. Our complex rating system is based on hundreds of well-founded measurements and benchmarks, which maintains objectivity. Further information on our test methods can be found here.
Price comparison
