 Deutsch
 English
 Español
 Français
 Italiano
 Nederlands
 Polski
 Português
 Русский
 Türkçe
 Svenska
 Chinese
 Magyar
Dell G5 15 5590 Laptop Review: Price/Performance King and Problem Child

While Alienware devices belong to the high-end sector, Dell's G series was created with more price-conscious gamers in mind.
The G5 15 5590-PCNJJ, which is equipped with a Core i5-9300H and a GeForce GTX 1650 and is available for around 1,000 Euros (~$1,112), is a particularly exciting offer. It comes with 8 GB of DDR4-RAM (2x 4 GB in dual-channel mode) and a 128 GB SSD combined with a 1 TB HDD. The package is rounded-off by a matte IPS display with 1920x1080 pixels.
Competitors of the G5 15 5590 include other budget gaming laptops, which are or recently have been on our top 10 list. Aside from the HP Omen 15, there is also the Acer Nitro 5 (the GTX 1650 version of which can be purchased for around 1,000 Euros or ~$1,112). At close to 1,400 Euros (~$1,557), the GTX 1660 Ti competitors Lenovo Legion Y540-15 and HP Gaming Pavilion 15 are slightly more expensive.
Rating | Date | Model | Weight | Height | Size | Resolution | Best Price |
|---|---|---|---|---|---|---|---|
| 79.6 % | 10/2019 | Dell G5 15 5590-PCNJJ i5-9300H, GeForce GTX 1650 Mobile | 2.7 kg | 23.7 mm | 15.60" | 1920x1080 | |
| 81.5 % | 07/2019 | HP Omen 15-dc1020ng i5-9300H, GeForce GTX 1650 Mobile | 2.3 kg | 25 mm | 15.60" | 1920x1080 | |
| 82.5 % | 05/2019 | Acer Aspire Nitro 5 AN515-54-53Z2 i5-9300H, GeForce GTX 1650 Mobile | 2.2 kg | 27 mm | 15.60" | 1920x1080 | |
| 83.9 % | 08/2019 | HP Gaming Pavilion 15-dk0009ng i7-9750H, GeForce GTX 1660 Ti Max-Q | 2.4 kg | 23.4 mm | 15.60" | 1920x1080 | |
| 82.3 % | 08/2019 | Lenovo Legion Y540-15IRH-81SX00B2GE i7-9750H, GeForce GTX 1660 Ti Mobile | 2.2 kg | 26 mm | 15.60" | 1920x1080 |
Case
The G5's budget nature is quite apparent. Although the chassis is visually pleasing at first glance and able to shine with a white exterior in our case, a closer look reveals some flaws. Our test model suffered from loud creaking, which of course detracts from the overall good impression, even though it only occurs when opening or closing the lid and when twisting the chassis.
Speaking of twisting: We would describe the case's rigidity as average. While the base unit does not yield even under higher pressure, the lid could be slightly more rigid still. That said, the same could be said for almost any laptop.


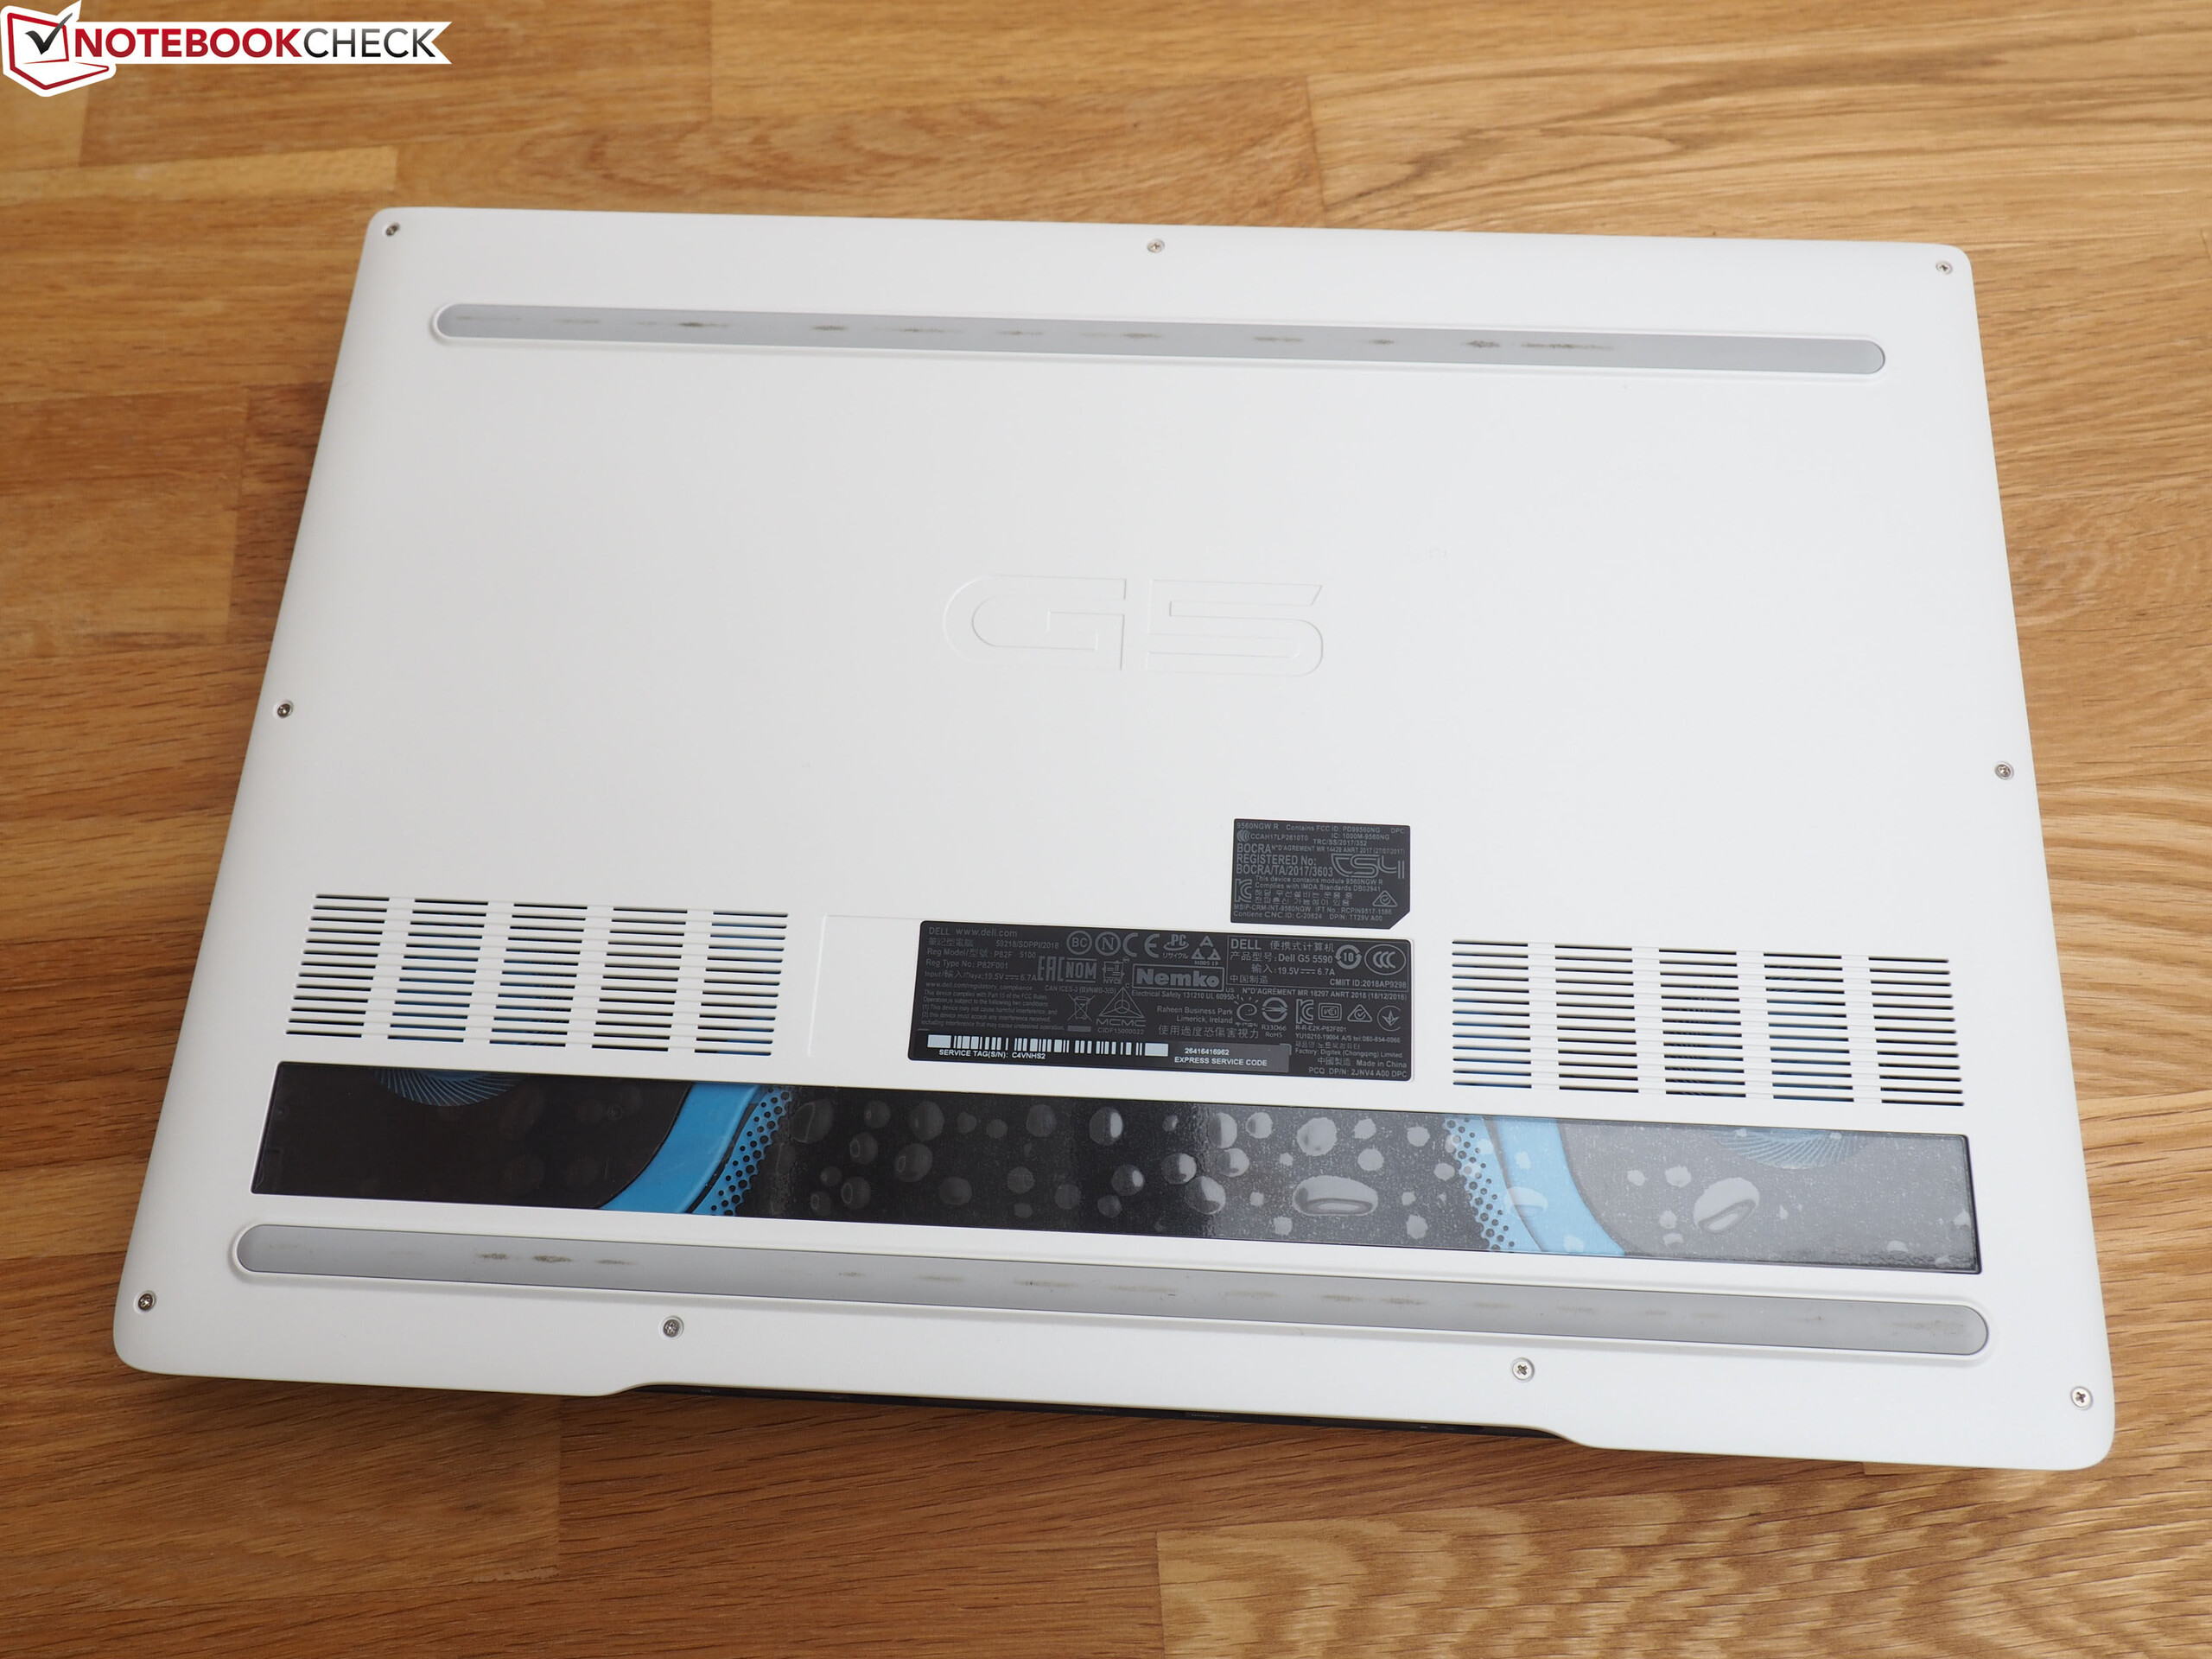


In terms of materials, Dell has chosen a combination of metal (top) and plastic (bottom & cover), matching the expectations for this price class. We were not quite satisfied with the hinges, however. When opening the lid, the base unit moves along for the first few centimeters. One-handed opening is possible regardless.
In terms of weight, its 2.7 kg makes it heavier than the competition (2.2 to 2.4 kg). Although the G5 comes with a slim-bezel design, its 364 x 273 mm footprint is also larger than that of competing devices (see size comparison). The laptop has an average height of 24 mm.
Connectivity
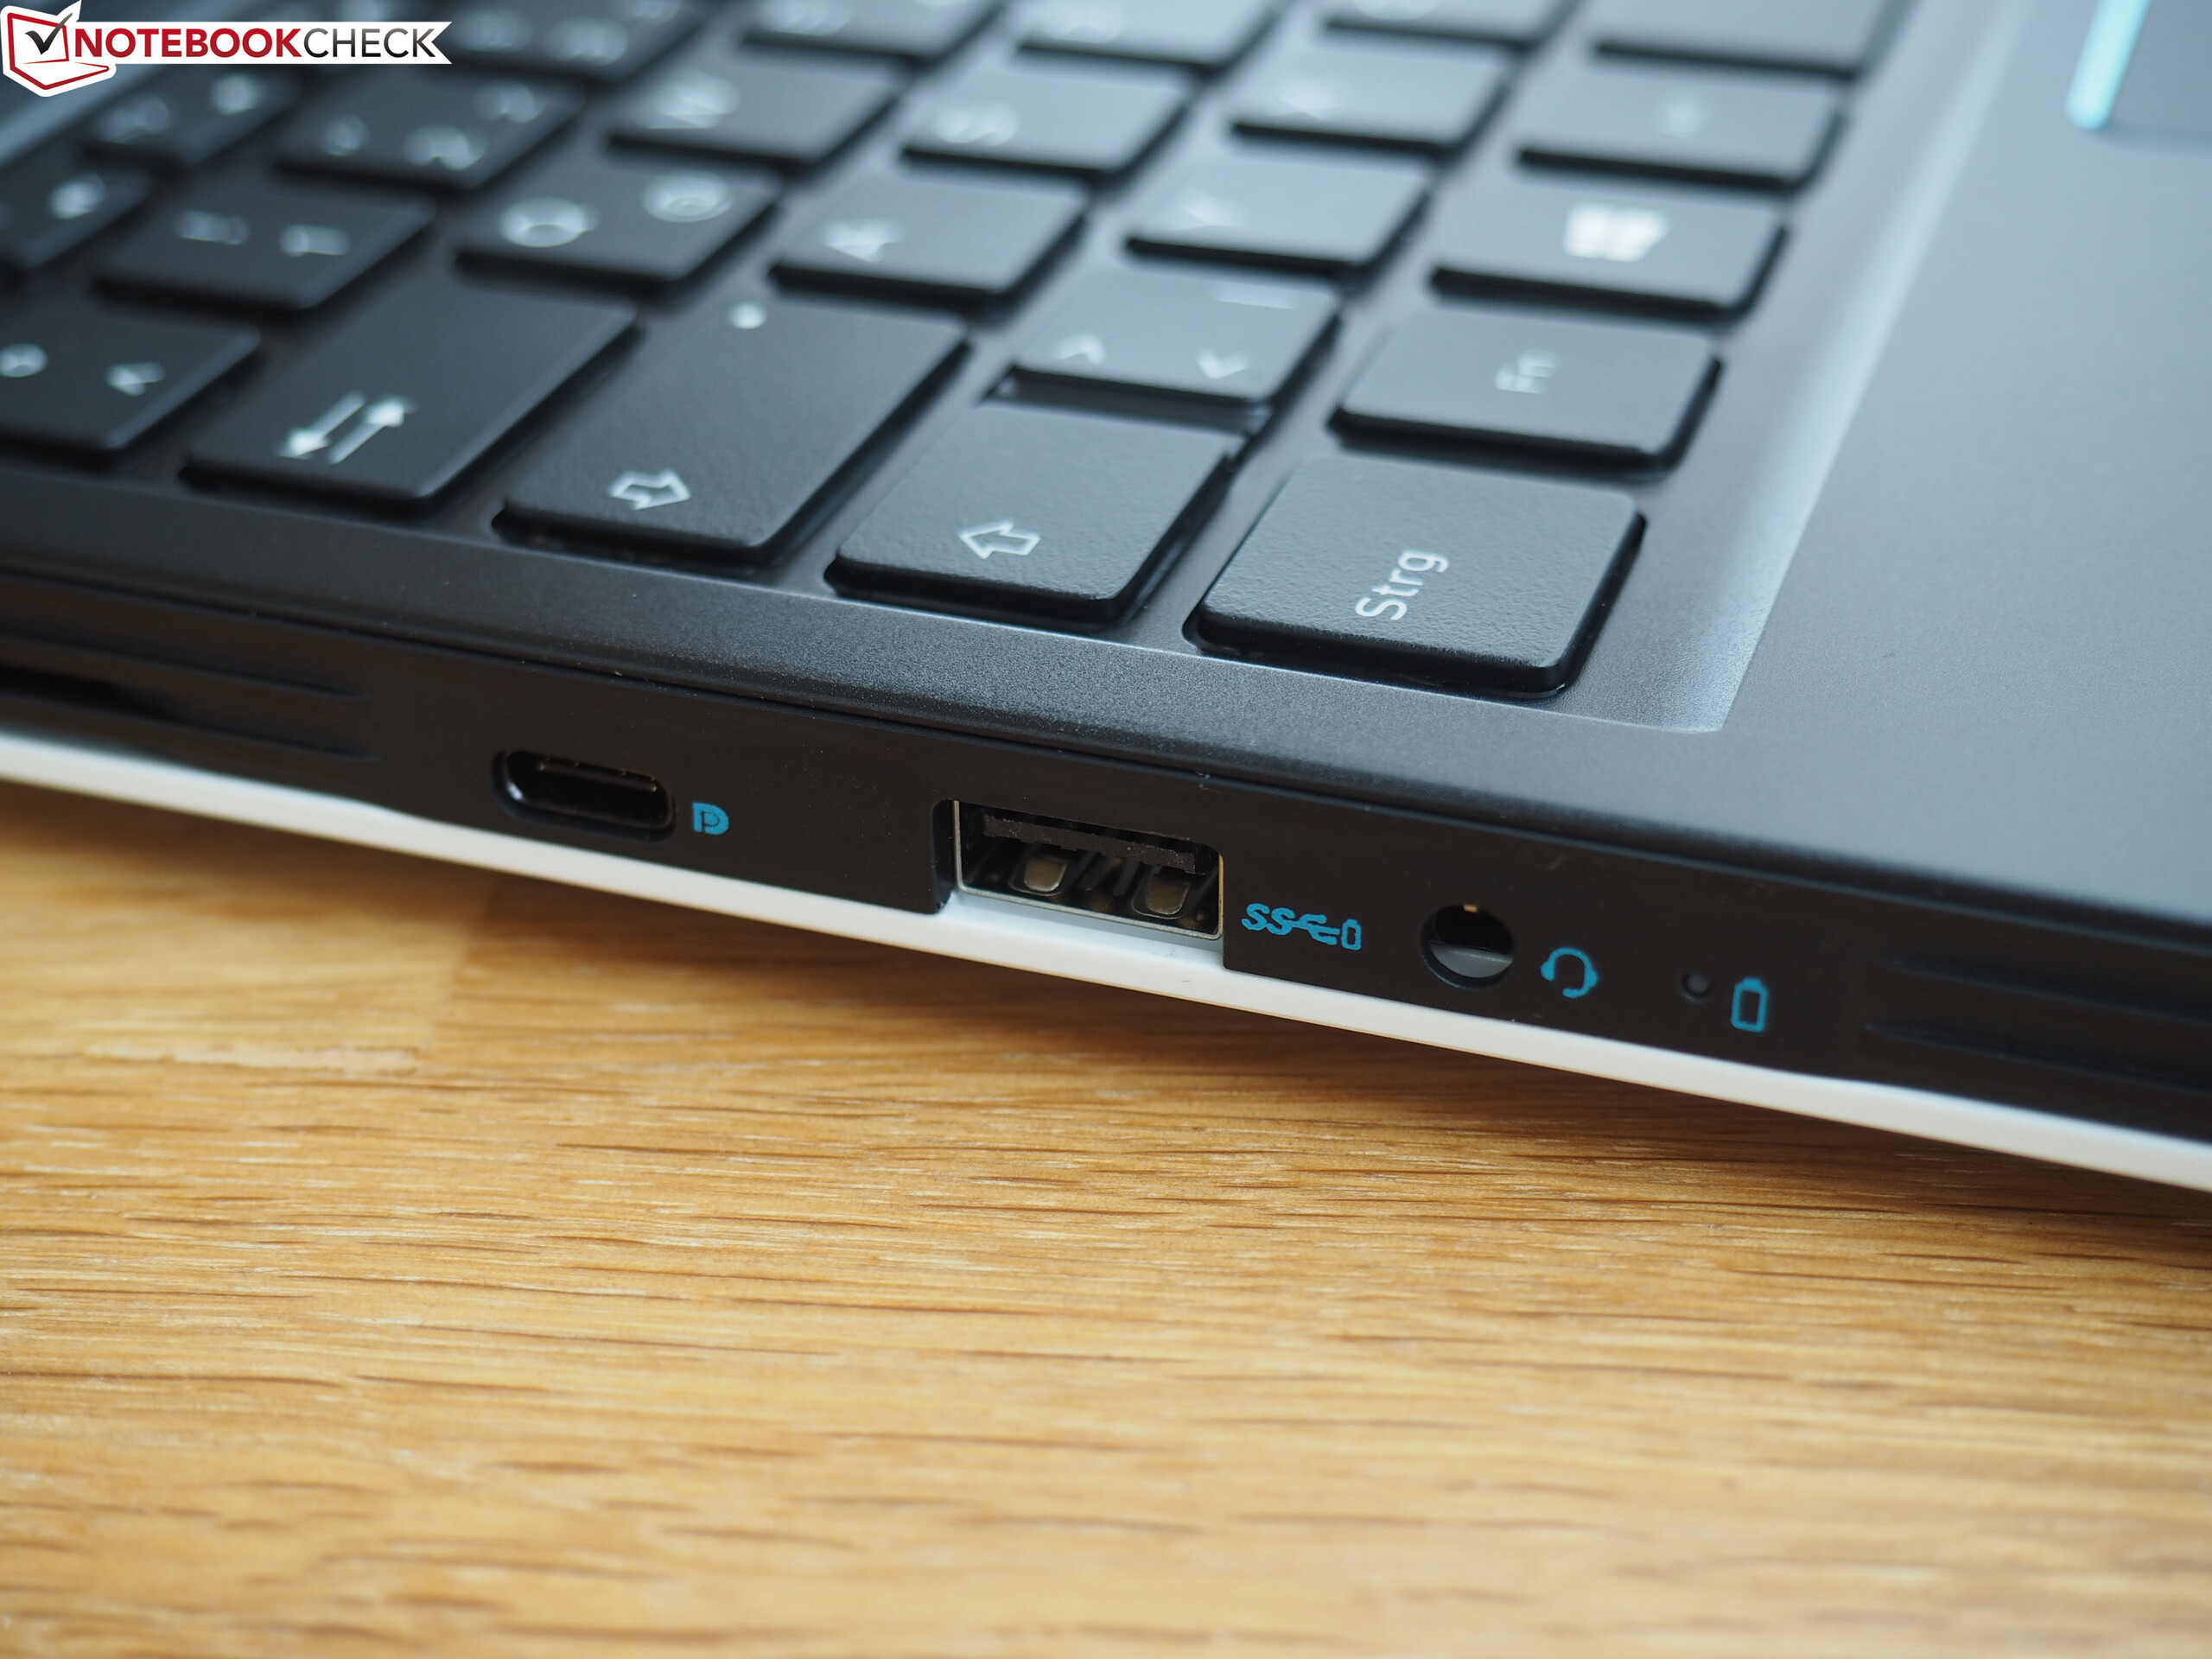
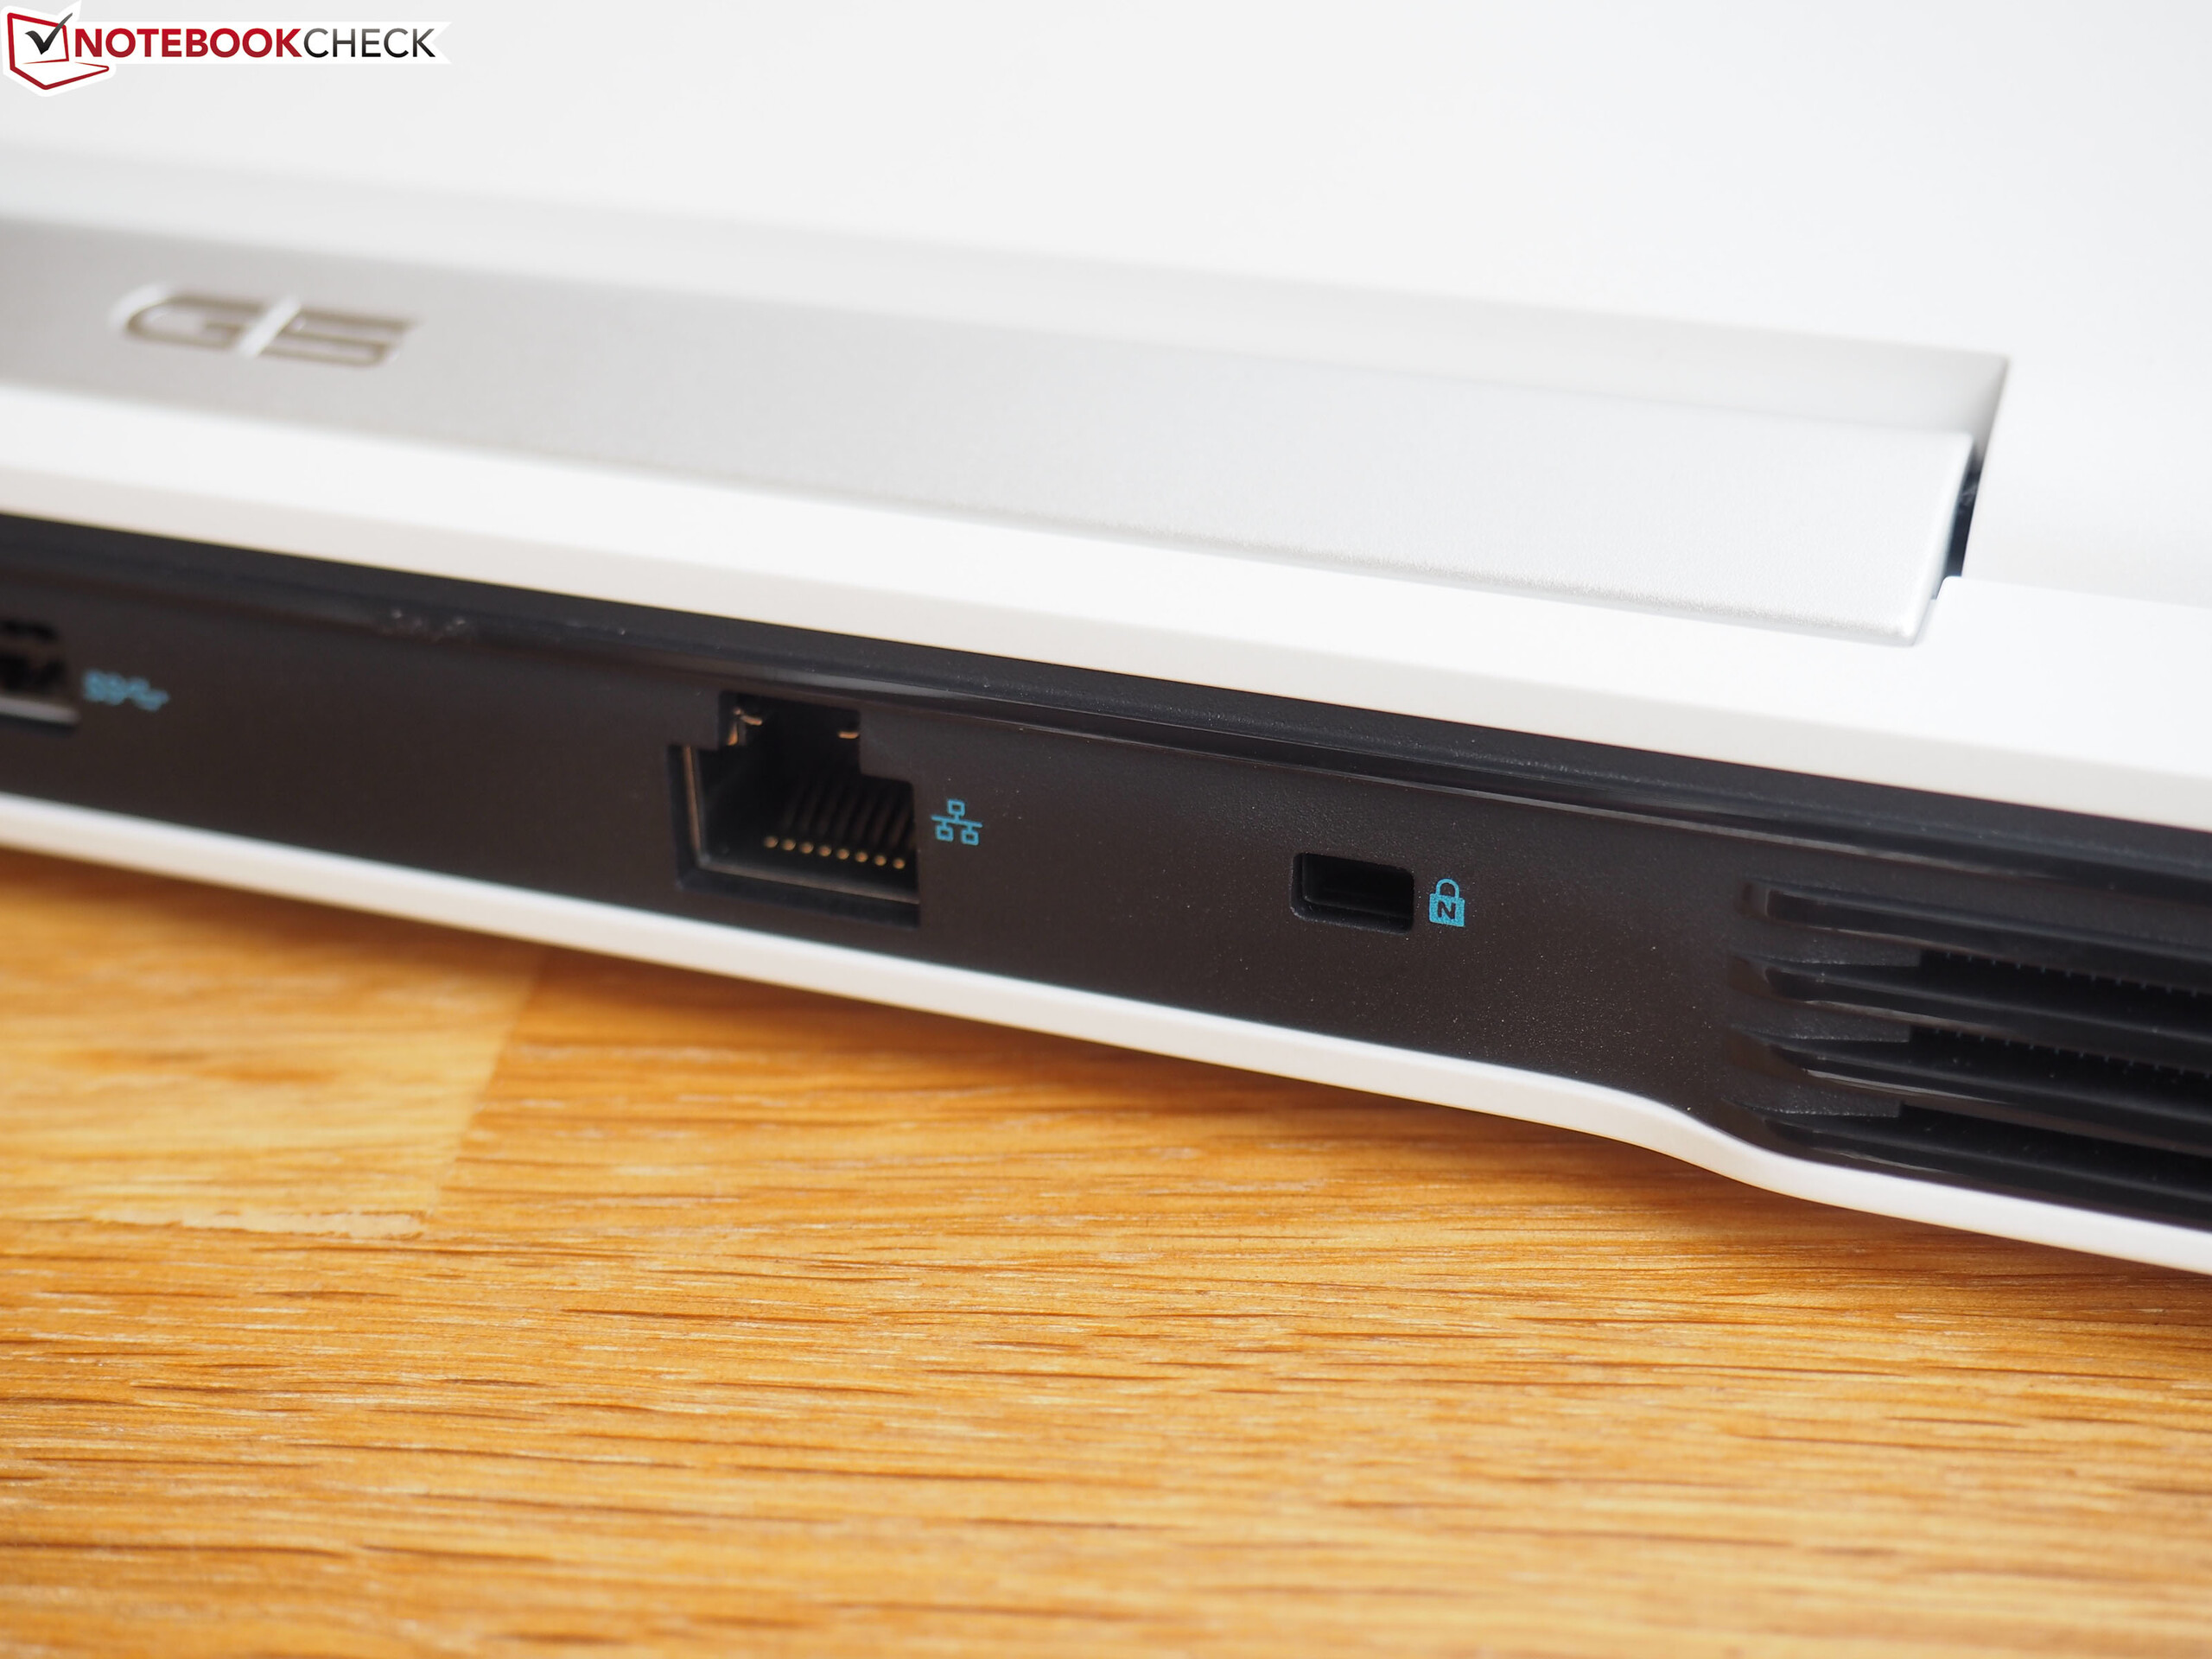
The port selection is solid compared to what the competition offers. Dell equips the G5 with four USB ports in total (3x Type-A 3.0 + 1x Type-C 3.1 Gen2 with DisplayPort support), an RJ45 LAN port, an audio jack, an HDMI output and a Noble lock port. The installed card reader cannot be taken for granted anymore either. While it lacks a Thunderbolt 3 port for a truly well-rounded port selection, the former is absent on most budget gaming laptops.
The port layout, as usual, is a matter of taste. Due to the vents on the sides, some ports are relatively close to the front, which may impair movements of an external mouse.


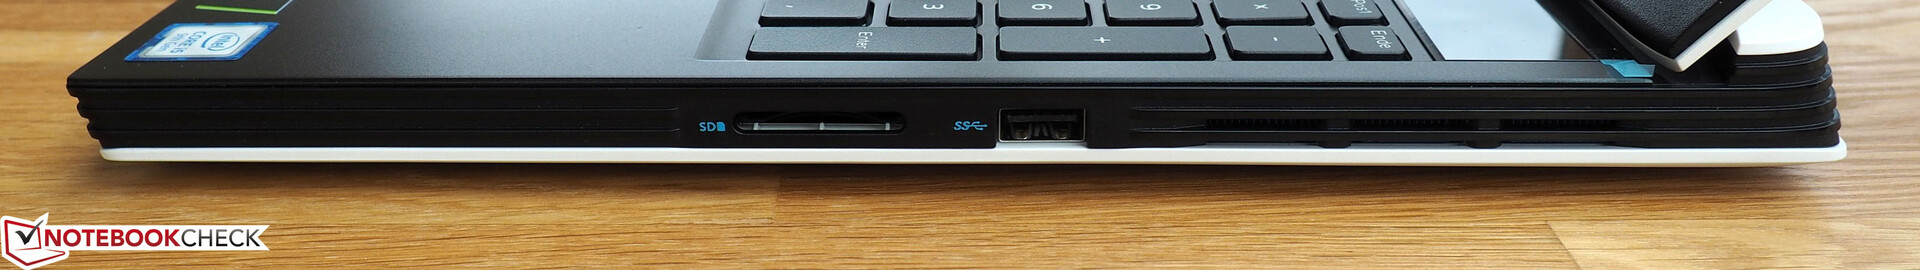
SD Card Reader
The SD card reader does not exactly offer first-class performance. 25-26 MB/s for sequential read and write speeds, respectively, when transferring pictures are only on USB 2.0 level and far below the transfer rates of the competition, which tend to at least come close to the speed of an external USB 3.0 hard drive.
| SD Card Reader | |
| average JPG Copy Test (av. of 3 runs) | |
| Average of class Gaming (19 - 202, n=98, last 2 years) | |
| HP Omen 15-dc1020ng (Toshiba Exceria Pro SDXC 64 GB UHS-II) | |
| HP Gaming Pavilion 15-dk0009ng (Toshiba Exceria Pro SDXC 64 GB UHS-II) | |
| Dell G5 15 5590-PCNJJ (Toshiba Exceria Pro SDXC 64 GB UHS-II) | |
| maximum AS SSD Seq Read Test (1GB) | |
| Average of class Gaming (25.8 - 269, n=92, last 2 years) | |
| HP Omen 15-dc1020ng (Toshiba Exceria Pro SDXC 64 GB UHS-II) | |
| HP Gaming Pavilion 15-dk0009ng (Toshiba Exceria Pro SDXC 64 GB UHS-II) | |
| Dell G5 15 5590-PCNJJ (Toshiba Exceria Pro SDXC 64 GB UHS-II) | |
Communication
We have no complaints in terms of Wi-Fi performance on the other hand. 676 Mb/s in our data transmission and 691 Mb/s in our data reception test (1 m between the device and our reference router Linksys EA8500) is a very good result that places the 15-inch device above many other laptops in our comparison. At least on our test device, Dell installs the popular Intel wireless AC module 9560.
Software
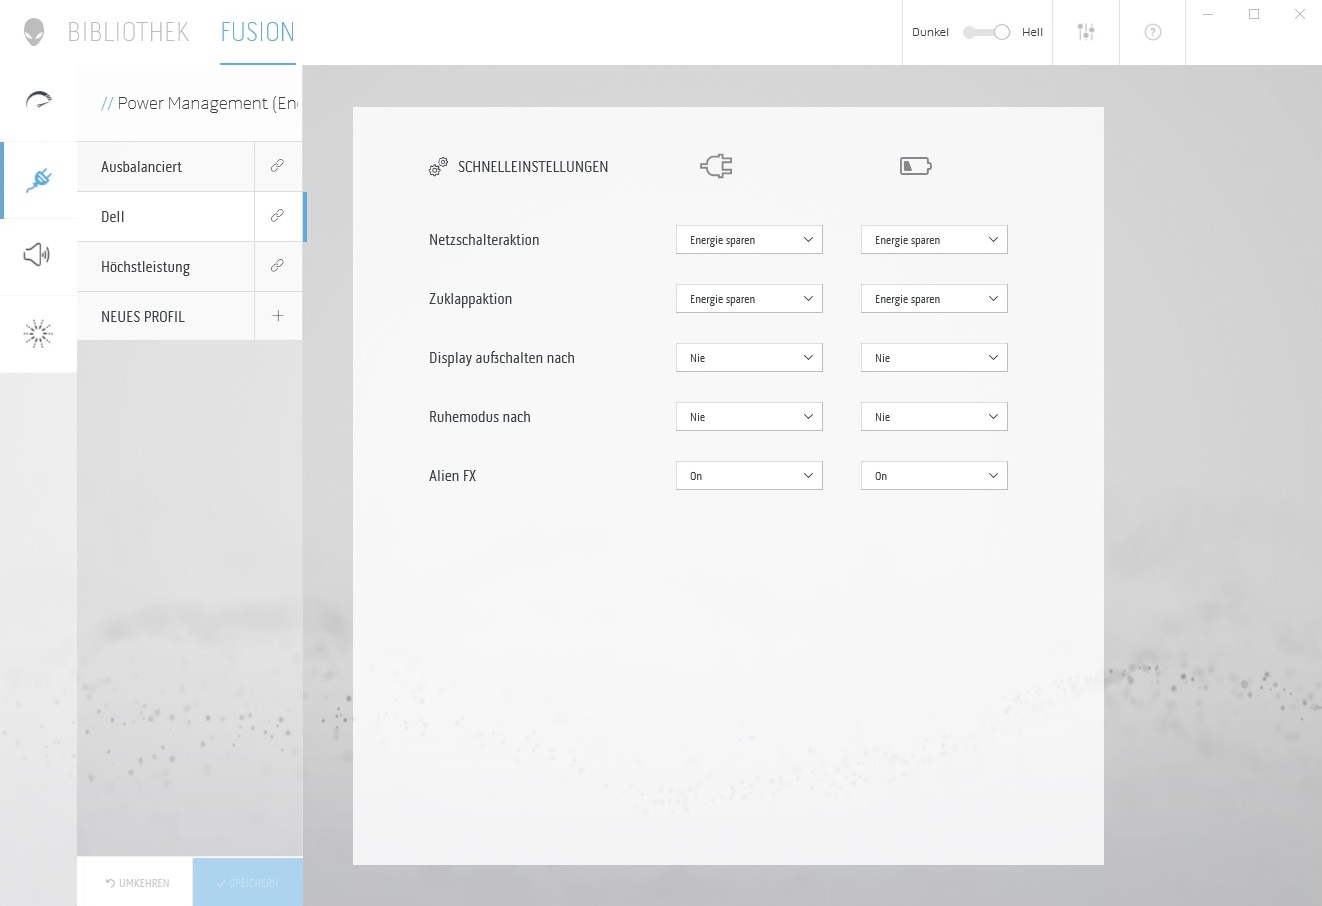
Compared to the Alienware counterpart, the command center software lacks several features. While the library tab takes care of any installed games, the Fusion tab allows for system monitoring, changing the power profile and adjusting the sound settings. All of our tests have been performed using the default factory settings.


Maintenance
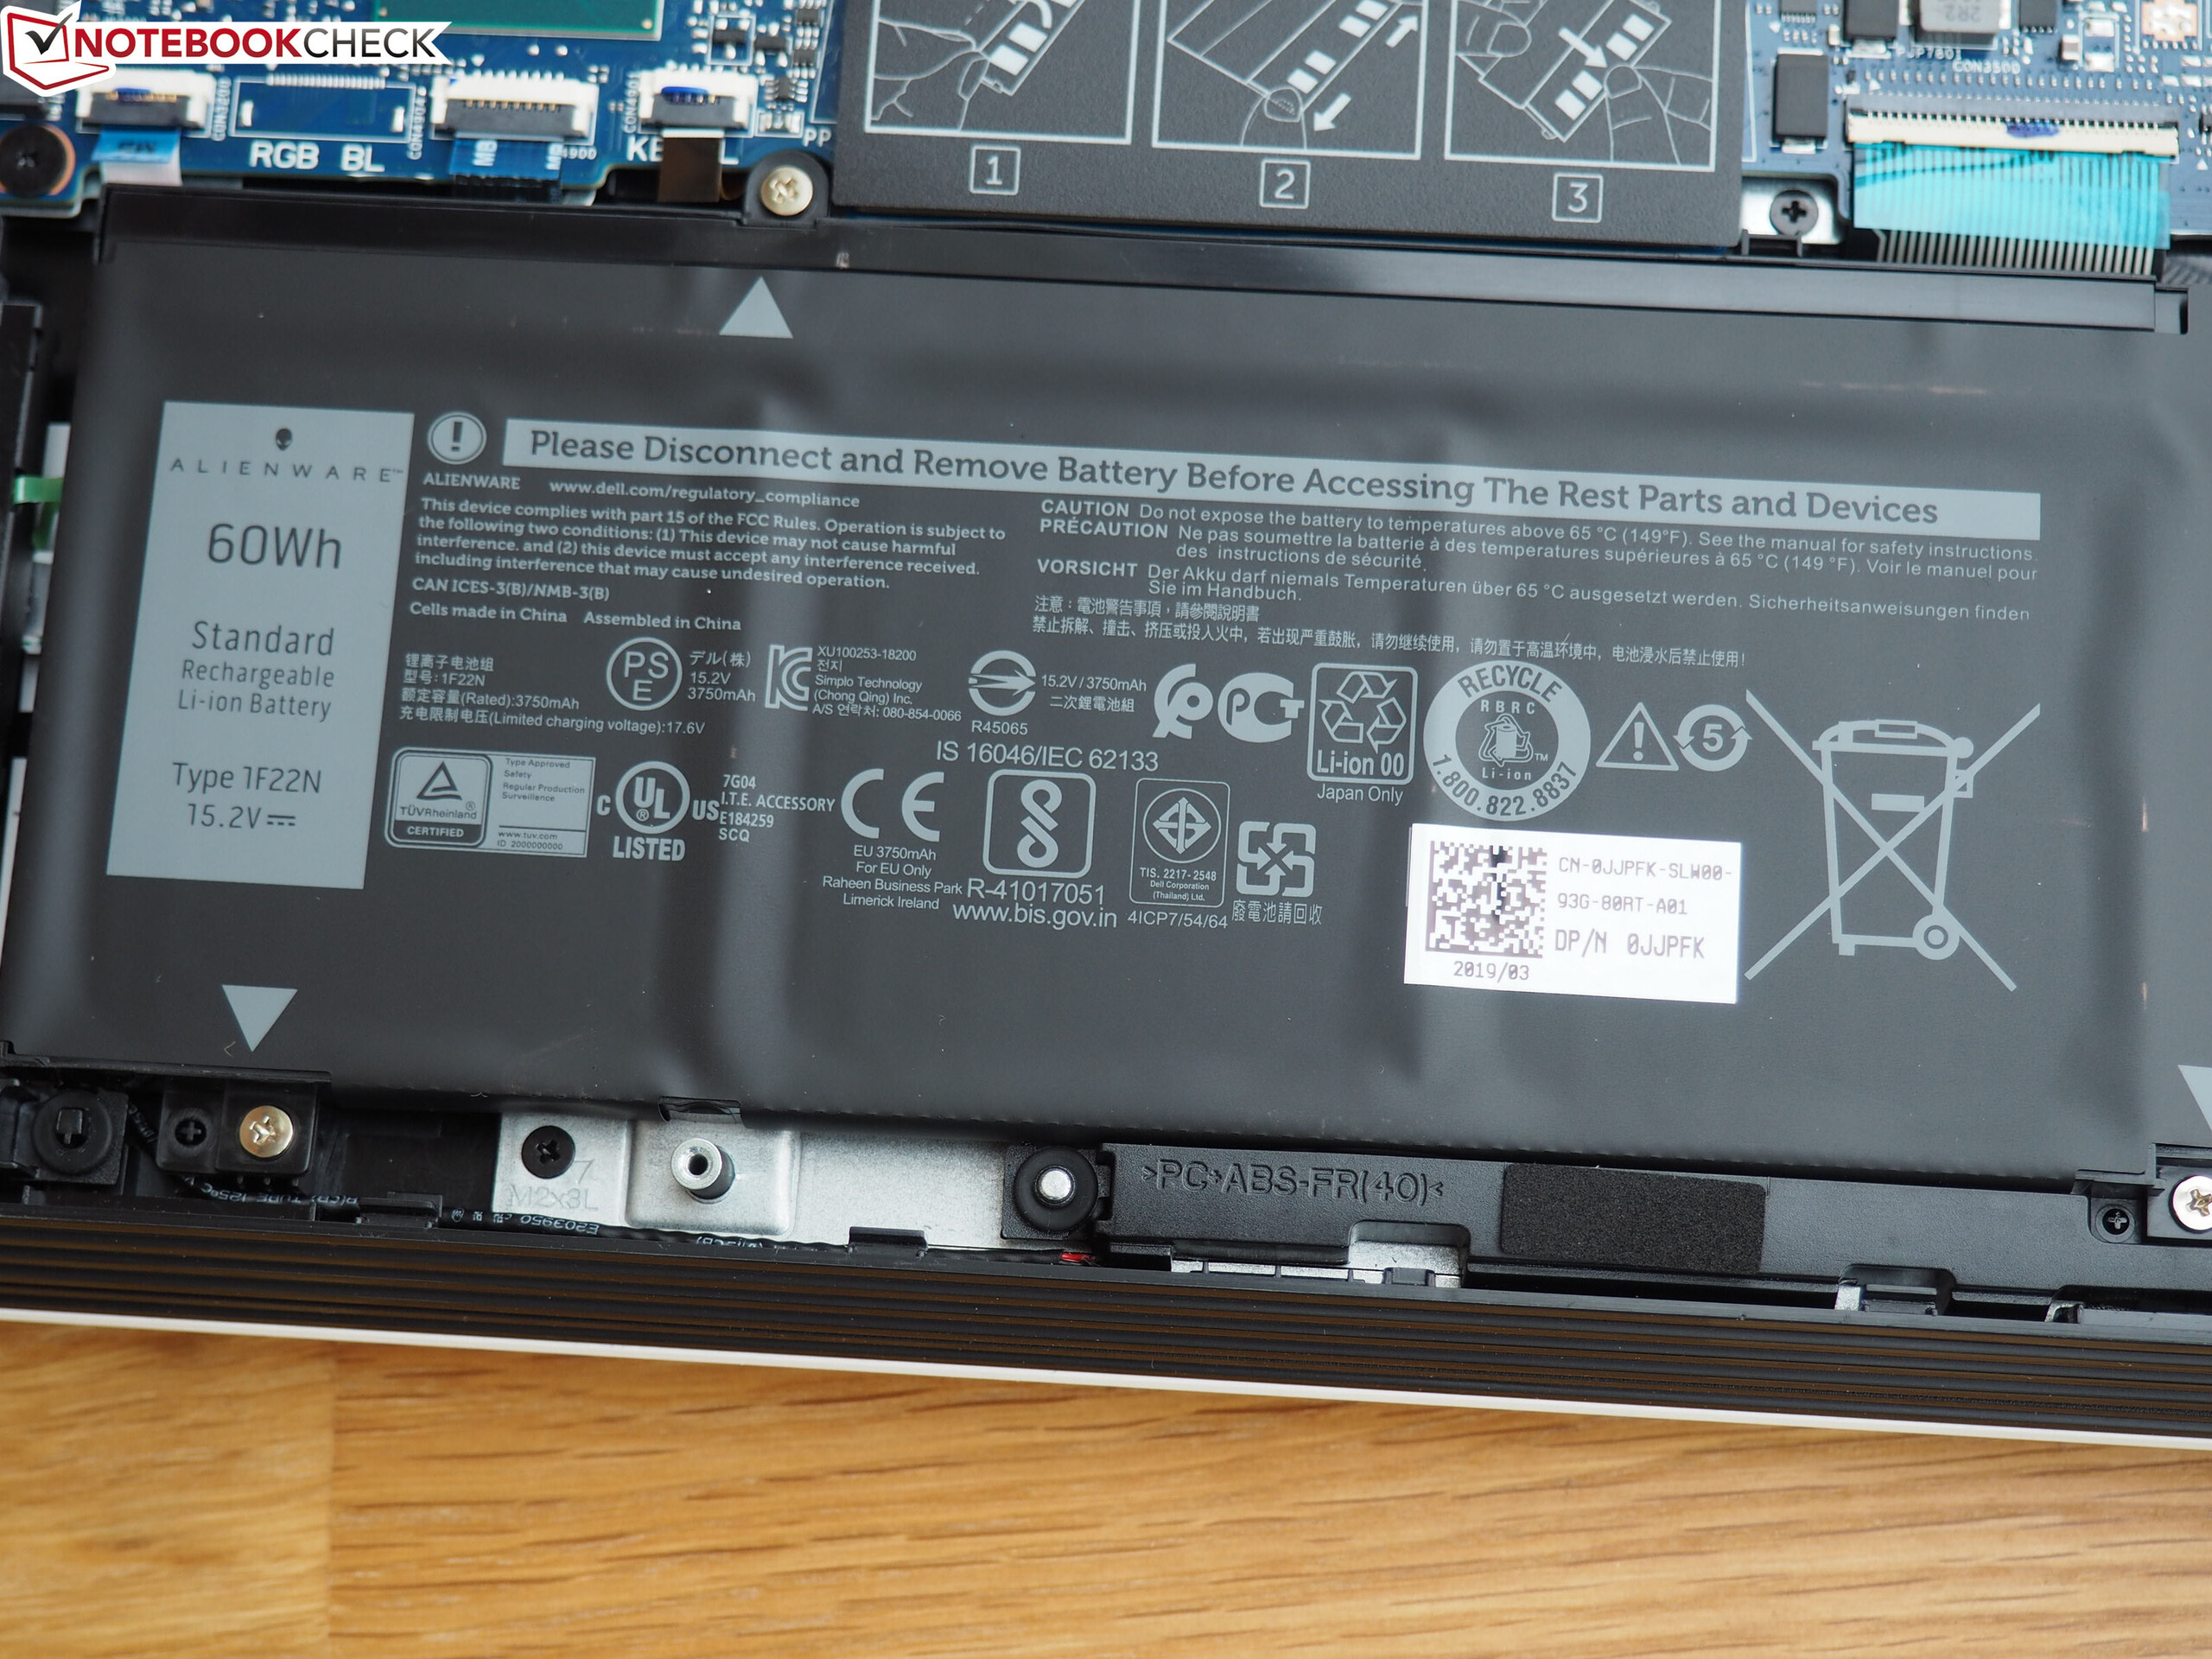
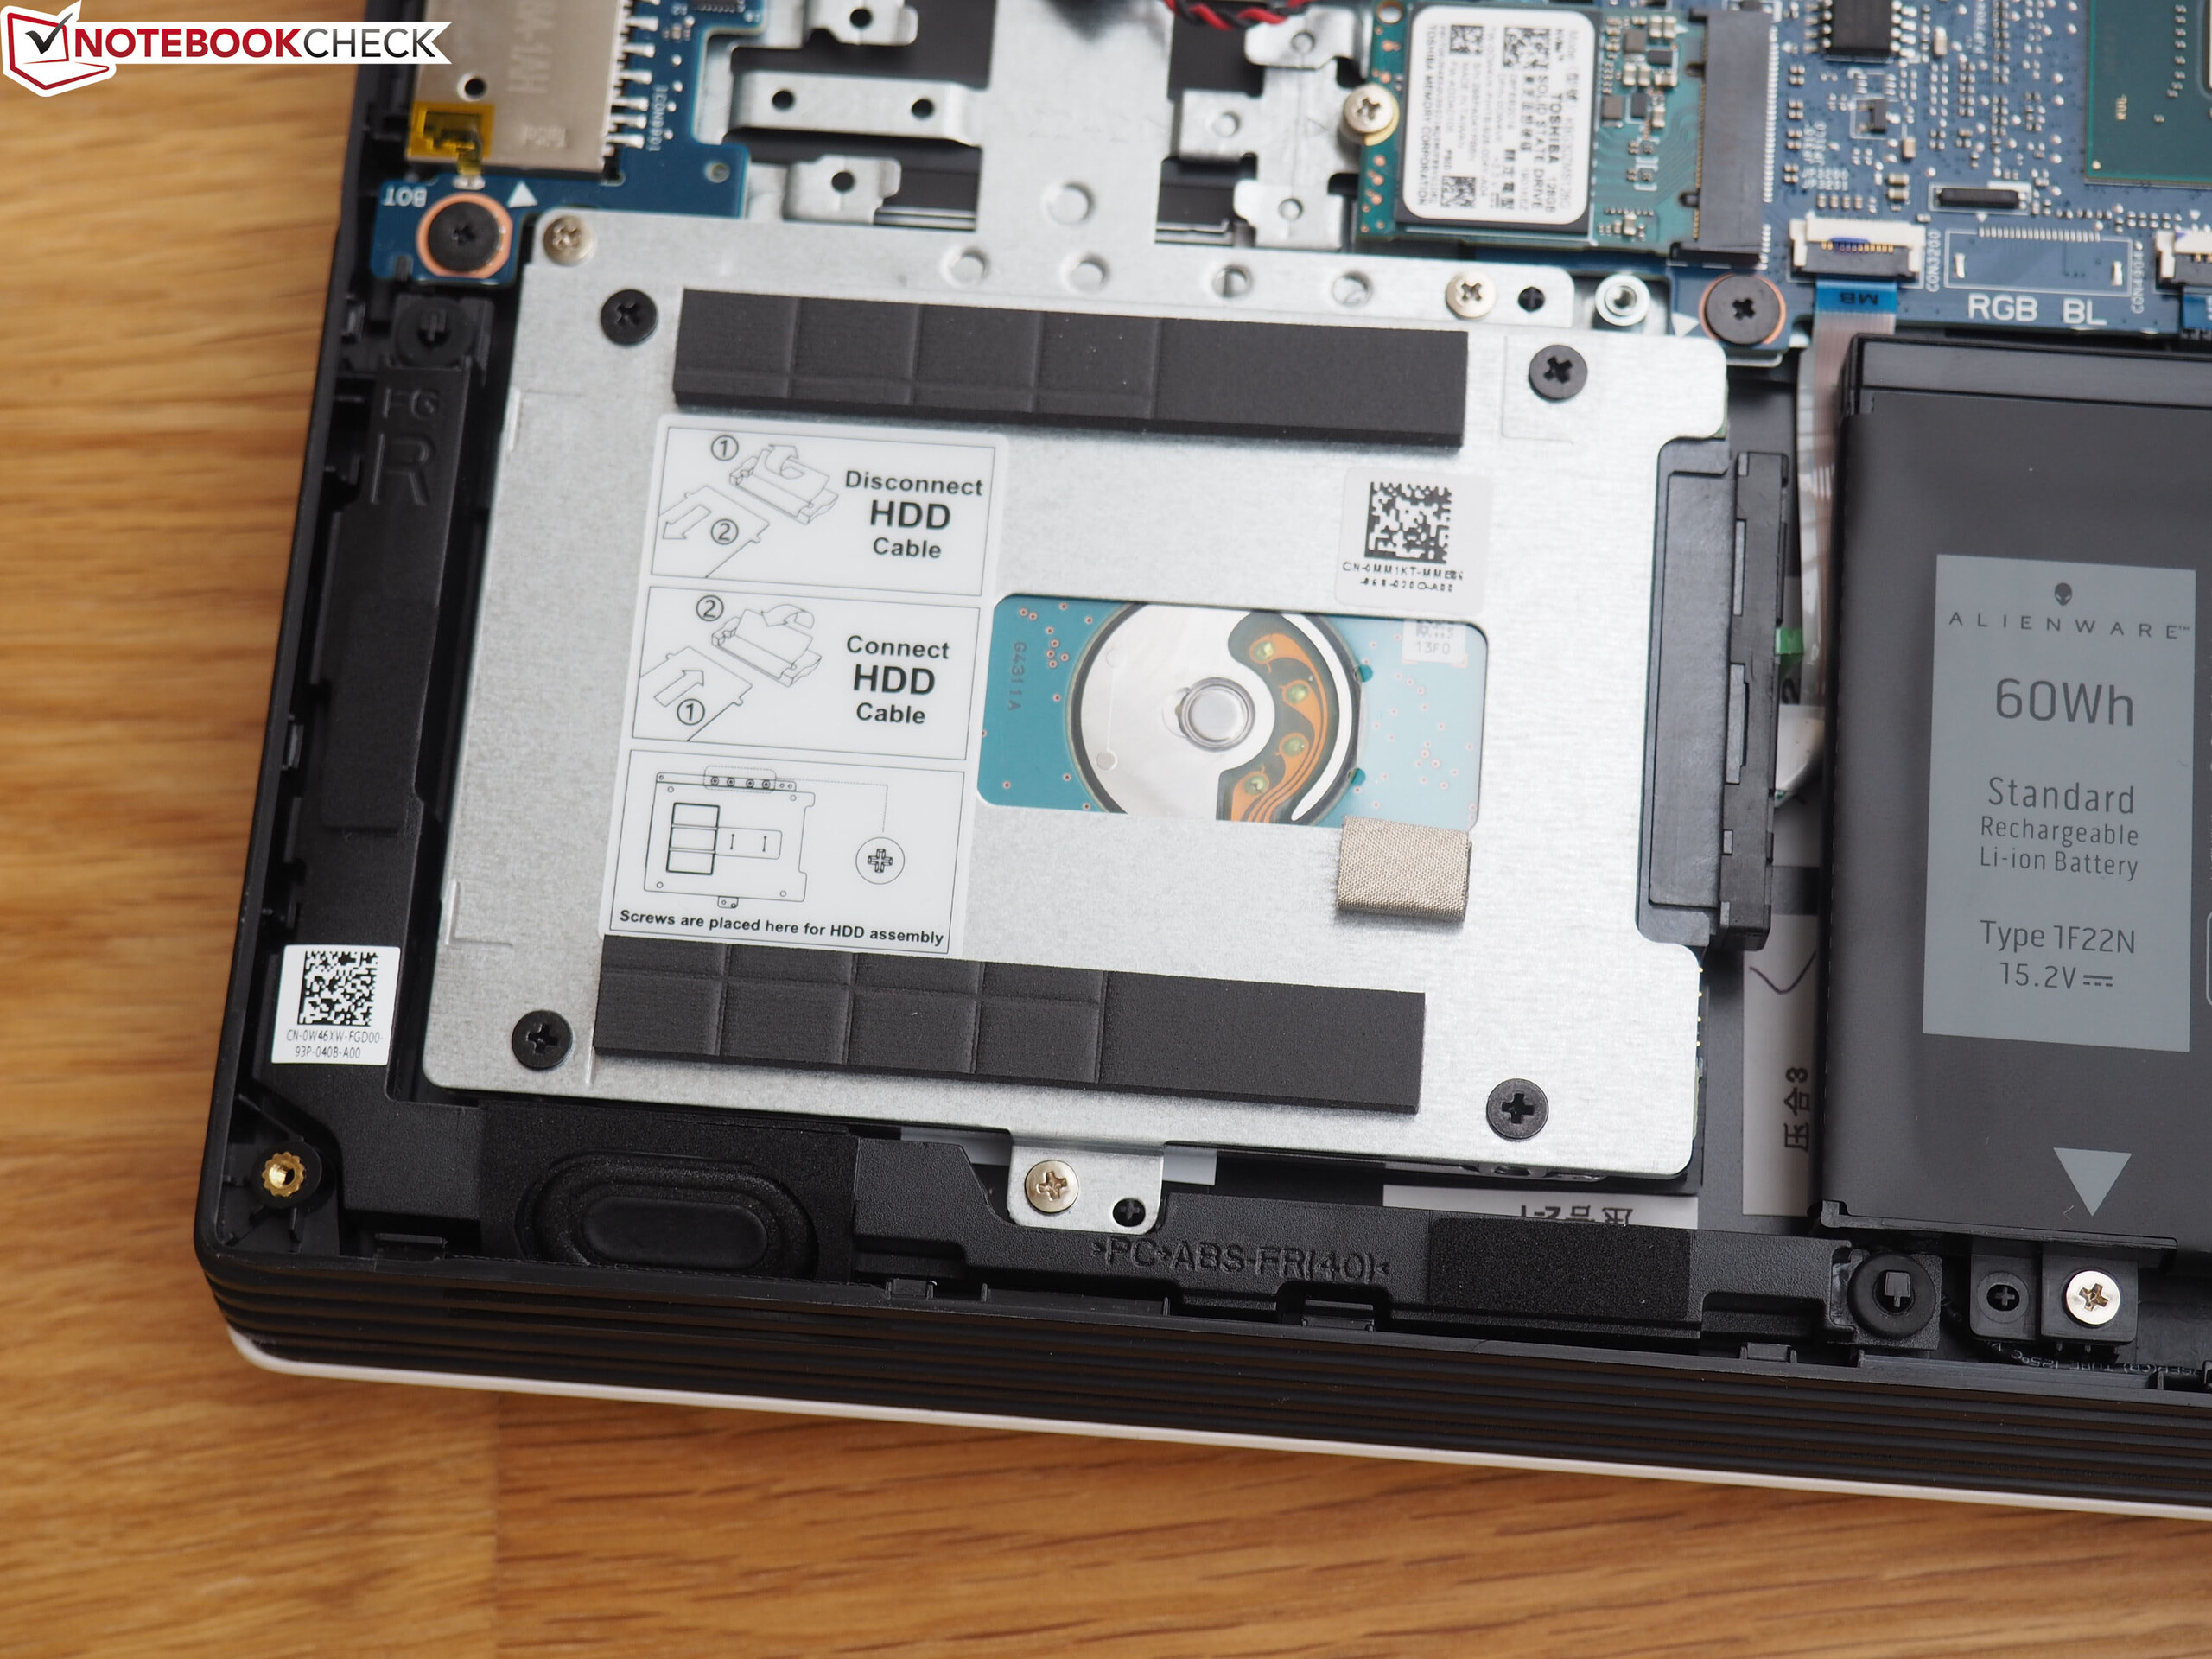
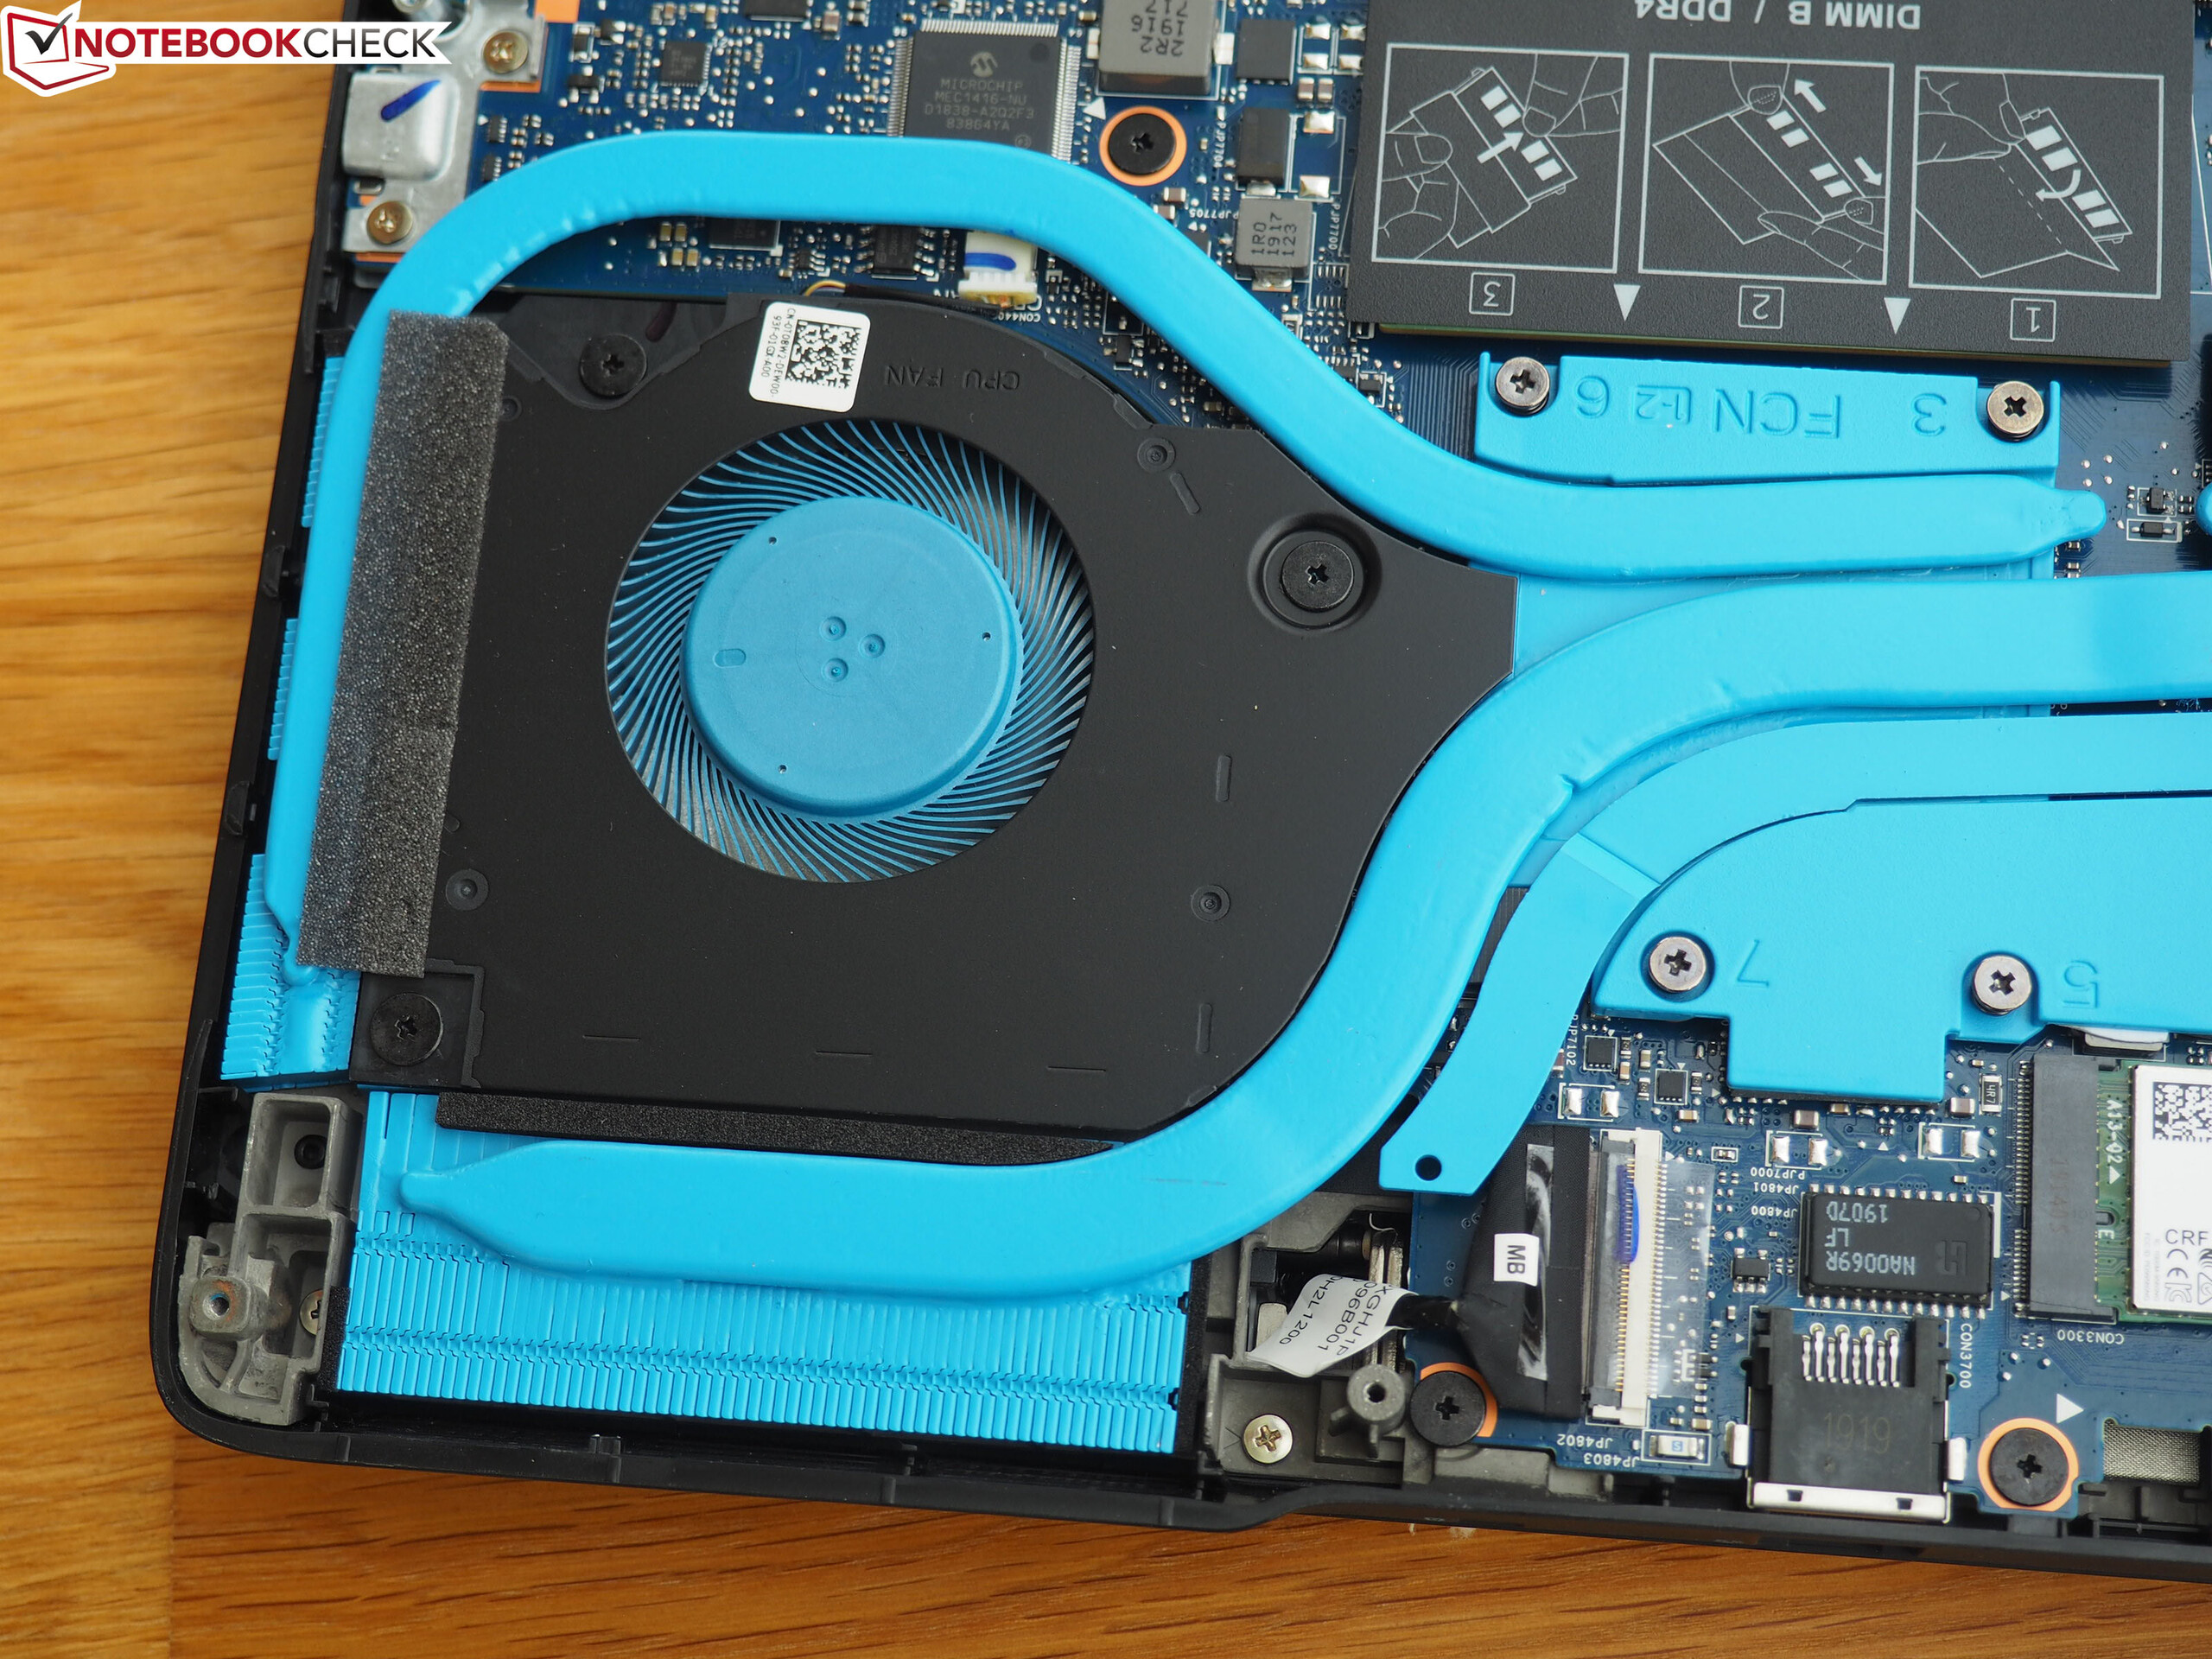
Maintenance on the G5 15 5590 is rather simple. While a convenient maintenance hatch is not available, removing the bottom panel (nine Philips screws + a couple of clips) is far from an impossible task and can be performed even by a layman. On the inside of the case, users have access to all of the important components. This includes the RAM slots, Wi-Fi module, battery, M.2 slot of the SSD and the 2.5-inch drive bay of the HDD. The cooling solution consists of two fans and numerous, light blue-colored heatpipes, which connect the soldered CPU and GPU.


Warranty
The warranty period of the "retail version" is only 12 months.
Input Devices
Keyboard
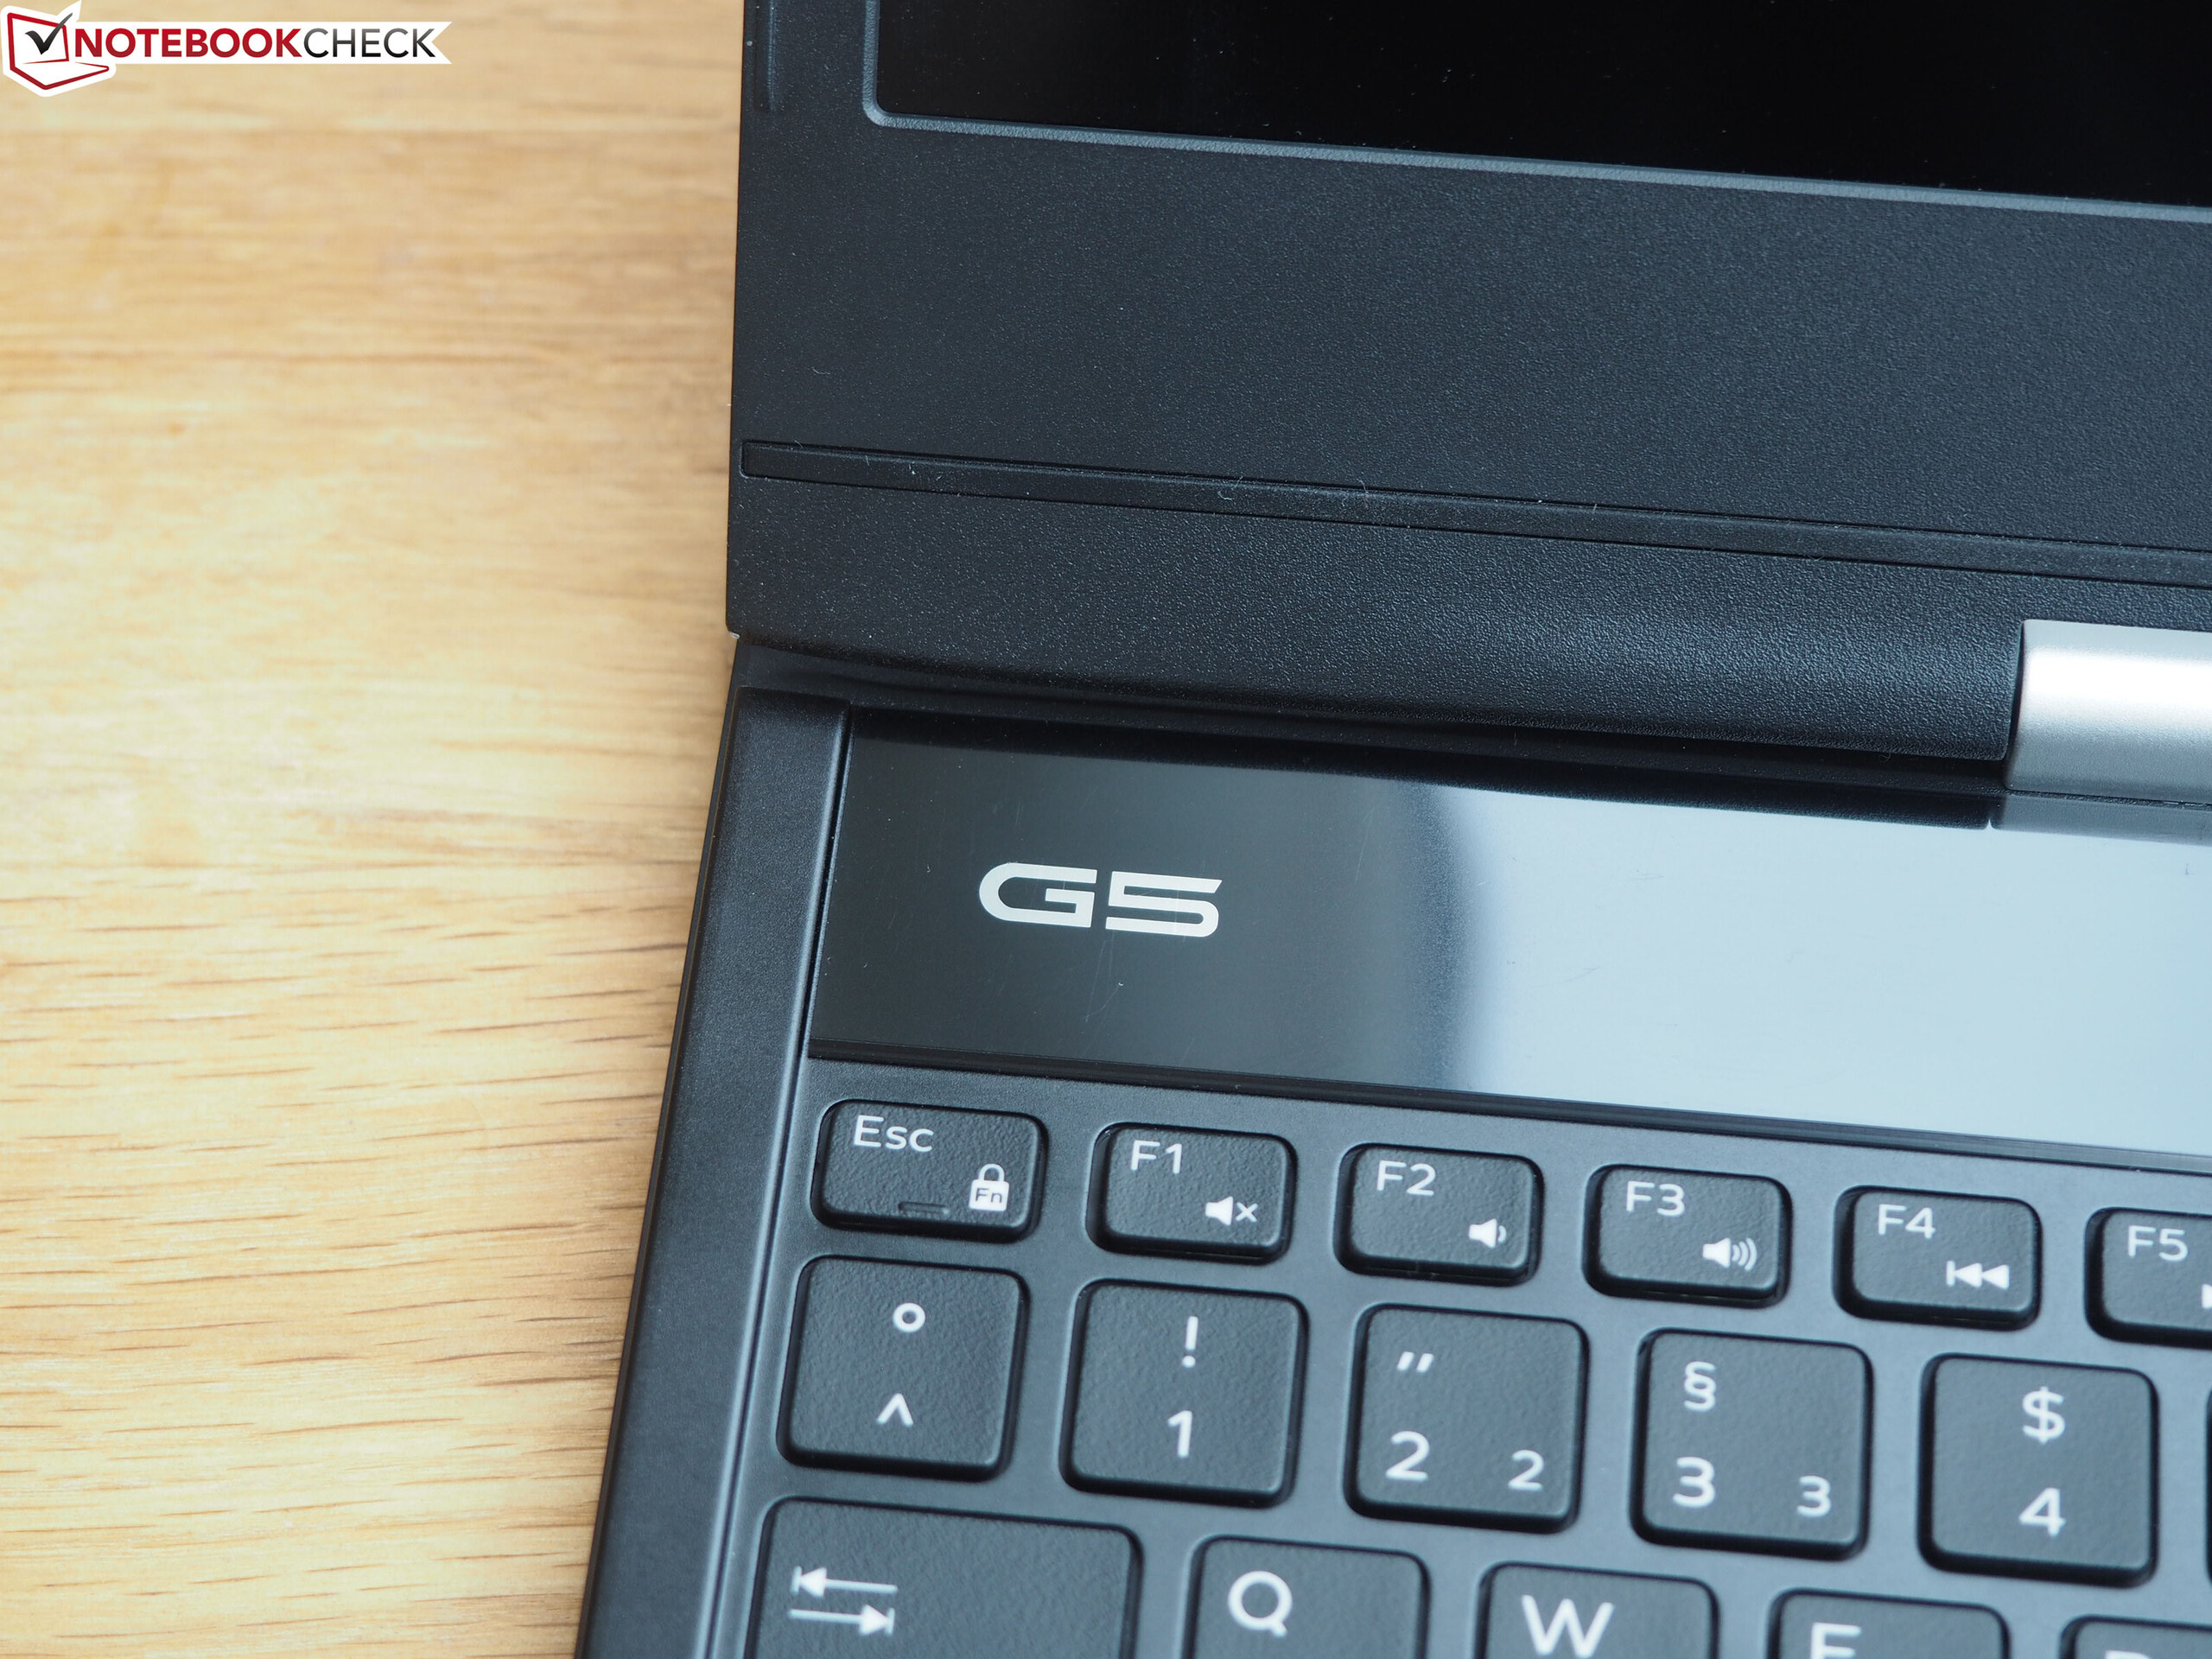
In the era of mechanical keyboards, this keyboard will struggle to impress anyone. Dell has chosen a classic chiclet model with relatively short travel that did moderately well in our test. Aside from the tiny arrow keys, the keys are decently sized despite the inclusion of a dedicated num pad. The typing experience is relatively crisp, however this also includes the audible feedback (the G5 is not necessarily the best choice for quiet environments).
As usual, numerous convenient shortcuts can be accessed by using the Fn key and the F-key row (volume, display brightness, media controls, wireless, etc.). Fancy RGB effects are not included. The G5 "only" comes with a white keyboard backlight, most likely to save on costs. The backlight has two levels.
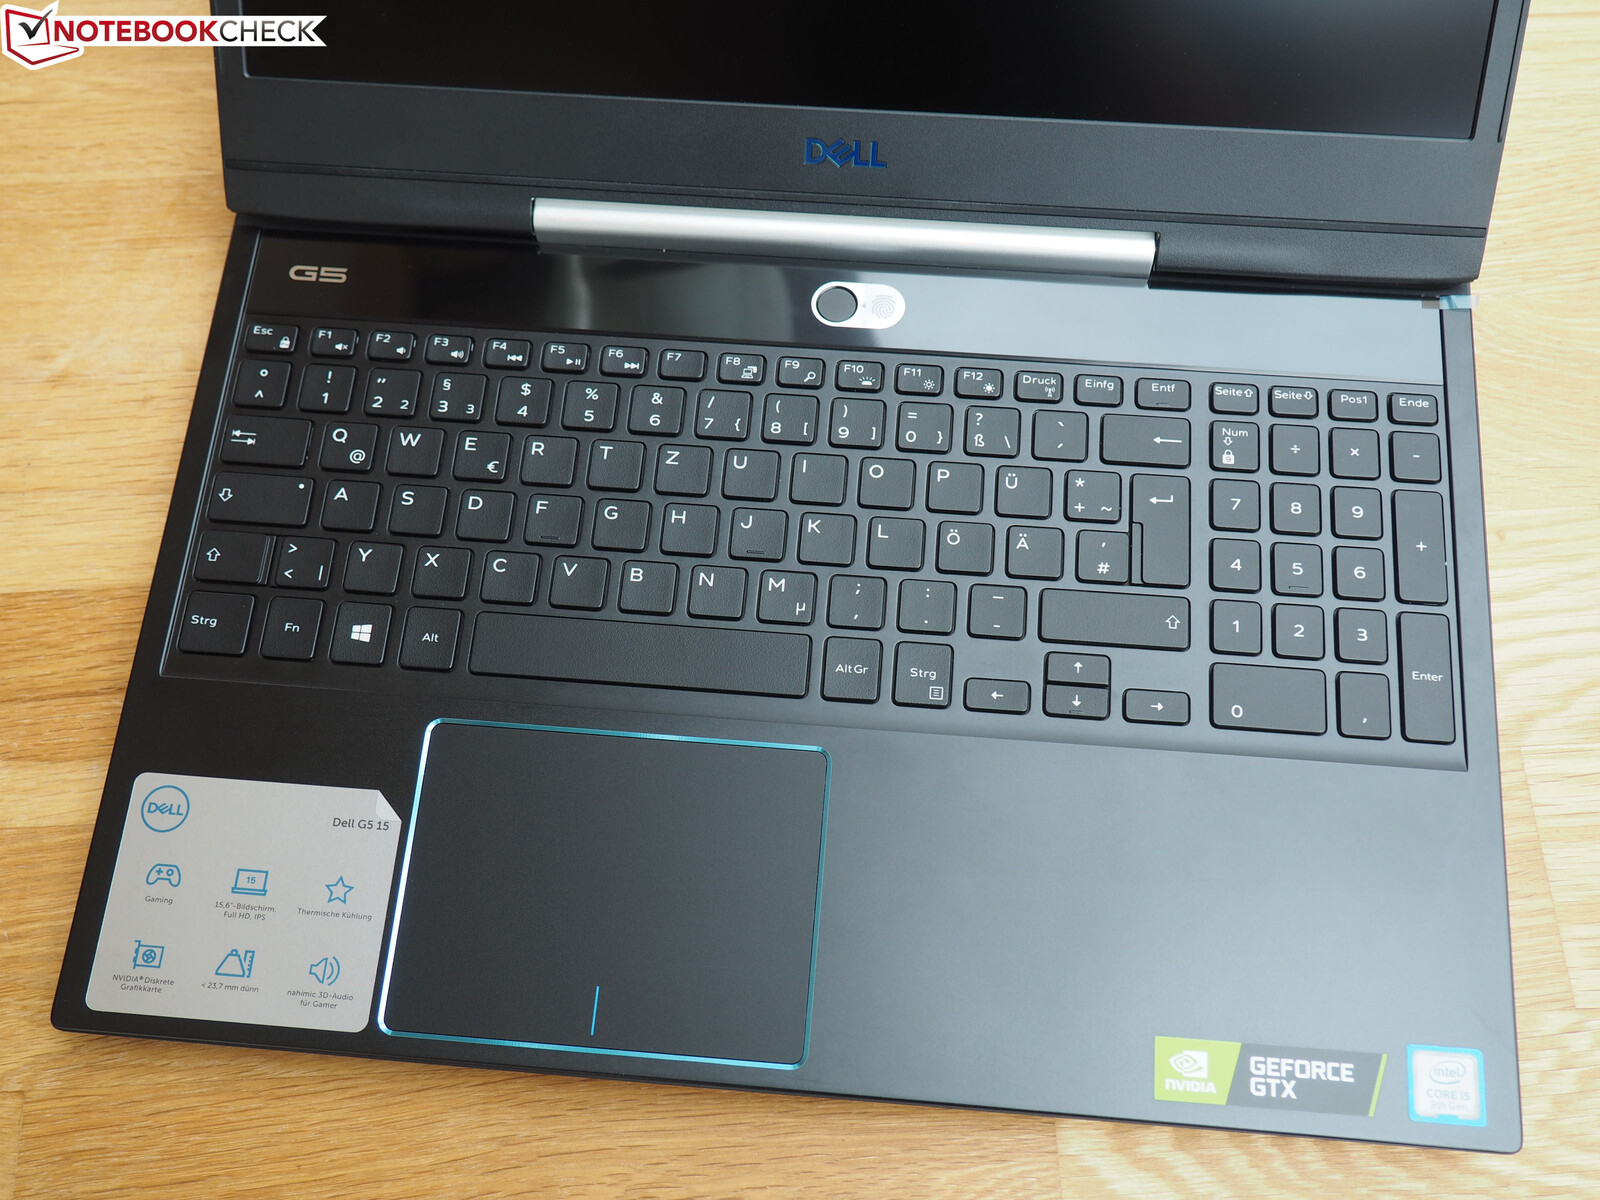

Touchpad
At 10.5 x 8 cm, the touchpad is fairly large for a 15-inch laptop. Whether the slightly roughened surface is to your liking is a matter of personal preference. While it gives the mouse substitute a good haptic feedback, the gliding properties suffer in return. There is also some room for improvement in terms of the precision. In our experience, the touchpad is not 100% reliable.
By contrast, we noticed nothing unusual in terms of gesture support (zooming in and scrolling with two fingers). The audible feedback of left and right clicks, on the other hand, is particularly noisy. Key clatter is fairly loud in spite of the otherwise solid construction.
Display
Since this is an entry-level version of the Dell G5, users cannot expect a high-end display. Apart from a good black value (0.22 cd/m²) and a good contrast ratio (1,064:1), the display properties of the Full HD panel are relatively disappointing.
| |||||||||||||||||||||||||
Brightness Distribution: 87 %
Center on Battery: 234 cd/m²
Contrast: 1064:1 (Black: 0.22 cd/m²)
ΔE Color 6.52 | 0.5-29.43 Ø5, calibrated: 3.56
ΔE Greyscale 5.33 | 0.57-98 Ø5.3
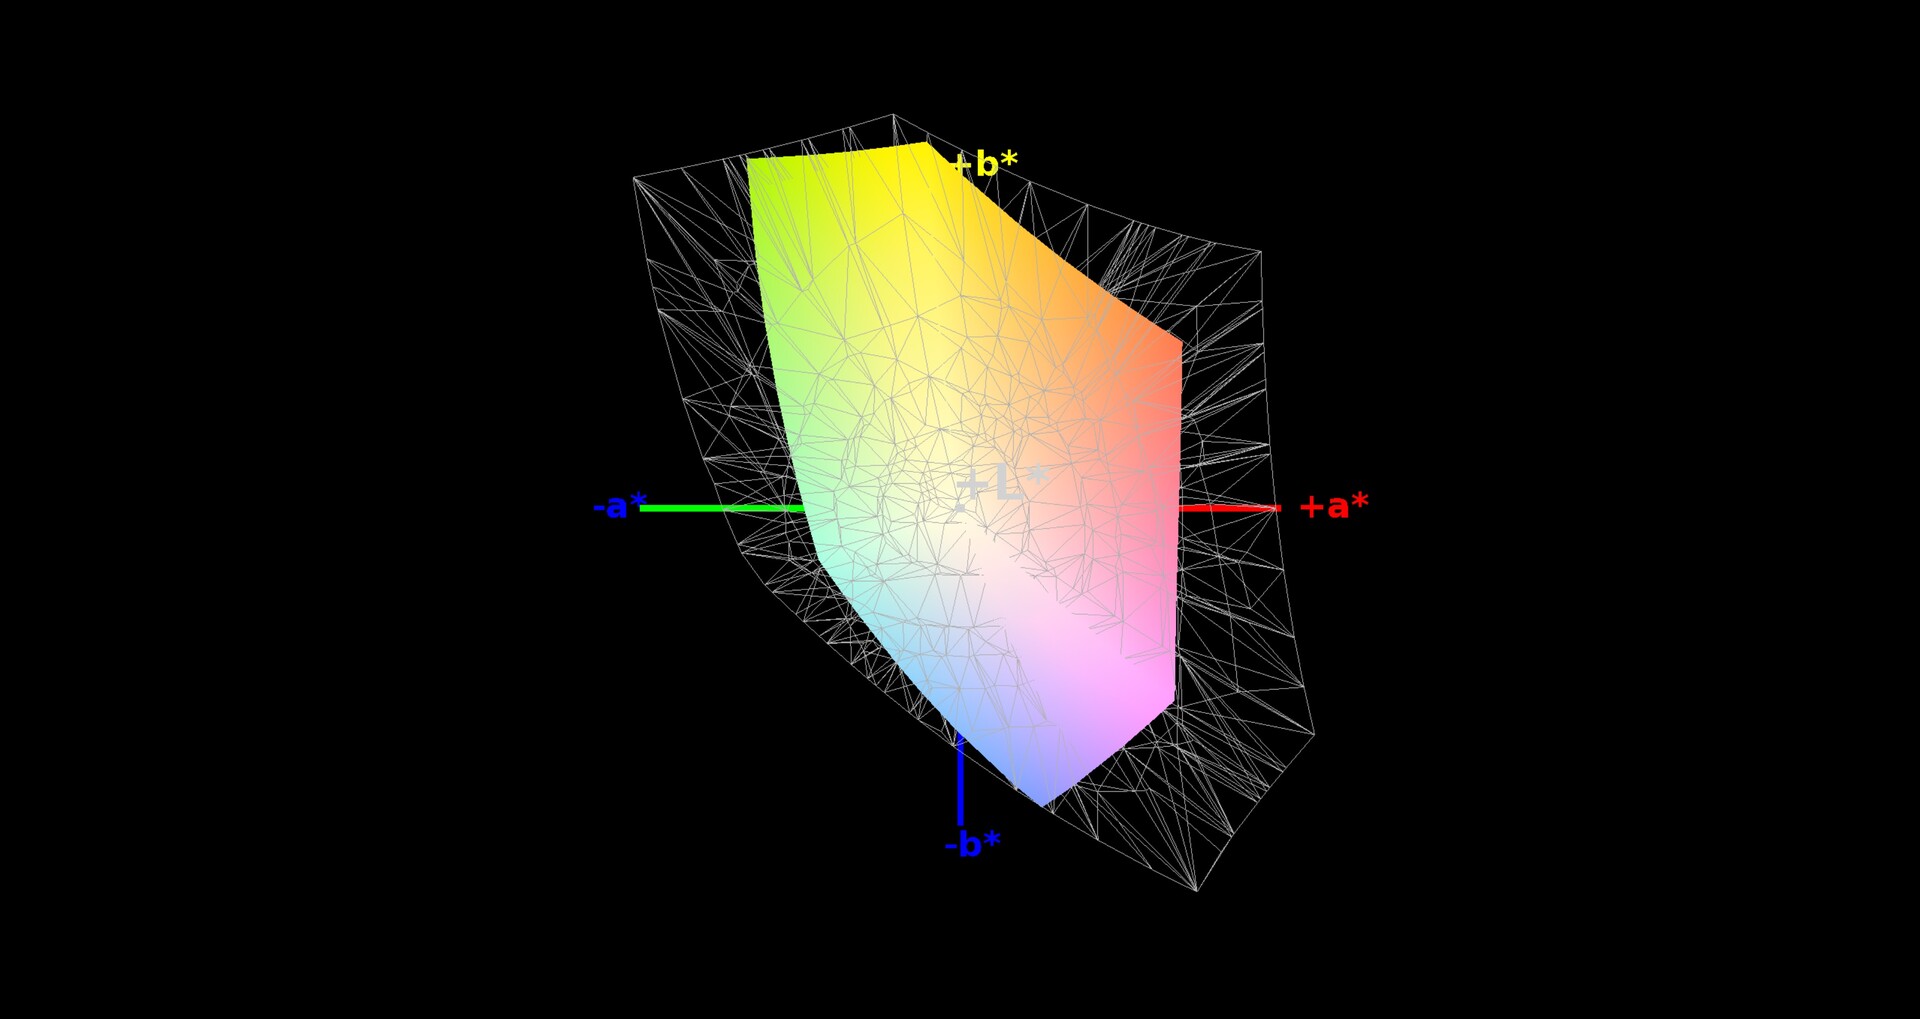
57% sRGB (Argyll 1.6.3 3D)
36% AdobeRGB 1998 (Argyll 1.6.3 3D)
96.8% AdobeRGB 1998 (Argyll 2.2.0 3D)
99.9% sRGB (Argyll 2.2.0 3D)
83.1% Display P3 (Argyll 2.2.0 3D)
Gamma: 2.86
| Dell G5 15 5590-PCNJJ AU Optronics B156HAN (AUO23ED), IPS, 1920x1080 | HP Omen 15-dc1020ng LGD05CE, IPS, 1920x1080 | Acer Aspire Nitro 5 AN515-54-53Z2 LG LP156WFC-SPD1 (LGD0563), IPS, 1920x1080 | HP Gaming Pavilion 15-dk0009ng LG Philips LGD05FE, IPS, 1920x1080 | Lenovo Legion Y540-15IRH-81SX00B2GE BOE 084D, IPS, 1920x1080 | |
|---|---|---|---|---|---|
| Display | -52% | -52% | -20% | -21% | |
| Display P3 Coverage | 83.1 | 38.37 -54% | 37.97 -54% | 64.2 -23% | 63.6 -23% |
| sRGB Coverage | 99.9 | 57.6 -42% | 57 -43% | 95.1 -5% | 91.7 -8% |
| AdobeRGB 1998 Coverage | 96.8 | 39.69 -59% | 39.23 -59% | 65.8 -32% | 65.2 -33% |
| Response Times | 9% | 12% | 66% | 71% | |
| Response Time Grey 50% / Grey 80% * | 48 ? | 40 ? 17% | 42 ? 12% | 16.4 ? 66% | 8.8 ? 82% |
| Response Time Black / White * | 30 ? | 29.6 ? 1% | 26.8 ? 11% | 10.4 ? 65% | 12 ? 60% |
| PWM Frequency | |||||
| Screen | -2% | 9% | 38% | 27% | |
| Brightness middle | 234 | 251 7% | 238 2% | 345 47% | 299 28% |
| Brightness | 216 | 232 7% | 226 5% | 324 50% | 290 34% |
| Brightness Distribution | 87 | 76 -13% | 83 -5% | 86 -1% | 89 2% |
| Black Level * | 0.22 | 0.17 23% | 0.27 -23% | 0.42 -91% | 0.29 -32% |
| Contrast | 1064 | 1476 39% | 881 -17% | 821 -23% | 1031 -3% |
| Colorchecker dE 2000 * | 6.52 | 6.2 5% | 4.11 37% | 1.3 80% | 3.7 43% |
| Colorchecker dE 2000 max. * | 10.58 | 18.6 -76% | 6.89 35% | 2.8 74% | 7 34% |
| Colorchecker dE 2000 calibrated * | 3.56 | 4.8 -35% | 3.76 -6% | 1.1 69% | 2 44% |
| Greyscale dE 2000 * | 5.33 | 4.2 21% | 1.78 67% | 1.2 77% | 4.1 23% |
| Gamma | 2.86 77% | 2.32 95% | 2.41 91% | 2.31 95% | 2.19 100% |
| CCT | 5983 109% | 7454 87% | 6311 103% | 6476 100% | 7166 91% |
| Color Space (Percent of AdobeRGB 1998) | 36 | 36.5 1% | 36 0% | 60.5 68% | 59.3 65% |
| Color Space (Percent of sRGB) | 57 | 57.4 1% | 57 0% | 94.9 66% | 91.5 61% |
| Total Average (Program / Settings) | -15% /
-10% | -10% /
-2% | 28% /
30% | 26% /
24% |
* ... smaller is better
The luminosity of only 216 cd/m² on average is poor. While several competitors also fail to achieve significantly better results in this discipline, at least 250 cd/m² should be a given even on a budget laptop.
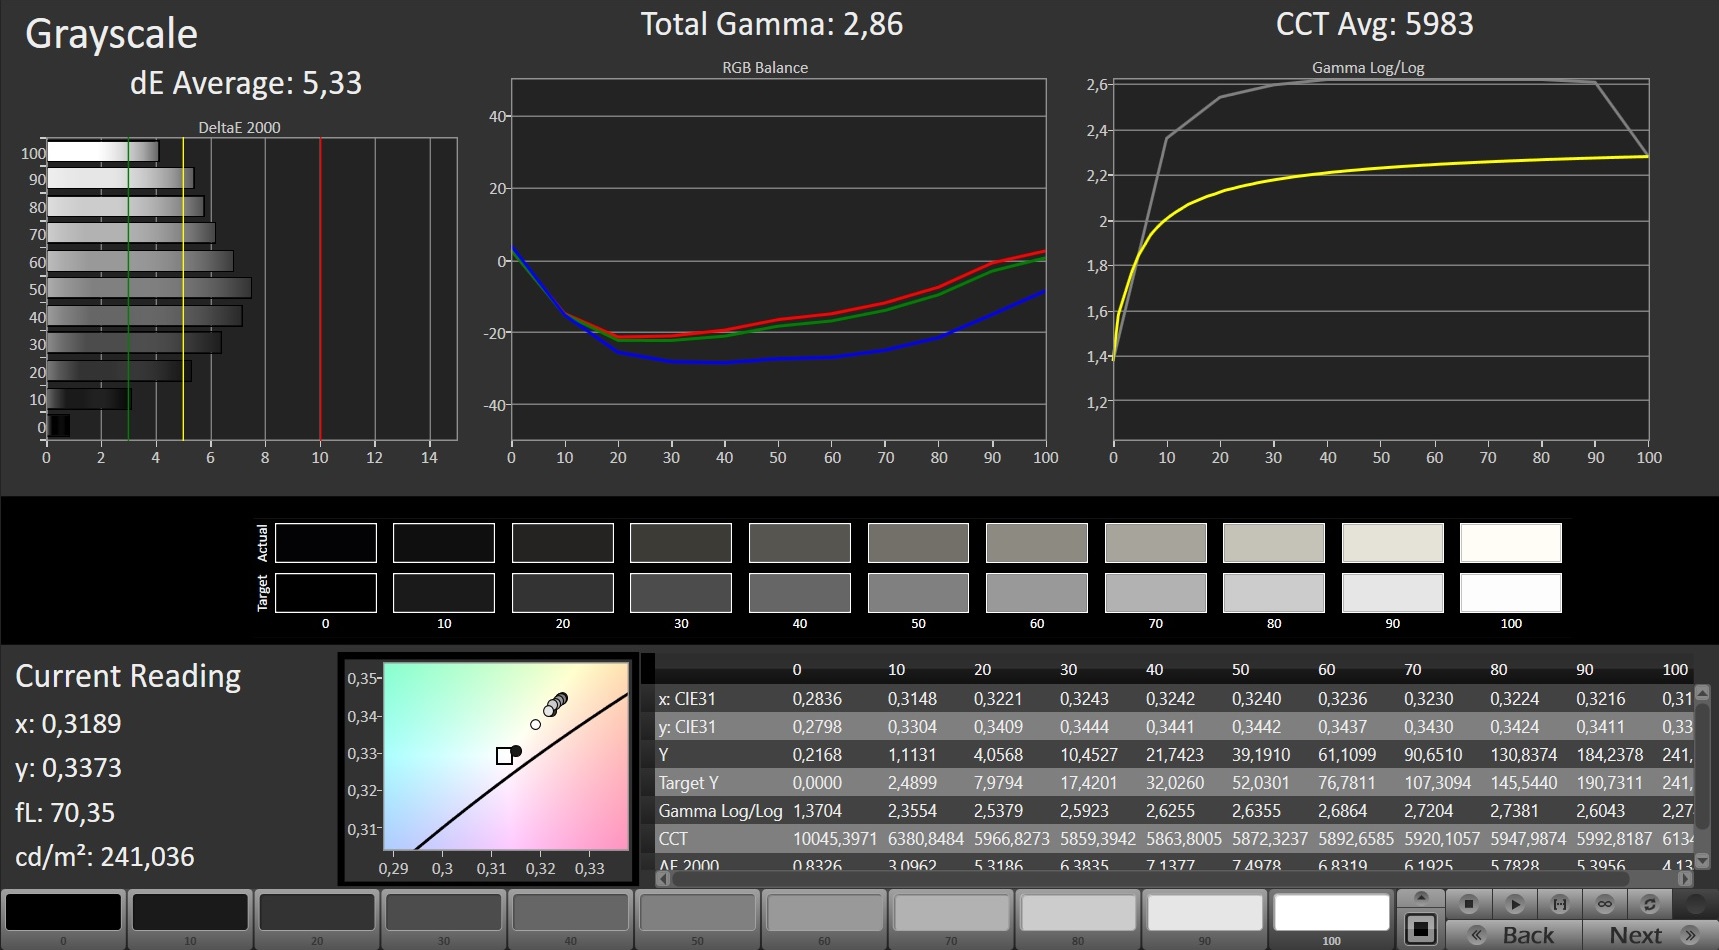


The narrow color space is another weak spot of the display. 57% of the sRGB color space and 36% of the AdobeRGB standard translates to a pale image. Unsurprisingly, the 15-inch laptop does not achieve a convincing result when it comes to color accuracy either. Luckily, our calibration addresses this directly and fixes the shortcomings (our ICC file is linked above, next to the image for distribution of brightness).

The installed 60-Hz display was not really made for very fast-paced games such as first-person shooters. 30 ms black-to-white and 48 ms gray-to-gray hints at ghosting. At least the display did not exhibit flickering (caused by PWM) during our test.


Display Response Times
| ↔ Response Time Black to White | ||
|---|---|---|
| 30 ms ... rise ↗ and fall ↘ combined | ↗ 16.8 ms rise |  |
| ↘ 13.2 ms fall | ||
| The screen shows slow response rates in our tests and will be unsatisfactory for gamers. In comparison, all tested devices range from 0.1 (minimum) to 240 (maximum) ms. » 77 % of all devices are better. This means that the measured response time is worse than the average of all tested devices (21.5 ms). | ||
| ↔ Response Time 50% Grey to 80% Grey | ||
| 48 ms ... rise ↗ and fall ↘ combined | ↗ 22.8 ms rise |  |
| ↘ 25.2 ms fall | ||
| The screen shows slow response rates in our tests and will be unsatisfactory for gamers. In comparison, all tested devices range from 0.2 (minimum) to 636 (maximum) ms. » 80 % of all devices are better. This means that the measured response time is worse than the average of all tested devices (33.7 ms). | ||
Screen Flickering / PWM (Pulse-Width Modulation)
| Screen flickering / PWM not detected |  | ||
In comparison: 53 % of all tested devices do not use PWM to dim the display. If PWM was detected, an average of 17844 (minimum: 5 - maximum: 3846000) Hz was measured. | |||
Performance
The inclusion of the Core i5-9300H, GeForce GTX 1650, and 8 GB of RAM position the G5 15 5590 as a mid-range device that tries to appeal to casual gamers. Since the storage solution and RAM can be swapped, larger/faster drives and more RAM can be installed without too much effort.


Processor
The Core i5-9300H is a four-core model from Intel's latest Coffee Lake generation. The 14-nm chip is rated for a TDP of 45 watts and is able to process up to eight threads simultaneously thanks to Hyper-Threading. While it has a base clock of 2.4 GHz, Turbo Boost allows for much higher clock speeds.

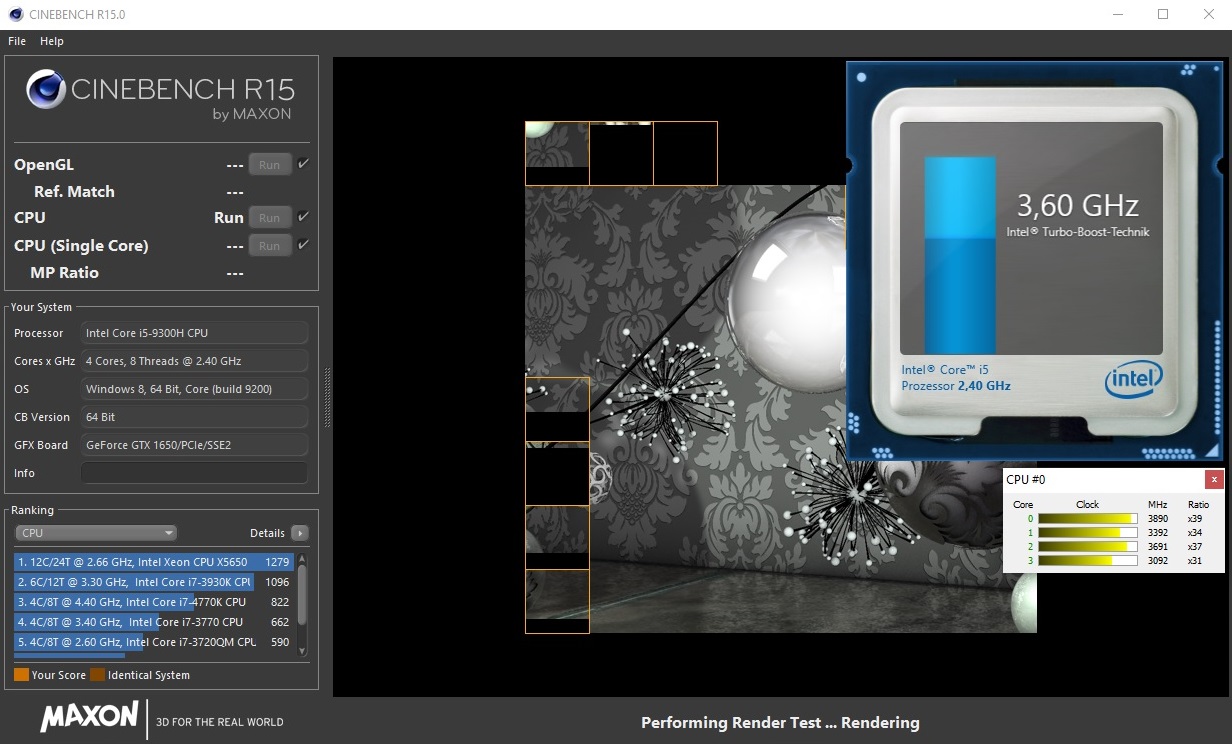
One of the biggest weaknesses of the G5 is the CPU's clock speed behavior. Whereas the 9300H achieves a fairly good Turbo Boost performance under pure CPU load (see Cinebench loop), reaching 3.1 to 4.1 GHz, the processor tends to throttle when simultaneous GPU stress comes into play.
In many of the 3D applications we tested, the individual cores throttle down to a mere 900 MHz, which - particularly on a gaming laptop - is not supposed to happen and makes us question Dell's quality control.
System Performance
The system performance of the G5 15 5590-PCNJJ ranks below those of its competitors. With only 4,615 points, it comes in last among the devices in our comparison. Subjectively, the system also feels slower than many other gaming laptops. The main problem is the sluggish SSD, as we will see in a moment. Due to this, both the boot process and installations require more patience than usual.
Storage Solution
The operating system (Windows 10 Home 64-bit) runs on a 128 GB M.2 SSD. Surprisingly, Dell has not opted for a 2280 module and instead uses an extremely short 2230 model, the Toshiba KBG30ZMS128G. While its read speeds are on par with other SSDs, the write speeds leave much to be desired. Sequential write speeds of 133 MB/s (according CrystalDiskMark) are closer to those of an HDD than a solid state drive and this will negatively impact your experience in many cases.


Dell may want to upgrade to a faster model, in order to be able to keep up with the competition. The fact that the installed 1 TB HDD (Toshiba MQ04ABF100) achieves better results in some benchmarks further illustrates this point.
| Dell G5 15 5590-PCNJJ KBG30ZMS128G | HP Omen 15-dc1020ng WDC PC SN720 SDAQNTW-512G | Acer Aspire Nitro 5 AN515-54-53Z2 WDC PC SN520 SDAPNUW-512G | HP Gaming Pavilion 15-dk0009ng Samsung SSD PM981 MZVLB256HAHQ | Lenovo Legion Y540-15IRH-81SX00B2GE WDC PC SN720 SDAPNTW-512G | |
|---|---|---|---|---|---|
| CrystalDiskMark 5.2 / 6 | 502% | 314% | 316% | 489% | |
| Write 4K | 65.3 | 112.1 72% | 109.1 67% | 100 53% | 158.8 143% |
| Read 4K | 29.71 | 42.01 41% | 42.05 42% | 31.39 6% | 29.11 -2% |
| Write Seq | 128.8 | 1964 1425% | 1457 1031% | 1308 916% | 1584 1130% |
| Read Seq | 859 | 2065 140% | 1421 65% | 1083 26% | 1694 97% |
| Write 4K Q32T1 | 95.8 | 318.2 232% | 287.8 200% | 362.9 279% | 536 459% |
| Read 4K Q32T1 | 197.6 | 406.7 106% | 317.9 61% | 425.7 115% | 363.9 84% |
| Write Seq Q32T1 | 132.5 | 2534 1812% | 1455 998% | 1411 965% | 2536 1814% |
| Read Seq Q32T1 | 1208 | 3438 185% | 1739 44% | 3240 168% | 3458 186% |

GPU Performance
The mid-range GPU GeForce GTX 1650 Nvidia released earlier this year offers a good price/performance ratio - at least within the realm of laptop GPUs.
| 3DMark 11 Performance | 11926 points | |
| 3DMark Ice Storm Standard Score | 96370 points | |
| 3DMark Cloud Gate Standard Score | 25549 points | |
| 3DMark Fire Strike Score | 8059 points | |
| 3DMark Time Spy Score | 3616 points | |
Help | ||
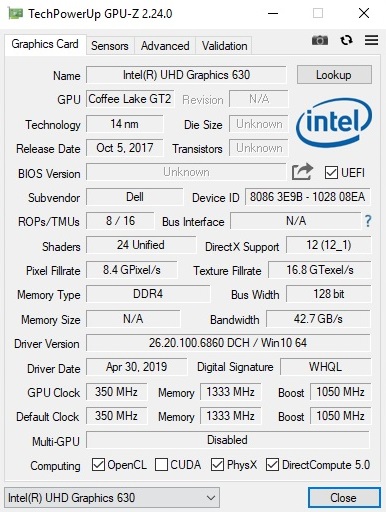
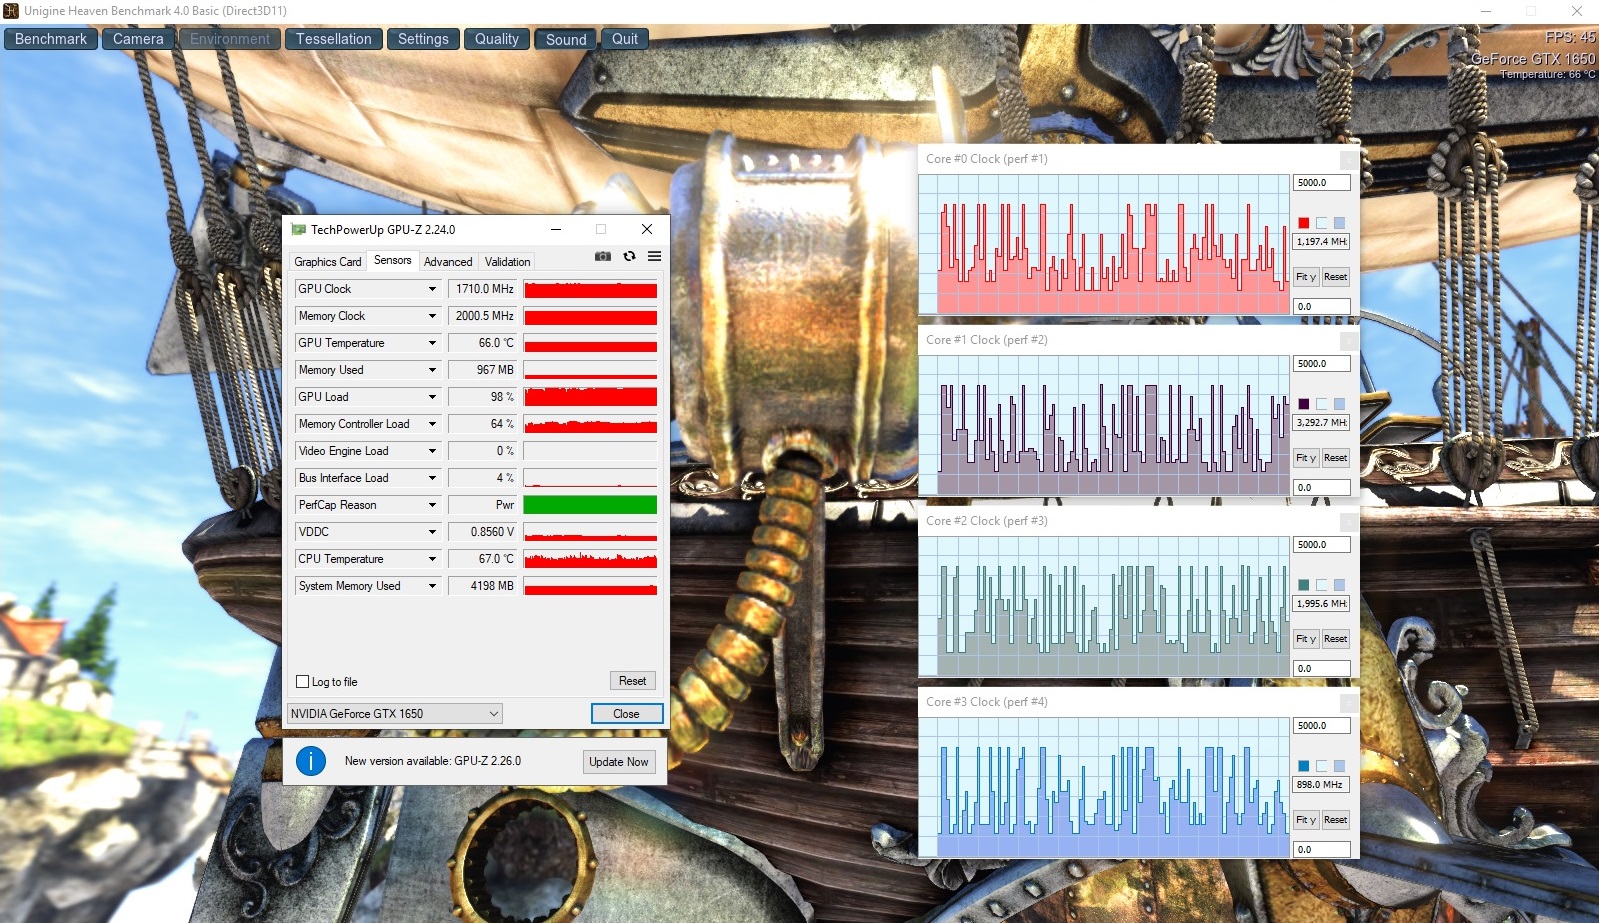
The DirectX 12-capable 12-nm chip from Nvidia's Turing generation houses 1,024 shader units and has access to 4 GB of GDDR5 memory (128-bit interface). Thanks to GPU Boost overclocking, which is applied automatically and works similarly to Intel's Turbo Boost, the base clock of 1,395 MHz is regularly exceeded by a significant margin during gaming. In our The Witcher 3 test, we recorded around 1,635 MHz. Almost 1,710 MHz in Unigine's Heaven 4.0 benchmark is similarly impressive. During the GPU-Z render test, the clock rate even climbed up to 1,905 MHz.
In terms of the 3DMark 11 and 3DMark 13 results, the Dell G5's GPU performance falls into a similar category as the competition. In our long-term test of The Witcher 3 (around one hour at maximum settings and 1920x1080 pixels), there were no sudden spikes or drops in performance, which hints at an adequate cooling solution, at least from the GPU side of things.
Gaming Performance
As discussed earlier, the GTX 1650 is an ideal companion for casual gamers and price-conscious users. As long as the chosen game is not extremely demanding or poorly programmed/optimized (such as, for example, Metro Exodus), high settings are possible in most cases and at the native resolution of 1920x1080 pixels, although 60 FPS+ is not always guaranteed.
| The Witcher 3 | |
| 1920x1080 High Graphics & Postprocessing (Nvidia HairWorks Off) | |
| Average of class Gaming (17.5 - 449, n=163, last 2 years) | |
| HP Gaming Pavilion 15-dk0009ng | |
| HP Omen 15-dc1020ng | |
| Acer Aspire Nitro 5 AN515-54-53Z2 | |
| Dell G5 15 5590-PCNJJ | |
| 1920x1080 Ultra Graphics & Postprocessing (HBAO+) | |
| Average of class Gaming (8.61 - 216, n=223, last 2 years) | |
| HP Gaming Pavilion 15-dk0009ng | |
| Lenovo Legion Y540-15IRH-81SX00B2GE | |
| HP Omen 15-dc1020ng | |
| Acer Aspire Nitro 5 AN515-54-53Z2 | |
| Dell G5 15 5590-PCNJJ | |
In order to achieve particularly smooth gameplay, the settings have to be dialed back to medium or low. As the table conveniently shows, GTX 1660 Ti-based laptops offer around 50% more performance and require proportionally fewer compromises in terms of quality.
| low | med. | high | ultra | |
| BioShock Infinite (2013) | 266 | 230 | 209 | 86.1 |
| The Witcher 3 (2015) | 176 | 110 | 59.8 | 34.4 |
| Rocket League (2017) | 249 | 204 | 136 | |
| Shadow of the Tomb Raider (2018) | 98 | 57 | 48 | 43 |
| Assassin´s Creed Odyssey (2018) | 71 | 56 | 48 | 30 |
| Apex Legends (2019) | 144 | 81.7 | 66.5 | 65.4 |
| Metro Exodus (2019) | 85.3 | 41 | 30.8 | 25.1 |
| Anthem (2019) | 62.7 | 56.8 | 47.3 | 44.9 |
| Dirt Rally 2.0 (2019) | 203 | 89.3 | 71 | 41.8 |
| The Division 2 (2019) | 114 | 63 | 50 | 37 |
| Anno 1800 (2019) | 74.9 | 64.5 | 40.1 | 19.4 |
| Rage 2 (2019) | 117 | 54.5 | 46 | 45.1 |
| Total War: Three Kingdoms (2019) | 166 | 63.9 | 38.5 | 24.4 |
| F1 2019 (2019) | 172 | 102 | 85 | 59 |
| Control (2019) | 129 | 44.2 | 32.1 | |
| Borderlands 3 (2019) | 98.9 | 58.3 | 39 | 29.5 |
| FIFA 20 (2019) | 188 | 154 | 148 | 137 |
| Ghost Recon Breakpoint (2019) | 85 | 48 | 44 | 30 |
| GRID 2019 (2019) | 123 | 76.2 | 59.7 | 41.3 |
Emissions
Noise Emissions
During idle and while performing harmless tasks such as using office, video and web applications, the 15-inch laptop remains relatively quiet. The two chassis fans either stand still and only the HDD is audible or the fans spin and produce an acceptable noise level. We noticed almost no fan pulsating behavior.


Dell would be well-advised to adjust the fan behavior under load however. 47 to 53 dB(A) means that the G5 is the loudest device in our comparison. Without headphones, gaming sessions are only enjoyable to a certain extent.
Noise Level
| Idle |
| 31 / 32 / 35 dB(A) |
| HDD |
| 32 dB(A) |
| Load |
| 49 / 53 dB(A) |
 | ||
30 dB silent 40 dB(A) audible 50 dB(A) loud |
||
min: | ||
| Dell G5 15 5590-PCNJJ i5-9300H, GeForce GTX 1650 Mobile | HP Omen 15-dc1020ng i5-9300H, GeForce GTX 1650 Mobile | Acer Aspire Nitro 5 AN515-54-53Z2 i5-9300H, GeForce GTX 1650 Mobile | HP Gaming Pavilion 15-dk0009ng i7-9750H, GeForce GTX 1660 Ti Max-Q | Lenovo Legion Y540-15IRH-81SX00B2GE i7-9750H, GeForce GTX 1660 Ti Mobile | Average of class Gaming | |
|---|---|---|---|---|---|---|
| Noise | 15% | 4% | 17% | 11% | 12% | |
| off / environment * | 30 | 28.8 4% | 30 -0% | 28.2 6% | 29.3 2% | 24.1 ? 20% |
| Idle Minimum * | 31 | 28.8 7% | 30 3% | 29.3 5% | 29.3 5% | 25.7 ? 17% |
| Idle Average * | 32 | 29.5 8% | 31 3% | 29.3 8% | 29.3 8% | 27.4 ? 14% |
| Idle Maximum * | 35 | 31.1 11% | 33 6% | 29.3 16% | 29.3 16% | 30.8 ? 12% |
| Load Average * | 49 | 35.2 28% | 46 6% | 32.3 34% | 35.7 27% | 43.2 ? 12% |
| Witcher 3 ultra * | 47 | 35.2 25% | 46 2% | 34 28% | 44.2 6% | |
| Load Maximum * | 53 | 41 23% | 49 8% | 41.2 22% | 45.6 14% | 53.5 ? -1% |
* ... smaller is better
Temperature
With high chassis temperatures, the noise emissions do not remain the only values that are higher than average. Up to 49 °C on the top and up to 55 °C on the bottom of the device is the highest result in our comparison and more in line with a high-end laptop with a Core i7-9750H and a GeForce RTX GPU. At least the case remains cool during idle, which is good to see.


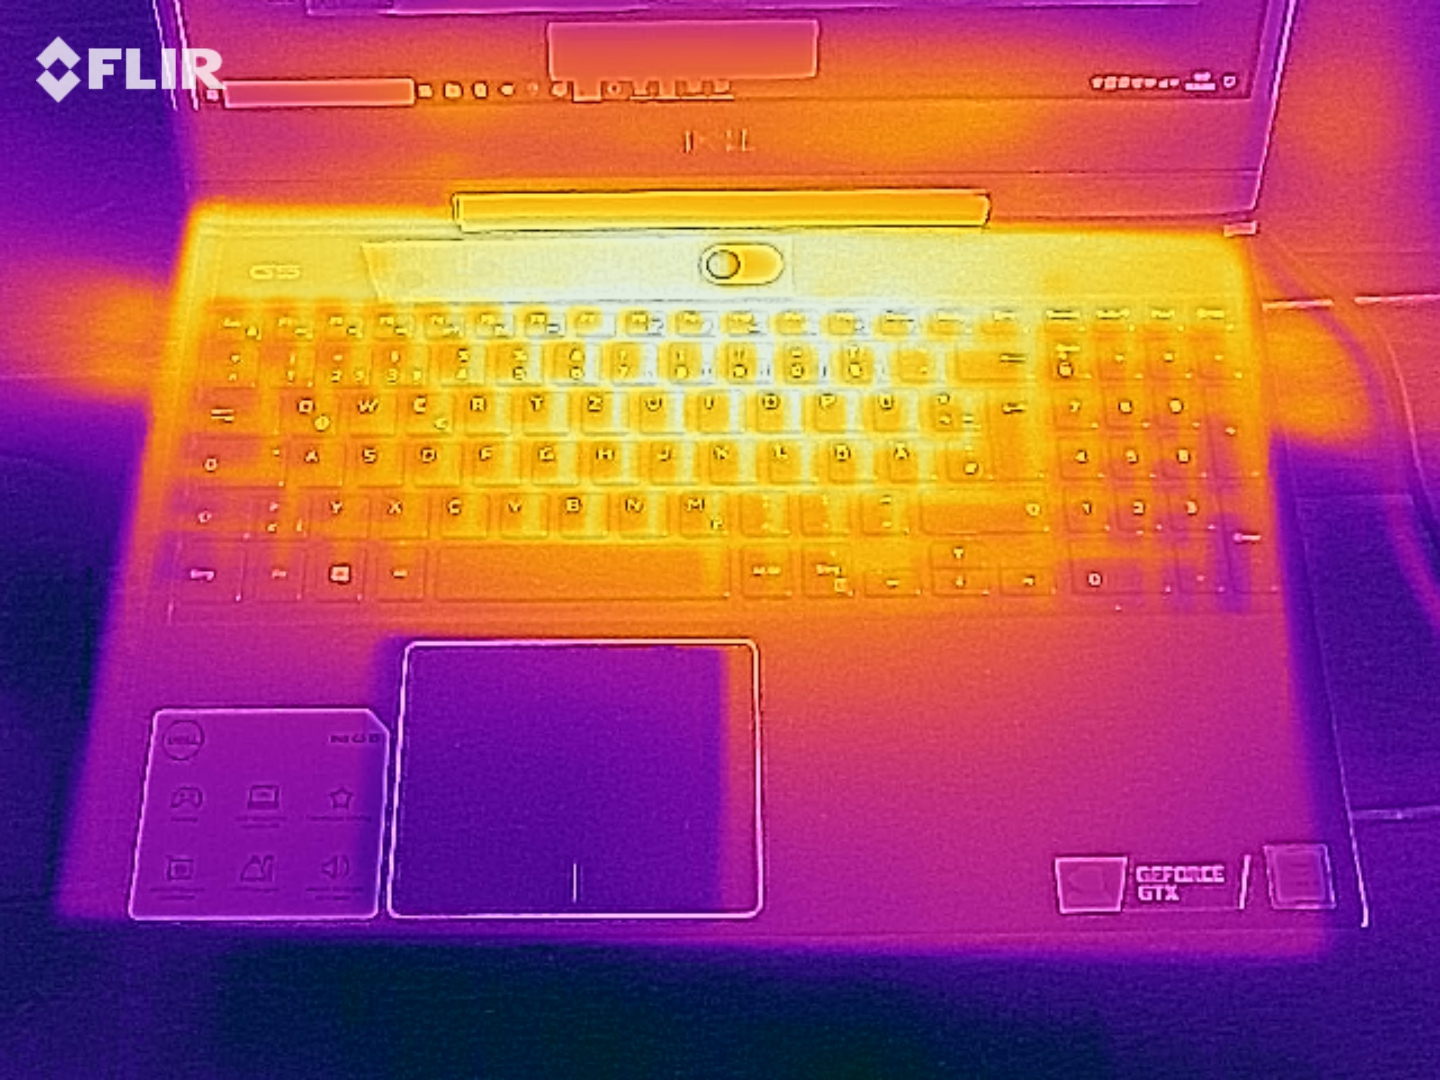

We determined the maximum temperatures of the GPU and CPU with the help of FurMark and Prime95. Up to 80 °C for the GTX 1650 (which suffered from slight throttling) and up to 100 °C for the Core i5-9300H is quite a lot.
(-) The maximum temperature on the upper side is 49 °C / 120 F, compared to the average of 40.4 °C / 105 F, ranging from 21.2 to 68.8 °C for the class Gaming.
(-) The bottom heats up to a maximum of 55 °C / 131 F, compared to the average of 43.2 °C / 110 F
(+) In idle usage, the average temperature for the upper side is 24.8 °C / 77 F, compared to the device average of 33.8 °C / 93 F.
(±) Playing The Witcher 3, the average temperature for the upper side is 37.3 °C / 99 F, compared to the device average of 33.8 °C / 93 F.
(+) The palmrests and touchpad are reaching skin temperature as a maximum (32 °C / 89.6 F) and are therefore not hot.
(-) The average temperature of the palmrest area of similar devices was 28.9 °C / 84 F (-3.1 °C / -5.6 F).
| Dell G5 15 5590-PCNJJ i5-9300H, GeForce GTX 1650 Mobile | HP Omen 15-dc1020ng i5-9300H, GeForce GTX 1650 Mobile | Acer Aspire Nitro 5 AN515-54-53Z2 i5-9300H, GeForce GTX 1650 Mobile | HP Gaming Pavilion 15-dk0009ng i7-9750H, GeForce GTX 1660 Ti Max-Q | Lenovo Legion Y540-15IRH-81SX00B2GE i7-9750H, GeForce GTX 1660 Ti Mobile | Average of class Gaming | |
|---|---|---|---|---|---|---|
| Heat | 10% | 5% | 5% | -18% | -9% | |
| Maximum Upper Side * | 49 | 40.3 18% | 47 4% | 46.7 5% | 42.7 13% | 46.1 ? 6% |
| Maximum Bottom * | 55 | 48.5 12% | 50 9% | 53.7 2% | 52.7 4% | 49.3 ? 10% |
| Idle Upper Side * | 25 | 23.9 4% | 24 4% | 23.8 5% | 33.1 -32% | 31.3 ? -25% |
| Idle Bottom * | 26 | 24.6 5% | 25 4% | 23.7 9% | 41 -58% | 32.5 ? -25% |
* ... smaller is better
Speakers
The audio quality of the 2.0 system in the front is neither very good nor very bad. The positive aspects most notably include the generous maximum volume level of 87 dB(A), which allows for watching movies and listening to music from a greater distance relative to the laptop. However, since the bass is rather poor and the mid and high tones could also be better, we still recommend using a headset or an external sound system.
Dell G5 15 5590-PCNJJ audio analysis
(+) | speakers can play relatively loud (87 dB)
Bass 100 - 315 Hz
(-) | nearly no bass - on average 19.7% lower than median
(±) | linearity of bass is average (11.9% delta to prev. frequency)
Mids 400 - 2000 Hz
(±) | higher mids - on average 5.7% higher than median
(+) | mids are linear (4.9% delta to prev. frequency)
Highs 2 - 16 kHz
(±) | reduced highs - on average 6.5% lower than median
(±) | linearity of highs is average (9.6% delta to prev. frequency)
Overall 100 - 16.000 Hz
(±) | linearity of overall sound is average (17.4% difference to median)
Compared to same class
» 45% of all tested devices in this class were better, 12% similar, 43% worse
» The best had a delta of 6%, average was 18%, worst was 132%
Compared to all devices tested
» 28% of all tested devices were better, 8% similar, 64% worse
» The best had a delta of 4%, average was 25%, worst was 134%
HP Omen 15-dc1020ng audio analysis
(-) | not very loud speakers (71.1 dB)
Bass 100 - 315 Hz
(-) | nearly no bass - on average 21.6% lower than median
(±) | linearity of bass is average (11.3% delta to prev. frequency)
Mids 400 - 2000 Hz
(+) | balanced mids - only 1.8% away from median
(±) | linearity of mids is average (8.8% delta to prev. frequency)
Highs 2 - 16 kHz
(+) | balanced highs - only 3.2% away from median
(+) | highs are linear (5.8% delta to prev. frequency)
Overall 100 - 16.000 Hz
(±) | linearity of overall sound is average (22.2% difference to median)
Compared to same class
» 77% of all tested devices in this class were better, 7% similar, 17% worse
» The best had a delta of 6%, average was 18%, worst was 132%
Compared to all devices tested
» 59% of all tested devices were better, 7% similar, 34% worse
» The best had a delta of 4%, average was 25%, worst was 134%
Energy Management
Energy Consumption
Since Dell does not include Nvidia's G-Sync technology and instead implements Optimus graphics switching, the G5 15 5590 shines with very low consumption during idle. 4-12 watts is an excellent result and points towards good battery life. Under load, the system consumes between 86 and 135 watts, which is a moderate range for the installed components and their performance. A 130-watt AC adapter powers our test configuration.
| Off / Standby | |
| Idle | |
| Load |
|
| Dell G5 15 5590-PCNJJ i5-9300H, GeForce GTX 1650 Mobile | HP Omen 15-dc1020ng i5-9300H, GeForce GTX 1650 Mobile | Acer Aspire Nitro 5 AN515-54-53Z2 i5-9300H, GeForce GTX 1650 Mobile | HP Gaming Pavilion 15-dk0009ng i7-9750H, GeForce GTX 1660 Ti Max-Q | Lenovo Legion Y540-15IRH-81SX00B2GE i7-9750H, GeForce GTX 1660 Ti Mobile | Average of class Gaming | |
|---|---|---|---|---|---|---|
| Power Consumption | 0% | -2% | -34% | -98% | -129% | |
| Idle Minimum * | 4 | 4.04 -1% | 5 -25% | 6.8 -70% | 14.5 -263% | 13.8 ? -245% |
| Idle Average * | 7 | 7.2 -3% | 7 -0% | 10.7 -53% | 18.5 -164% | 19.1 ? -173% |
| Idle Maximum * | 12 | 11.4 5% | 11 8% | 12.5 -4% | 20 -67% | 26.9 ? -124% |
| Load Average * | 95 | 80.8 15% | 89 6% | 87.2 8% | 81.6 14% | 111 ? -17% |
| Witcher 3 ultra * | 86 | 93.6 -9% | 90 -5% | 121 -41% | 132 -53% | |
| Load Maximum * | 135 | 144.5 -7% | 132 2% | 191.4 -42% | 208.1 -54% | 251 ? -86% |
* ... smaller is better
Battery Life
One of the biggest strengths of the G5 is its long battery life. Almost 8 hours of browsing the web at medium brightness and up to 14.5 hours idling at minimum luminosity are equally impressive. With 3D applications, around 2 hours is possible (unfortunately, gaming performance drops by about 90 % (!) in battery mode). Furthermore, the 60-Wh battery is ever so slightly larger than those of the competition (52.5 to 57 Wh).
| Dell G5 15 5590-PCNJJ i5-9300H, GeForce GTX 1650 Mobile, 60 Wh | HP Omen 15-dc1020ng i5-9300H, GeForce GTX 1650 Mobile, 52.5 Wh | Acer Aspire Nitro 5 AN515-54-53Z2 i5-9300H, GeForce GTX 1650 Mobile, 57 Wh | HP Gaming Pavilion 15-dk0009ng i7-9750H, GeForce GTX 1660 Ti Max-Q, 52.5 Wh | Lenovo Legion Y540-15IRH-81SX00B2GE i7-9750H, GeForce GTX 1660 Ti Mobile, 57 Wh | Average of class Gaming | |
|---|---|---|---|---|---|---|
| Battery Runtime | -19% | -4% | -41% | -61% | -32% | |
| Reader / Idle | 867 | 951 10% | 1044 20% | 522 -40% | 240 -72% | 543 ? -37% |
| WiFi v1.3 | 482 | 385 -20% | 486 1% | 290 -40% | 145 -70% | 369 ? -23% |
| Load | 131 | 71 -46% | 88 -33% | 76 -42% | 76 -42% | 84.5 ? -35% |
| H.264 | 482 | 317 | 399 ? | |||
| Witcher 3 ultra | 59 | 60 | 78.5 ? |
Pros
Cons
Verdict

On paper, the Dell G5 5590-PCNJJ looks great. For 1,000 Euros (~$1,112), buyers receive a sleek and gaming-ready 15-inch laptop with a quad-core CPU and a DirectX 12 GPU from the latest hardware generation.
Unfortunately, the device suffers from a few shortcomings that taint the good overall impression. In order to reduce the price and manufacturing costs, Dell has cut a couple of corners. As a result, users have to contend with drawbacks such as a slow card reader, a creaky chassis, a dimly lit display with poor colors and an SSD with low write speeds.
Our main issue lies in the CPU's behavior with regards to the clock speeds during 3D applications (such as games), which is characterized by varying degrees of throttling - this is tough to accept on a gaming laptop, although a BIOS update may fix this in the future.
Overall, price-conscious buyers would be better served by the HP Omen 15 or the Acer Nitro 5, both of which do not come with as many disadvantages. Note: We will take a look at another G5 that, with a Core i7-9750H and a GeForce RTX 2070 Max-Q, is better equipped but significantly more expensive as well in the near future.
Dell G5 15 5590-PCNJJ
-
05/14/2020 v7
Florian Glaser


Pricecompare

