NVIDIA GeForce GTX 1660 Ti Mobile
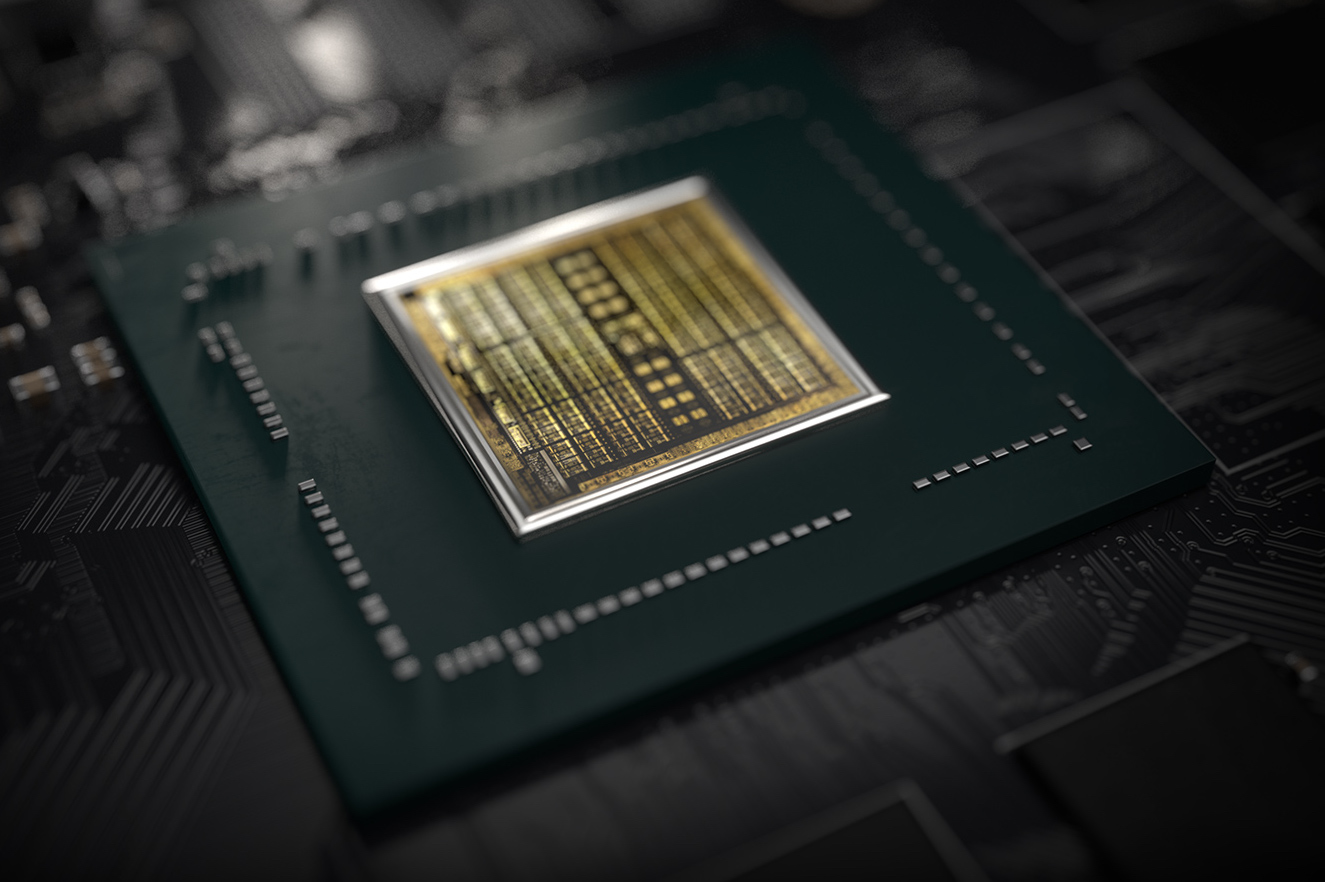
The Nvidia GeForce GTX 1660 Ti for laptops is a mobile graphics card that is based on the Turing architecture (TU116 chip). Compared to the faster RTX 2000 GPUs (e.g. RTX 2060 ), the 1660Ti integrates no Raytracing or Tensor cores. The performance is similar to the old GTX 1070 (laptop) but at a reduced TGP of 80 Watt (versus 115 Watt). Compared to the desktop GTX 1660 Ti, the clock speeds are reduced (3% lower base, 10% lower boost).
In April 2020 Nvidia refreshed the GTX 1660 Ti with the new codename N18E-G0-A1 with similar specs and pin compatible to the refreshed RTX chips (e.g., RTX 2070 Super Mobile ).
The Turing generation did not only introduce raytracing for the RTX cards, but also optimized the architecture of the cores and caches. According to Nvidia the CUDA cores offer now a concurrent execution of floating point and integer operations for increased performance in compute-heavy workloads of modern games. Furthermore, the caches were reworked (new unified memory architecture with twice the cache compared to Pascal). This leads to up to 50% more instructions per clock and a 40% more power efficient usage compared to Pascal.
The power consumption of the 1660Ti for latops is specified at 80 Watt TGP (Total Graphics Power) by Nvidia and therefore 20 Watt higher than the efficient (and slower) Max-Q variant of the 1660 Ti . The TU116 chip is manufactured in 12nm FFN at TSMC.
GeForce GTX 1600 Series Codename N18E-G0 Architecture Turing Pipelines 1536 - unified Core Speed 1455 - 1590 (Boost) MHz Memory Speed 12000 MHz Memory Bus Width 192 Bit Memory Type GDDR6 Max. Amount of Memory 6 GB Shared Memory no API DirectX 12_1, OpenGL 4.6 Power Consumption 80 Watt Transistor Count 6.6 Billion technology 12 nm Notebook Size medium sized Date of Announcement 23.04.2019 Link to Manufacturer Page www.nvidia.com
Benchmarks Performance Rating - 3DMark 11 + Fire Strike + Time Spy
6.8 pt (20%)
...
NVIDIA GeForce GTX 1660 Ti Mobile
...
max:
3DMark - 3DMark Time Spy Score
min: 4946 avg: 5717 median: 5697 (16%) max: 6261 Points
...
NVIDIA GeForce GTX 1660 Ti Mobile
...
max:
3DMark - 3DMark Time Spy Graphics
min: 5335 avg: 5653 median: 5659 (15%) max: 6123 Points
...
NVIDIA GeForce GTX 1660 Ti Mobile
...
max:
3DMark - 3DMark Ice Storm Unlimited Graphics
min: 412820 avg: 418846 median: 419800 (48%) max: 424615 Points
...
NVIDIA GeForce GTX 1660 Ti Mobile
...
max:
3DMark - 3DMark Ice Storm Extreme Graphics
min: 129343 avg: 199337 median: 162584 (21%) max: 316086 Points
...
NVIDIA GeForce GTX 1660 Ti Mobile
...
max:
3DMark - 3DMark Cloud Gate Score
min: 29390 avg: 34346 median: 35118.5 (38%) max: 38136 Points
...
NVIDIA GeForce GTX 1660 Ti Mobile
...
max:
3DMark - 3DMark Cloud Gate Graphics
min: 59839 avg: 94171 median: 97517 (26%) max: 104780 Points
...
NVIDIA GeForce GTX 1660 Ti Mobile
...
max:
3DMark - 3DMark Fire Strike Standard Score
min: 12263 avg: 13237 median: 13140 (23%) max: 14649 Points
...
NVIDIA GeForce GTX 1660 Ti Mobile
...
max:
3DMark - 3DMark Fire Strike Standard Graphics
min: 14186 avg: 14867 median: 14818 (17%) max: 16488 Points
...
NVIDIA GeForce GTX 1660 Ti Mobile
...
max:
3DMark - 3DMark Ice Storm Graphics
min: 129020 avg: 194329 median: 163522 (20%) max: 359516 Points
...
NVIDIA GeForce GTX 1660 Ti Mobile
...
max:
3DMark - 3DMark Night Raid
min: 32203 avg: 33044 median: 33043.5 (31%) max: 33884 Points
...
NVIDIA GeForce GTX 1660 Ti Mobile
...
max:
3DMark - 3DMark Night Raid Graphics Score
min: 63349 avg: 66325 median: 66325 (26%) max: 69301 Points
...
NVIDIA GeForce GTX 1660 Ti Mobile
...
max:
3DMark 11 - 3DM11 Performance Score
min: 15912 avg: 17361 median: 17351 (24%) max: 19342 Points
...
NVIDIA GeForce GTX 1660 Ti Mobile
...
max:
3DMark 11 - 3DM11 Performance GPU
min: 18610 avg: 20096 median: 20118.5 (17%) max: 22670 Points
...
NVIDIA GeForce GTX 1660 Ti Mobile
...
max:
3DMark Vantage + 3DMark Vantage - 3DM Vant. Perf. total
49309 Points (14%)
...
NVIDIA GeForce GTX 1660 Ti Mobile
...
max:
3DM Vant. Perf. GPU no PhysX + 3DMark Vantage - 3DM Vant. Perf. GPU no PhysX
52230 Points (30%)
...
NVIDIA GeForce GTX 1660 Ti Mobile
...
max:
3DMark 06 3DMark 06 - Standard 1280x1024 +
min: 36563 avg: 37825 median: 38153.5 (50%) max: 38429 Points
...
NVIDIA GeForce GTX 1660 Ti Mobile
...
max:
Blender - Blender 3.3 Classroom CUDA *
94 Seconds (14%)
...
NVIDIA GeForce GTX 1660 Ti Mobile
...
Blender - Blender 3.3 Classroom OPTIX *
95 Seconds (35%)
...
NVIDIA GeForce GTX 1660 Ti Mobile
SPECviewperf 12 + SPECviewperf 12 - specvp12 sw-03
44.7 fps (11%)
...
NVIDIA GeForce GTX 1660 Ti Mobile
...
max:
specvp12 snx-02 + SPECviewperf 12 - specvp12 snx-02
8.2 fps (1%)
...
NVIDIA GeForce GTX 1660 Ti Mobile
...
max:
specvp12 showcase-01 + SPECviewperf 12 - specvp12 showcase-01
74.4 fps (16%)
...
NVIDIA GeForce GTX 1660 Ti Mobile
...
max:
specvp12 mediacal-01 + SPECviewperf 12 - specvp12 mediacal-01
34.5 fps (9%)
...
NVIDIA GeForce GTX 1660 Ti Mobile
...
max:
specvp12 maya-04 + SPECviewperf 12 - specvp12 maya-04
71.5 fps (19%)
...
NVIDIA GeForce GTX 1660 Ti Mobile
...
max:
specvp12 energy-01 + SPECviewperf 12 - specvp12 energy-01
7.7 fps (7%)
...
NVIDIA GeForce GTX 1660 Ti Mobile
...
max:
specvp12 creo-01 + SPECviewperf 12 - specvp12 creo-01
38.4 fps (15%)
...
NVIDIA GeForce GTX 1660 Ti Mobile
...
max:
specvp12 catia-04 + SPECviewperf 12 - specvp12 catia-04
61.5 fps (10%)
...
NVIDIA GeForce GTX 1660 Ti Mobile
...
max:
specvp12 3dsmax-05 + SPECviewperf 12 - specvp12 3dsmax-05
146.5 fps (26%)
...
NVIDIA GeForce GTX 1660 Ti Mobile
...
max:
SPECviewperf 13 specvp13 sw-04 + SPECviewperf 13 - specvp13 sw-04
min: 64.8 avg: 65 median: 65 (17%) max: 65.1 fps
...
NVIDIA GeForce GTX 1660 Ti Mobile
...
max:
specvp13 snx-03 + SPECviewperf 13 - specvp13 snx-03
min: 14.49 avg: 14.7 median: 14.7 (2%) max: 14.81 fps
...
NVIDIA GeForce GTX 1660 Ti Mobile
...
max:
specvp13 showcase-02 + SPECviewperf 13 - specvp13 showcase-02
min: 73.8 avg: 74.2 median: 74.2 (16%) max: 74.6 fps
...
NVIDIA GeForce GTX 1660 Ti Mobile
...
max:
specvp13 medical-02 + SPECviewperf 13 - specvp13 medical-02
min: 38.27 avg: 38.6 median: 38.6 (8%) max: 38.99 fps
...
NVIDIA GeForce GTX 1660 Ti Mobile
...
max:
specvp13 maya-05 + SPECviewperf 13 - specvp13 maya-05
min: 165.2 avg: 166.2 median: 166.2 (19%) max: 167.1 fps
...
NVIDIA GeForce GTX 1660 Ti Mobile
...
max:
specvp13 energy-02 + SPECviewperf 13 - specvp13 energy-02
min: 10.18 avg: 10.5 median: 10.5 (3%) max: 10.81 fps
...
NVIDIA GeForce GTX 1660 Ti Mobile
...
specvp13 creo-02 + SPECviewperf 13 - specvp13 creo-02
min: 117.1 avg: 118.9 median: 118.9 (17%) max: 120.7 fps
...
NVIDIA GeForce GTX 1660 Ti Mobile
...
max:
specvp13 catia-05 + SPECviewperf 13 - specvp13 catia-05
min: 85.4 avg: 86.4 median: 86.4 (10%) max: 87.4 fps
...
NVIDIA GeForce GTX 1660 Ti Mobile
...
max:
specvp13 3dsmax-06 + SPECviewperf 13 - specvp13 3dsmax-06
min: 138.8 avg: 140.7 median: 140.7 (24%) max: 142.5 fps
...
NVIDIA GeForce GTX 1660 Ti Mobile
...
max:
Cinebench R10 Cinebench R10 Shading (32bit) + Cinebench R10 - Cinebench R10 Shading (32bit)
min: 4020 avg: 8599 median: 8212 (6%) max: 12878 points
...
NVIDIA GeForce GTX 1660 Ti Mobile
...
Cinebench R11.5 Cinebench R11.5 OpenGL 64 Bit + Cinebench R11.5 - Cinebench R11.5 OpenGL 64 Bit
min: 73.8 avg: 76.5 median: 76.9 (27%) max: 78.3 fps
...
NVIDIA GeForce GTX 1660 Ti Mobile
...
max:
Cinebench R15 + Cinebench R15 - Cinebench R15 OpenGL 64 Bit
min: 95.5 avg: 122.8 median: 120.6 (7%) max: 148.2 fps
...
NVIDIA GeForce GTX 1660 Ti Mobile
...
Cinebench R15 OpenGL Ref. Match 64 Bit + Cinebench R15 - Cinebench R15 OpenGL Ref. Match 64 Bit
min: 99.6 avg: 99.6 median: 99.6 (100%) max: 100 %
...
NVIDIA GeForce GTX 1660 Ti Mobile
...
GFXBench - GFXBench Car Chase Offscreen
250.7 fps (28%)
...
NVIDIA GeForce GTX 1660 Ti Mobile
...
Geekbench 6.2 - Geekbench 6.2 GPU OpenCL
67604 points (20%)
...
NVIDIA GeForce GTX 1660 Ti Mobile
...
max:
Geekbench 6.2 - Geekbench 6.2 GPU Vulkan
60065 points (20%)
...
NVIDIA GeForce GTX 1660 Ti Mobile
...
max:
LuxMark v2.0 64Bit - LuxMark v2.0 Room GPU
2416 Samples/s (11%)
...
NVIDIA GeForce GTX 1660 Ti Mobile
...
max:
LuxMark v2.0 64Bit - LuxMark v2.0 Sala GPU
4827 Samples/s (8%)
...
NVIDIA GeForce GTX 1660 Ti Mobile
...
max:
ComputeMark v2.1 - ComputeMark v2.1 Result
10148 points (11%)
...
NVIDIA GeForce GTX 1660 Ti Mobile
...
max:
Power Consumption - Furmark Stress Test Power Consumption - external Monitor *
139 Watt (20%)
...
NVIDIA GeForce GTX 1660 Ti Mobile
...
max:
Power Consumption - The Witcher 3 Power Consumption - external Monitor *
min: 139 avg: 146.5 median: 146.5 (20%) max: 154 Watt
...
NVIDIA GeForce GTX 1660 Ti Mobile
...
max:
Power Consumption - Witcher 3 Power Consumption *
min: 126 avg: 138.5 median: 134.1 (29%) max: 158.9 Watt
...
NVIDIA GeForce GTX 1660 Ti Mobile
...
Power Consumption - Witcher 3 ultra Power Efficiency
min: 0.3247 avg: 0.4 median: 0.4 (41%) max: 0.4546 fps per Watt
...
NVIDIA GeForce GTX 1660 Ti Mobile
...
Power Consumption - Witcher 3 ultra Power Efficiency - external Monitor
min: 0.3591 avg: 0.4 median: 0.4 (31%) max: 0.3899 fps per Watt
...
NVIDIA GeForce GTX 1660 Ti Mobile
...
Emissions Witcher 3 Fan Noise + Emissions - Witcher 3 Fan Noise
min: 44 avg: 50.7 median: 50.1 (80%) max: 60.8 dB(A)
...
NVIDIA GeForce GTX 1660 Ti Mobile
...
Clock Speed - GPU Clock Witcher 3 ultra
min: 1545 avg: 1661 median: 1650 (65%) max: 1815 MHz
...
NVIDIA GeForce GTX 1660 Ti Mobile
...
Clock Speed - GPU Clock Speed Furmark
855 MHz (34%)
...
NVIDIA GeForce GTX 1660 Ti Mobile
...
max:
- Range of benchmark values for this graphics card
- Average benchmark values for this graphics card
* Smaller numbers mean a higher performance
Game Benchmarks The following benchmarks stem from our benchmarks of review laptops. The performance depends on the used graphics memory, clock rate, processor, system settings, drivers, and operating systems. So the results don't have to be representative for all laptops with this GPU. For detailed information on the benchmark results, click on the fps number.
NVIDIA GeForce GTX 1660 Ti Mobile
max:
NVIDIA GeForce GTX 1660 Ti Mobile
...
max:
NVIDIA GeForce GTX 1660 Ti Mobile
max:
NVIDIA GeForce GTX 1660 Ti Mobile
max:
» With all tested laptops playable in detail settings ultra.
0 Tooltip Legion 5 15IMH05H 81Y600D7GE: Ø53.9 (38.62-94.2)
NVIDIA GeForce GTX 1660 Ti Mobile
max:
0 100 Tooltip Legion 5 15IMH05H 81Y600D7GE: Ø46 (33.014-102.5)
NVIDIA GeForce GTX 1660 Ti Mobile
max:
0 100 200 Tooltip Legion 5 15IMH05H 81Y600D7GE: Ø44.5 (24.039-205.9)
NVIDIA GeForce GTX 1660 Ti Mobile
max:
0 Tooltip Legion 5 15IMH05H 81Y600D7GE: Ø33.1 (18.668-95)
NVIDIA GeForce GTX 1660 Ti Mobile
...
max:
» With all tested laptops playable in detail settings med..
0 Tooltip Legion 5 15IMH05H 81Y600D7GE: Ø83.7 (25.192-100)
...
NVIDIA GeForce GTX 1660 Ti Mobile
max:
0 100 Tooltip Legion 5 15IMH05H 81Y600D7GE: Ø76 (62.067-132.7)
NVIDIA GeForce GTX 1660 Ti Mobile
max:
0 Tooltip Legion 5 15IMH05H 81Y600D7GE: Ø56.5 (48.423-68.98)
NVIDIA GeForce GTX 1660 Ti Mobile
max:
0 Tooltip Legion 5 15IMH05H 81Y600D7GE: Ø52 (44.363-58.644)
NVIDIA GeForce GTX 1660 Ti Mobile
max:
» With all tested laptops playable in detail settings ultra.
0 100 200 300 400 500 600 700 Tooltip Legion 5 15IMH05H 81Y600D7GE: Ø326 (228.44-758)
...
NVIDIA GeForce GTX 1660 Ti Mobile
max:
0 100 200 300 400 500 600 700 800 900 1000 1100 1200 1300 Tooltip Legion 5 15IMH05H 81Y600D7GE: Ø339 (200.793-1324)
...
NVIDIA GeForce GTX 1660 Ti Mobile
max:
0 100 200 300 400 Tooltip Legion 5 15IMH05H 81Y600D7GE: Ø291 (198.01-424.5)
...
NVIDIA GeForce GTX 1660 Ti Mobile
max:
» With all tested laptops playable in detail settings ultra.
0 100 Tooltip Legion 5 15IMH05H 81Y600D7GE: Ø144.8 (115.02-178.26)
...
NVIDIA GeForce GTX 1660 Ti Mobile
max:
0 100 Tooltip Legion 5 15IMH05H 81Y600D7GE: Ø108.7 (85.225-133.6)
...
NVIDIA GeForce GTX 1660 Ti Mobile
...
max:
0 100 200 Tooltip Legion 5 15IMH05H 81Y600D7GE: Ø109.2 (85.05-221)
...
NVIDIA GeForce GTX 1660 Ti Mobile
max:
0 100 Tooltip Legion 5 15IMH05H 81Y600D7GE: Ø79.1 (62.07-171.4)
...
NVIDIA GeForce GTX 1660 Ti Mobile
...
max:
» With all tested laptops playable in detail settings ultra.
0 100 Tooltip Legion 5 15IMH05H 81Y600D7GE: Ø141.7 (122.126-196.9)
...
NVIDIA GeForce GTX 1660 Ti Mobile
max:
0 100 Tooltip Legion 5 15IMH05H 81Y600D7GE: Ø117 (92.119-146)
...
NVIDIA GeForce GTX 1660 Ti Mobile
max:
0 100 Tooltip Legion 5 15IMH05H 81Y600D7GE: Ø102.3 (84.252-162.1)
...
NVIDIA GeForce GTX 1660 Ti Mobile
...
max:
0 Tooltip Legion 5 15IMH05H 81Y600D7GE: Ø74.5 (59.069-91)
...
NVIDIA GeForce GTX 1660 Ti Mobile
...
max:
» With all tested laptops playable in detail settings ultra.
Additional Benchmarks
Low Preset 1280x720
154 [X] Lenovo Legion 5 15IMH05H 81Y600D7GE Intel Core i5-10300H 2.5GHz
GeForce GTX 1660 Ti Mobile
min:
66.8 fps, P0.1:
78.6 fps, P1:
96.6 fps, max:
238 fps
Epic Preset + Epic RTX Global Illumination 1920x1080
63.6 [X] Lenovo Legion 5 15IMH05H 81Y600D7GE Intel Core i5-10300H 2.5GHz
GeForce GTX 1660 Ti Mobile
min:
28.4 fps, P0.1:
31.9 fps, P1:
42.6 fps, max:
134 fps
...
NVIDIA GeForce GTX 1660 Ti Mobile
max:
NVIDIA GeForce GTX 1660 Ti Mobile
...
max:
NVIDIA GeForce GTX 1660 Ti Mobile
...
max:
NVIDIA GeForce GTX 1660 Ti Mobile
...
max:
» With all tested laptops playable in detail settings med..
Additional Benchmarks
Low Preset TAA 1280x720
61 [X] Lenovo Legion 5 15IMH05H 81Y600D7GE Intel Core i5-10300H 2.5GHz
GeForce GTX 1660 Ti Mobile
min:
46 fps, max:
74 fps
NVIDIA GeForce GTX 1660 Ti Mobile
...
max:
NVIDIA GeForce GTX 1660 Ti Mobile
...
max:
NVIDIA GeForce GTX 1660 Ti Mobile
...
max:
NVIDIA GeForce GTX 1660 Ti Mobile
...
max:
» With all tested laptops playable in detail settings ultra.
Additional Benchmarks
Minimum Preset 1280x720
131 [X] Lenovo Legion 5 15IMH05H 81Y600D7GE Intel Core i5-10300H 2.5GHz
GeForce GTX 1660 Ti Mobile
P1:
89 fps
0 100 Tooltip Legion 5 15IMH05H 81Y600D7GE: Ø83.4 (69.813-171.3)
...
NVIDIA GeForce GTX 1660 Ti Mobile
max:
0 100 200 Tooltip Legion 5 15IMH05H 81Y600D7GE: Ø65 (52.039-269)
NVIDIA GeForce GTX 1660 Ti Mobile
...
max:
0 100 Tooltip Legion 5 15IMH05H 81Y600D7GE: Ø56.8 (48.061-143.2)
NVIDIA GeForce GTX 1660 Ti Mobile
...
max:
0 100 200 300 400 500 600 700 800 900 Tooltip Legion 5 15IMH05H 81Y600D7GE: Ø59.2 (38.04-913)
NVIDIA GeForce GTX 1660 Ti Mobile
...
max:
» With all tested laptops playable in detail settings ultra.
0 Tooltip Legion 5 15IMH05H 81Y600D7GE: Ø43.5 (35.426-74.2)
...
NVIDIA GeForce GTX 1660 Ti Mobile
...
max:
0 100 200 300 400 500 600 700 800 Tooltip Legion 5 15IMH05H 81Y600D7GE: Ø65.7 (29.75-811)
...
NVIDIA GeForce GTX 1660 Ti Mobile
...
max:
0 100 Tooltip Legion 5 15IMH05H 81Y600D7GE: Ø41.6 (27.22-162.9)
...
NVIDIA GeForce GTX 1660 Ti Mobile
...
max:
» With all tested laptops playable in detail settings low.
Additional Benchmarks
Low Preset 1280x720
62.2 [X] Lenovo Legion 5 15IMH05H 81Y600D7GE Intel Core i5-10300H 2.5GHz
GeForce GTX 1660 Ti Mobile
min:
28.5 fps, P0.1:
31.7 fps, P1:
36.8 fps, max:
104.8 fps
0 Tooltip Legion 5 15IMH05H 81Y600D7GE: Ø54.3 (44.242-75.5)
...
NVIDIA GeForce GTX 1660 Ti Mobile
max:
0 Tooltip Legion 5 15IMH05H 81Y600D7GE: Ø44.8 (36.257-76.3)
...
NVIDIA GeForce GTX 1660 Ti Mobile
...
max:
0 Tooltip Legion 5 15IMH05H 81Y600D7GE: Ø34.5 (27.147-61.2)
...
NVIDIA GeForce GTX 1660 Ti Mobile
...
max:
0 Tooltip Legion 5 15IMH05H 81Y600D7GE: Ø24.8 (19.004-99.6)
NVIDIA GeForce GTX 1660 Ti Mobile
...
max:
» With all tested laptops playable in detail settings med..
Additional Benchmarks
Low Preset 1280x720
83 [X] Lenovo Legion 5 15IMH05H 81Y600D7GE Intel Core i5-10300H 2.5GHz
GeForce GTX 1660 Ti Mobile
min:
45.7 fps, P0.1:
48.7 fps, P1:
60.2 fps, max:
119.8 fps
...
NVIDIA GeForce GTX 1660 Ti Mobile
...
max:
...
NVIDIA GeForce GTX 1660 Ti Mobile
...
max:
...
NVIDIA GeForce GTX 1660 Ti Mobile
...
max:
...
NVIDIA GeForce GTX 1660 Ti Mobile
...
max:
» With all tested laptops playable in detail settings ultra.
...
NVIDIA GeForce GTX 1660 Ti Mobile
...
max:
70 [X] Lenovo Legion 5 15IMH05H 81Y600D7GE Intel Core i5-10300H 2.5GHz
GeForce GTX 1660 Ti Mobile
min:
27 fps, P0.1:
33 fps, P1:
51 fps, max:
151 fps
fps
+ Compare
- Hide Comparison
...
NVIDIA GeForce GTX 1660 Ti Mobile
...
max:
...
NVIDIA GeForce GTX 1660 Ti Mobile
...
max:
...
NVIDIA GeForce GTX 1660 Ti Mobile
...
max:
» With all tested laptops playable in detail settings ultra.
0 100 Tooltip Legion 5 15IMH05H 81Y600D7GE: Ø97.1 (83.535-128.9)
NVIDIA GeForce GTX 1660 Ti Mobile
...
max:
» With all tested laptops playable in detail settings ultra.
0 100 Tooltip Legion 5 15IMH05H 81Y600D7GE: Ø147.8 (88.012-192.902)
...
NVIDIA GeForce GTX 1660 Ti Mobile
max:
0 100 200 Tooltip Legion 5 15IMH05H 81Y600D7GE: Ø137.1 (79.07-207.5)
...
NVIDIA GeForce GTX 1660 Ti Mobile
...
max:
0 100 Tooltip Legion 5 15IMH05H 81Y600D7GE: Ø109.1 (71.301-158.2)
...
NVIDIA GeForce GTX 1660 Ti Mobile
...
max:
0 100 Tooltip Legion 5 15IMH05H 81Y600D7GE: Ø111.7 (84.097-186.8)
...
NVIDIA GeForce GTX 1660 Ti Mobile
max:
» With all tested laptops playable in detail settings ultra.
...
NVIDIA GeForce GTX 1660 Ti Mobile
...
max:
...
NVIDIA GeForce GTX 1660 Ti Mobile
...
max:
...
NVIDIA GeForce GTX 1660 Ti Mobile
...
max:
...
NVIDIA GeForce GTX 1660 Ti Mobile
...
max:
» With all tested laptops playable in detail settings ultra.
Additional Benchmarks
Low Preset (FSR off) 1280x720
98.4 [X] Lenovo Legion 5 15IMH05H 81Y600D7GE Intel Core i5-10300H 2.5GHz
GeForce GTX 1660 Ti Mobile
min:
42 fps, max:
147.1 fps
Steam Deck 1280x720
103.6 [X] Lenovo Legion 5 15IMH05H 81Y600D7GE Intel Core i5-10300H 2.5GHz
GeForce GTX 1660 Ti Mobile
min:
43.6 fps, max:
145.6 fps
Ultra Preset (FSR on) 1920x1080
51.6 [X] Lenovo Legion 5 15IMH05H 81Y600D7GE Intel Core i5-10300H 2.5GHz
GeForce GTX 1660 Ti Mobile
min:
33.2 fps, max:
93.7 fps
0 100 Tooltip Legion 5 15IMH05H 81Y600D7GE: Ø107.2 (93.051-155.7)
...
NVIDIA GeForce GTX 1660 Ti Mobile
max:
0 100 Tooltip Legion 5 15IMH05H 81Y600D7GE: Ø90.9 (82.29-109.79)
...
NVIDIA GeForce GTX 1660 Ti Mobile
...
max:
0 100 Tooltip Legion 5 15IMH05H 81Y600D7GE: Ø80.1 (68.101-138.7)
...
NVIDIA GeForce GTX 1660 Ti Mobile
...
max:
0 100 Tooltip Legion 5 15IMH05H 81Y600D7GE: Ø74.5 (62.034-168.7)
...
NVIDIA GeForce GTX 1660 Ti Mobile
...
max:
» With all tested laptops playable in detail settings ultra.
...
NVIDIA GeForce GTX 1660 Ti Mobile
...
...
NVIDIA GeForce GTX 1660 Ti Mobile
max:
...
NVIDIA GeForce GTX 1660 Ti Mobile
max:
NVIDIA GeForce GTX 1660 Ti Mobile
...
max:
» With all tested laptops playable in detail settings ultra.
0 Tooltip Legion 5 15IMH05H 81Y600D7GE: Ø45.4 (39.144-59.2)
...
NVIDIA GeForce GTX 1660 Ti Mobile
max:
0 Tooltip Legion 5 15IMH05H 81Y600D7GE: Ø37.8 (33.002-47.97)
...
NVIDIA GeForce GTX 1660 Ti Mobile
...
max:
0 Tooltip Legion 5 15IMH05H 81Y600D7GE: Ø35.9 (28.101-88.3)
...
NVIDIA GeForce GTX 1660 Ti Mobile
...
max:
0 Tooltip Legion 5 15IMH05H 81Y600D7GE: Ø27.4 (23.394-30.194)
...
NVIDIA GeForce GTX 1660 Ti Mobile
...
max:
» With all tested laptops playable in detail settings med..
Additional Benchmarks
Low Preset 1280x720
61.7 [X] Lenovo Legion 5 15IMH05H 81Y600D7GE Intel Core i5-10300H 2.5GHz
GeForce GTX 1660 Ti Mobile
min:
24.4 fps, P0.1:
26 fps, P1:
29.3 fps, max:
125.8 fps
0 100 Tooltip Legion 5 15IMH05H 81Y600D7GE: Ø76 (53.434-166.4)
...
NVIDIA GeForce GTX 1660 Ti Mobile
max:
0 100 Tooltip Legion 5 15IMH05H 81Y600D7GE: Ø70.9 (51.62-101)
...
NVIDIA GeForce GTX 1660 Ti Mobile
...
max:
0 Tooltip Legion 5 15IMH05H 81Y600D7GE: Ø65.2 (50.007-92.85)
...
NVIDIA GeForce GTX 1660 Ti Mobile
...
max:
0 100 Tooltip Legion 5 15IMH05H 81Y600D7GE: Ø67.6 (55.485-124.1)
...
NVIDIA GeForce GTX 1660 Ti Mobile
...
max:
» With all tested laptops playable in detail settings ultra.
Additional Benchmarks
Low Preset 1280x720
69.5 [X] Lenovo Legion 5 15IMH05H 81Y600D7GE Intel Core i5-10300H 2.5GHz
GeForce GTX 1660 Ti Mobile
min:
36 fps, P0.1:
42.1 fps, P1:
50.5 fps, max:
115.2 fps
0 100 200 300 400 500 600 700 800 900 1000 1100 1200 1300 1400 1500 1600 1700 1800 1900 2000 2100 2200 2300 2400 2500 Tooltip Legion 5 15IMH05H 81Y600D7GE: Ø122.1 (39.773-2573)
...
NVIDIA GeForce GTX 1660 Ti Mobile
max:
0 100 200 Tooltip Legion 5 15IMH05H 81Y600D7GE: Ø52.6 (36.708-262)
NVIDIA GeForce GTX 1660 Ti Mobile
...
max:
0 Tooltip Legion 5 15IMH05H 81Y600D7GE: Ø40.5 (31.05-74.1)
NVIDIA GeForce GTX 1660 Ti Mobile
...
max:
» With all tested laptops playable in detail settings ultra.
Additional Benchmarks
Low 1280x720
73.5 [X] Lenovo Legion 5 15IMH05H 81Y600D7GE Intel Core i5-10300H 2.5GHz
GeForce GTX 1660 Ti Mobile
min:
18.6 fps, P0.1:
28.4 fps, P1:
41.3 fps, max:
110.9 fps
0 100 Tooltip Legion 5 15IMH05H 81Y600D7GE: Ø87.9 (76.18-103.81)
...
NVIDIA GeForce GTX 1660 Ti Mobile
max:
0 100 Tooltip Legion 5 15IMH05H 81Y600D7GE: Ø86.1 (73.381-132.6)
...
NVIDIA GeForce GTX 1660 Ti Mobile
...
max:
0 100 Tooltip Legion 5 15IMH05H 81Y600D7GE: Ø77.9 (67.553-100.8)
...
NVIDIA GeForce GTX 1660 Ti Mobile
...
max:
0 Tooltip Legion 5 15IMH05H 81Y600D7GE: Ø65.8 (60.152-76.9)
...
NVIDIA GeForce GTX 1660 Ti Mobile
...
max:
» With all tested laptops playable in detail settings ultra.
Additional Benchmarks
Low Preset 1280x720
138.3 [X] Lenovo Legion 5 15IMH05H 81Y600D7GE Intel Core i5-10300H 2.5GHz
GeForce GTX 1660 Ti Mobile
min:
59.9 fps, P0.1:
90.7 fps, P1:
101.8 fps, max:
189.2 fps
0 100 Tooltip Legion 5 15IMH05H 81Y600D7GE: Ø90.8 (72.646-153)
...
NVIDIA GeForce GTX 1660 Ti Mobile
...
max:
0 Tooltip Legion 5 15IMH05H 81Y600D7GE: Ø65.9 (58-92.1)
...
NVIDIA GeForce GTX 1660 Ti Mobile
...
max:
0 100 200 300 400 500 600 700 800 900 1000 1100 1200 1300 1400 1500 1600 1700 Tooltip Legion 5 15IMH05H 81Y600D7GE: Ø121.7 (50.536-1795)
...
NVIDIA GeForce GTX 1660 Ti Mobile
...
max:
0 Tooltip Legion 5 15IMH05H 81Y600D7GE: Ø57.7 (49.488-92.3)
...
NVIDIA GeForce GTX 1660 Ti Mobile
...
max:
» With all tested laptops playable in detail settings ultra.
0 100 200 300 400 Tooltip Legion 5 15IMH05H 81Y600D7GE: Ø72.5 (55.009-416)
...
NVIDIA GeForce GTX 1660 Ti Mobile
...
max:
0 100 200 Tooltip Legion 5 15IMH05H 81Y600D7GE: Ø61.1 (47.045-207.3)
...
NVIDIA GeForce GTX 1660 Ti Mobile
...
max:
0 Tooltip Legion 5 15IMH05H 81Y600D7GE: Ø43.9 (34.456-95.1)
...
NVIDIA GeForce GTX 1660 Ti Mobile
...
max:
0 100 Tooltip Legion 5 15IMH05H 81Y600D7GE: Ø45.9 (30.35-167.6)
...
NVIDIA GeForce GTX 1660 Ti Mobile
...
max:
» With all tested laptops playable in detail settings ultra.
Additional Benchmarks
Very Low Preset 1280x720
58.7 [X] Lenovo Legion 5 15IMH05H 81Y600D7GE Intel Core i5-10300H 2.5GHz
GeForce GTX 1660 Ti Mobile
min:
45.4 fps, P0.1:
46.6 fps, P1:
50.5 fps, max:
88.1 fps
158.4 [X] Lenovo Legion 5 15IMH05H 81Y600D7GE 1070925
Intel Core i5-10300H 2.5GHz
GeForce GTX 1660 Ti Mobile
min:
136 fps, P1:
100 fps, max:
177 fps
fps
+ Compare
- Hide Comparison
...
NVIDIA GeForce GTX 1660 Ti Mobile
...
max:
149.4 [X] Lenovo Legion 5 15IMH05H 81Y600D7GE 1070925
Intel Core i5-10300H 2.5GHz
GeForce GTX 1660 Ti Mobile
min:
122 fps, P1:
96 fps, max:
164 fps
fps
+ Compare
- Hide Comparison
...
NVIDIA GeForce GTX 1660 Ti Mobile
...
max:
108.5 [X] Lenovo Legion 5 15IMH05H 81Y600D7GE 1070925
Intel Core i5-10300H 2.5GHz
GeForce GTX 1660 Ti Mobile
min:
92 fps, P1:
82 fps, max:
121 fps
fps
+ Compare
- Hide Comparison
...
NVIDIA GeForce GTX 1660 Ti Mobile
...
max:
80.1 [X] Lenovo Legion 5 15IMH05H 81Y600D7GE 1070925
Intel Core i5-10300H 2.5GHz
GeForce GTX 1660 Ti Mobile
min:
63 fps, P1:
66 fps, max:
92 fps
fps
+ Compare
- Hide Comparison
...
NVIDIA GeForce GTX 1660 Ti Mobile
max:
» With all tested laptops playable in detail settings ultra.
Additional Benchmarks
Ultra Low Preset TAA 1280x720
196.2 [X] Lenovo Legion 5 15IMH05H 81Y600D7GE Intel Core i5-10300H 2.5GHz
GeForce GTX 1660 Ti Mobile
min:
156 fps, P1:
134 fps, max:
222 fps
0 100 Tooltip Legion 5 15IMH05H 81Y600D7GE: Ø151.3 (125.101-187.8)
...
NVIDIA GeForce GTX 1660 Ti Mobile
...
max:
0 100 Tooltip Legion 5 15IMH05H 81Y600D7GE: Ø132.7 (109.21-146.02)
...
NVIDIA GeForce GTX 1660 Ti Mobile
...
max:
0 100 200 Tooltip Legion 5 15IMH05H 81Y600D7GE: Ø124 (94.55-213.5)
...
NVIDIA GeForce GTX 1660 Ti Mobile
...
max:
0 100 Tooltip Legion 5 15IMH05H 81Y600D7GE: Ø98 (66.19-117.34)
...
NVIDIA GeForce GTX 1660 Ti Mobile
...
max:
» With all tested laptops playable in detail settings ultra.
0 100 200 300 400 500 600 700 800 900 1000 1100 1200 1300 1400 1500 1600 1700 1800 1900 2000 2100 Tooltip Legion 5 15IMH05H 81Y600D7GE: Ø120.4 (38.876-2187)
...
NVIDIA GeForce GTX 1660 Ti Mobile
...
max:
0 Tooltip Legion 5 15IMH05H 81Y600D7GE: Ø45 (37.355-67.3)
...
NVIDIA GeForce GTX 1660 Ti Mobile
...
max:
0 100 Tooltip Legion 5 15IMH05H 81Y600D7GE: Ø46.7 (31.56-123.7)
...
NVIDIA GeForce GTX 1660 Ti Mobile
...
max:
0 Tooltip Legion 5 15IMH05H 81Y600D7GE: Ø39.9 (30.644-57.7)
...
NVIDIA GeForce GTX 1660 Ti Mobile
...
max:
» With all tested laptops playable in detail settings ultra.
Additional Benchmarks
Low Preset 1280x720
78.8 [X] Lenovo Legion 5 15IMH05H 81Y600D7GE Intel Core i5-10300H 2.5GHz
GeForce GTX 1660 Ti Mobile
min:
32.6 fps, P0.1:
40.4 fps, P1:
53.4 fps, max:
118 fps
0 100 Tooltip Legion 5 15IMH05H 81Y600D7GE: Ø137.2 (103.36-157.261)
...
NVIDIA GeForce GTX 1660 Ti Mobile
...
max:
0 100 200 Tooltip Legion 5 15IMH05H 81Y600D7GE: Ø126.8 (102.28-235.6)
...
NVIDIA GeForce GTX 1660 Ti Mobile
...
max:
0 100 Tooltip Legion 5 15IMH05H 81Y600D7GE: Ø89 (74.304-103)
...
NVIDIA GeForce GTX 1660 Ti Mobile
...
max:
0 100 Tooltip Legion 5 15IMH05H 81Y600D7GE: Ø70.2 (54.42-152)
...
NVIDIA GeForce GTX 1660 Ti Mobile
...
max:
» With all tested laptops playable in detail settings ultra.
0 100 200 300 Tooltip Legion 5 15IMH05H 81Y600D7GE: Ø71.9 (49.261-397)
...
NVIDIA GeForce GTX 1660 Ti Mobile
...
max:
0 100 Tooltip Legion 5 15IMH05H 81Y600D7GE: Ø54.2 (39.187-145.4)
...
NVIDIA GeForce GTX 1660 Ti Mobile
...
max:
0 100 Tooltip Legion 5 15IMH05H 81Y600D7GE: Ø48.7 (35.074-196.5)
...
NVIDIA GeForce GTX 1660 Ti Mobile
...
max:
0 100 Tooltip Legion 5 15IMH05H 81Y600D7GE: Ø37.8 (26.358-173)
NVIDIA GeForce GTX 1660 Ti Mobile
...
max:
» With all tested laptops playable in detail settings high.
0 100 200 Tooltip Legion 5 15IMH05H 81Y600D7GE: Ø90.4 (72.42-234.3)
...
NVIDIA GeForce GTX 1660 Ti Mobile
...
max:
0 100 200 300 400 500 600 700 800 900 1000 1100 1200 1300 1400 1500 1600 1700 1800 1900 2000 2100 2200 2300 2400 Tooltip Legion 5 15IMH05H 81Y600D7GE: Ø137 (42.26-2437)
...
NVIDIA GeForce GTX 1660 Ti Mobile
...
max:
0 Tooltip Legion 5 15IMH05H 81Y600D7GE: Ø52.7 (44.074-76.2)
...
NVIDIA GeForce GTX 1660 Ti Mobile
...
max:
0 100 Tooltip Legion 5 15IMH05H 81Y600D7GE: Ø46.8 (38.048-122.7)
...
NVIDIA GeForce GTX 1660 Ti Mobile
...
max:
» With all tested laptops playable in detail settings ultra.
...
NVIDIA GeForce GTX 1660 Ti Mobile
...
max:
...
NVIDIA GeForce GTX 1660 Ti Mobile
...
max:
...
NVIDIA GeForce GTX 1660 Ti Mobile
...
max:
...
NVIDIA GeForce GTX 1660 Ti Mobile
...
max:
» With all tested laptops playable in detail settings ultra.
0 Tooltip Legion 5 15IMH05H 81Y600D7GE: Ø75 (67.347-89.7)
...
NVIDIA GeForce GTX 1660 Ti Mobile
...
max:
0 100 Tooltip Legion 5 15IMH05H 81Y600D7GE: Ø63.6 (45.569-134.1)
...
NVIDIA GeForce GTX 1660 Ti Mobile
...
max:
0 100 Tooltip Legion 5 15IMH05H 81Y600D7GE: Ø64.2 (45.171-193.6)
...
NVIDIA GeForce GTX 1660 Ti Mobile
...
max:
0 100 200 300 400 500 600 700 800 900 1000 1100 1200 1300 1400 1500 Tooltip Legion 5 15IMH05H 81Y600D7GE: Ø96.5 (42.02-1569)
...
NVIDIA GeForce GTX 1660 Ti Mobile
...
max:
» With all tested laptops playable in detail settings ultra.
Additional Benchmarks
Ultra Low Preset 1280x720
77.3 [X] Lenovo Legion 5 15IMH05H 81Y600D7GE Intel Core i5-10300H 2.5GHz
GeForce GTX 1660 Ti Mobile
min:
3.98 fps, P0.1:
56.5 fps, P1:
63.5 fps, max:
103.1 fps
0 100 Tooltip Legion 5 15IMH05H 81Y600D7GE: Ø112.1 (100.287-160.1)
...
NVIDIA GeForce GTX 1660 Ti Mobile
...
max:
0 100 Tooltip Legion 5 15IMH05H 81Y600D7GE: Ø85 (73.619-141.9)
...
NVIDIA GeForce GTX 1660 Ti Mobile
...
max:
0 100 200 300 400 500 Tooltip Legion 5 15IMH05H 81Y600D7GE: Ø60.7 (45.049-509)
...
NVIDIA GeForce GTX 1660 Ti Mobile
...
max:
0 Tooltip Legion 5 15IMH05H 81Y600D7GE: Ø41.4 (35.067-83.8)
...
NVIDIA GeForce GTX 1660 Ti Mobile
...
max:
» With all tested laptops playable in detail settings ultra.
Additional Benchmarks
Low Preset 1280x720
153.7 [X] Lenovo Legion 5 15IMH05H 81Y600D7GE Intel Core i5-10300H 2.5GHz
GeForce GTX 1660 Ti Mobile
min:
30 fps, P0.1:
88.7 fps, P1:
122 fps, max:
183.2 fps
...
NVIDIA GeForce GTX 1660 Ti Mobile
...
max:
...
NVIDIA GeForce GTX 1660 Ti Mobile
...
max:
...
NVIDIA GeForce GTX 1660 Ti Mobile
...
max:
...
NVIDIA GeForce GTX 1660 Ti Mobile
...
max:
» With all tested laptops playable in detail settings ultra.
0 100 Tooltip Legion 5 15IMH05H 81Y600D7GE: Ø77.1 (60.014-118.9)
...
NVIDIA GeForce GTX 1660 Ti Mobile
...
max:
0 100 Tooltip Legion 5 15IMH05H 81Y600D7GE: Ø65.4 (57.792-108.7)
...
NVIDIA GeForce GTX 1660 Ti Mobile
...
max:
0 Tooltip Legion 5 15IMH05H 81Y600D7GE: Ø50.4 (42.4-79.1)
...
NVIDIA GeForce GTX 1660 Ti Mobile
...
max:
0 100 Tooltip Legion 5 15IMH05H 81Y600D7GE: Ø42.8 (30.357-109.1)
...
NVIDIA GeForce GTX 1660 Ti Mobile
...
max:
» With all tested laptops playable in detail settings ultra.
0 100 Tooltip Legion 5 15IMH05H 81Y600D7GE: Ø59.6 (45.539-162.7)
...
NVIDIA GeForce GTX 1660 Ti Mobile
...
max:
0 Tooltip Legion 5 15IMH05H 81Y600D7GE: Ø48.8 (40.176-60.34)
...
NVIDIA GeForce GTX 1660 Ti Mobile
...
max:
0 100 Tooltip Legion 5 15IMH05H 81Y600D7GE: Ø48.5 (34.754-122.8)
...
NVIDIA GeForce GTX 1660 Ti Mobile
...
max:
0 Tooltip Legion 5 15IMH05H 81Y600D7GE: Ø42.6 (35.068-73.3)
...
NVIDIA GeForce GTX 1660 Ti Mobile
...
max:
» With all tested laptops playable in detail settings ultra.
Additional Benchmarks
Low Preset TAA 1280x720
80.2 [X] Lenovo Legion 5 15IMH05H 81Y600D7GE Intel Core i5-10300H 2.5GHz
GeForce GTX 1660 Ti Mobile
min:
26 fps, P0.1:
29.2 fps, P1:
34.6 fps, max:
163.7 fps
0 100 200 Tooltip Legion 5 15IMH05H 81Y600D7GE: Ø138.1 (116.31-213.7)
...
NVIDIA GeForce GTX 1660 Ti Mobile
max:
0 100 200 Tooltip Legion 5 15IMH05H 81Y600D7GE: Ø112.9 (86.248-300)
...
NVIDIA GeForce GTX 1660 Ti Mobile
...
max:
0 Tooltip Legion 5 15IMH05H 81Y600D7GE: Ø45.9 (39.271-80.8)
...
NVIDIA GeForce GTX 1660 Ti Mobile
...
max:
0 Tooltip Legion 5 15IMH05H 81Y600D7GE: Ø39.6 (32.954-60)
...
NVIDIA GeForce GTX 1660 Ti Mobile
...
max:
» With all tested laptops playable in detail settings ultra.
0 100 Tooltip Legion 5 15IMH05H 81Y600D7GE: Ø147.3 (109.81-190.1)
...
NVIDIA GeForce GTX 1660 Ti Mobile
...
max:
0 100 Tooltip Legion 5 15IMH05H 81Y600D7GE: Ø100.7 (67.663-153.7)
...
NVIDIA GeForce GTX 1660 Ti Mobile
...
max:
0 100 Tooltip Legion 5 15IMH05H 81Y600D7GE: Ø85.2 (55.175-148.6)
...
NVIDIA GeForce GTX 1660 Ti Mobile
...
max:
0 Tooltip Legion 5 15IMH05H 81Y600D7GE: Ø63.3 (45.03-76.1)
...
NVIDIA GeForce GTX 1660 Ti Mobile
...
max:
» With all tested laptops playable in detail settings ultra.
...
NVIDIA GeForce GTX 1660 Ti Mobile
...
max:
...
NVIDIA GeForce GTX 1660 Ti Mobile
...
max:
...
NVIDIA GeForce GTX 1660 Ti Mobile
...
max:
...
NVIDIA GeForce GTX 1660 Ti Mobile
...
max:
» With all tested laptops playable in detail settings ultra.
0 100 Tooltip Legion 5 15IMH05H 81Y600D7GE: Ø95.6 (79.038-151.4)
...
NVIDIA GeForce GTX 1660 Ti Mobile
...
max:
0 100 Tooltip Legion 5 15IMH05H 81Y600D7GE: Ø86.7 (77.071-128.8)
...
NVIDIA GeForce GTX 1660 Ti Mobile
...
max:
0 100 200 300 Tooltip Legion 5 15IMH05H 81Y600D7GE: Ø79.4 (53.033-323)
...
NVIDIA GeForce GTX 1660 Ti Mobile
...
max:
0 100 Tooltip Legion 5 15IMH05H 81Y600D7GE: Ø64.2 (51.31-141.1)
...
NVIDIA GeForce GTX 1660 Ti Mobile
...
max:
» With all tested laptops playable in detail settings ultra.
Additional Benchmarks
Low Preset 1280x720
103.7 [X] Lenovo Legion 5 15IMH05H 81Y600D7GE Intel Core i5-10300H 2.5GHz
GeForce GTX 1660 Ti Mobile
min:
41.3 fps, P0.1:
60.9 fps, P1:
77.1 fps, max:
148.3 fps
0 100 Tooltip Legion 5 15IMH05H 81Y600D7GE: Ø84.6 (75.76-108.3)
...
NVIDIA GeForce GTX 1660 Ti Mobile
...
max:
0 Tooltip Legion 5 15IMH05H 81Y600D7GE: Ø83 (74.339-99.1)
...
NVIDIA GeForce GTX 1660 Ti Mobile
...
max:
0 Tooltip Legion 5 15IMH05H 81Y600D7GE: Ø77.7 (70.035-90.036)
...
NVIDIA GeForce GTX 1660 Ti Mobile
...
max:
0 100 Tooltip Legion 5 15IMH05H 81Y600D7GE: Ø71.1 (64.168-107.6)
...
NVIDIA GeForce GTX 1660 Ti Mobile
...
max:
» With all tested laptops playable in detail settings ultra.
0 Tooltip Legion 5 15IMH05H 81Y600D7GE: Ø59 (53.093-66.82)
...
NVIDIA GeForce GTX 1660 Ti Mobile
...
max:
0 Tooltip Legion 5 15IMH05H 81Y600D7GE: Ø57.5 (52.092-66.1)
...
NVIDIA GeForce GTX 1660 Ti Mobile
...
max:
0 Tooltip Legion 5 15IMH05H 81Y600D7GE: Ø52.3 (46.022-61.45)
...
NVIDIA GeForce GTX 1660 Ti Mobile
...
max:
0 Tooltip Legion 5 15IMH05H 81Y600D7GE: Ø49.7 (44.049-56.69)
...
NVIDIA GeForce GTX 1660 Ti Mobile
...
max:
» With all tested laptops playable in detail settings ultra.
Additional Benchmarks
Low Preset 1280x720
57.9 [X] Lenovo Legion 5 15IMH05H 81Y600D7GE Intel Core i5-10300H 2.5GHz
GeForce GTX 1660 Ti Mobile
min:
34 fps, P0.1:
40 fps, P1:
45.6 fps, max:
79.5 fps
0 100 Tooltip Legion 5 15IMH05H 81Y600D7GE: Ø58.1 (48.124-128.1)
...
NVIDIA GeForce GTX 1660 Ti Mobile
...
max:
0 Tooltip Legion 5 15IMH05H 81Y600D7GE: Ø46.9 (40.128-68.9)
...
NVIDIA GeForce GTX 1660 Ti Mobile
...
max:
0 100 Tooltip Legion 5 15IMH05H 81Y600D7GE: Ø46.9 (33.048-176.3)
...
NVIDIA GeForce GTX 1660 Ti Mobile
...
max:
» With all tested laptops playable in detail settings ultra.
0 100 Tooltip Legion 5 15IMH05H 81Y600D7GE: Ø102.2 (92.219-167.3)
...
NVIDIA GeForce GTX 1660 Ti Mobile
max:
» With all tested laptops playable in detail settings ultra.
0 100 Tooltip Legion 5 15IMH05H 81Y600D7GE: Ø95.6 (84.358-166.8)
...
NVIDIA GeForce GTX 1660 Ti Mobile
max:
0 Tooltip Legion 5 15IMH05H 81Y600D7GE: Ø72.6 (63.166-94.4)
...
NVIDIA GeForce GTX 1660 Ti Mobile
...
max:
0 100 Tooltip Legion 5 15IMH05H 81Y600D7GE: Ø60.2 (46.009-153.4)
...
NVIDIA GeForce GTX 1660 Ti Mobile
...
max:
0 Tooltip Legion 5 15IMH05H 81Y600D7GE: Ø44.7 (37.599-62.3)
...
NVIDIA GeForce GTX 1660 Ti Mobile
...
max:
» With all tested laptops playable in detail settings ultra.
160.5 [X] Lenovo Legion 5 15IMH05H 81Y600D7GE 959964
Intel Core i5-10300H 2.5GHz
GeForce GTX 1660 Ti Mobile
min:
138 fps, P1:
95 fps, max:
186 fps
fps
+ Compare
- Hide Comparison
...
NVIDIA GeForce GTX 1660 Ti Mobile
...
max:
148.3 [X] Lenovo Legion 5 15IMH05H 81Y600D7GE 959964
Intel Core i5-10300H 2.5GHz
GeForce GTX 1660 Ti Mobile
min:
125 fps, P1:
86 fps, max:
165 fps
fps
+ Compare
- Hide Comparison
...
NVIDIA GeForce GTX 1660 Ti Mobile
...
max:
117.2 [X] Lenovo Legion 5 15IMH05H 81Y600D7GE 959964
Intel Core i5-10300H 2.5GHz
GeForce GTX 1660 Ti Mobile
min:
102 fps, P1:
74 fps, max:
135 fps
fps
+ Compare
- Hide Comparison
...
NVIDIA GeForce GTX 1660 Ti Mobile
...
max:
90.9 [X] Lenovo Legion 5 15IMH05H 81Y600D7GE 959964
Intel Core i5-10300H 2.5GHz
GeForce GTX 1660 Ti Mobile
min:
78 fps, P1:
62 fps, max:
106 fps
fps
+ Compare
- Hide Comparison
...
NVIDIA GeForce GTX 1660 Ti Mobile
...
max:
» With all tested laptops playable in detail settings ultra.
Additional Benchmarks
Ultra Low Preset 16xAF TAA 1280x720
204 [X] Lenovo Legion 5 15IMH05H 81Y600D7GE Intel Core i5-10300H 2.5GHz
GeForce GTX 1660 Ti Mobile
min:
156 fps, P1:
122 fps, max:
222 fps
...
NVIDIA GeForce GTX 1660 Ti Mobile
...
max:
...
NVIDIA GeForce GTX 1660 Ti Mobile
...
max:
...
NVIDIA GeForce GTX 1660 Ti Mobile
...
max:
NVIDIA GeForce GTX 1660 Ti Mobile
...
max:
NVIDIA GeForce GTX 1660 Ti Mobile
...
max:
» With all tested laptops playable in detail settings ultra.
...
NVIDIA GeForce GTX 1660 Ti Mobile
max:
...
NVIDIA GeForce GTX 1660 Ti Mobile
...
max:
...
NVIDIA GeForce GTX 1660 Ti Mobile
...
max:
...
NVIDIA GeForce GTX 1660 Ti Mobile
...
max:
NVIDIA GeForce GTX 1660 Ti Mobile
...
max:
NVIDIA GeForce GTX 1660 Ti Mobile
...
max:
» With all tested laptops playable in detail settings ultra.
...
NVIDIA GeForce GTX 1660 Ti Mobile
...
max:
...
NVIDIA GeForce GTX 1660 Ti Mobile
...
max:
...
NVIDIA GeForce GTX 1660 Ti Mobile
...
max:
...
NVIDIA GeForce GTX 1660 Ti Mobile
...
max:
NVIDIA GeForce GTX 1660 Ti Mobile
...
max:
» With all tested laptops playable in detail settings ultra.
...
NVIDIA GeForce GTX 1660 Ti Mobile
...
max:
...
NVIDIA GeForce GTX 1660 Ti Mobile
...
max:
...
NVIDIA GeForce GTX 1660 Ti Mobile
...
max:
...
NVIDIA GeForce GTX 1660 Ti Mobile
...
max:
...
NVIDIA GeForce GTX 1660 Ti Mobile
...
max:
NVIDIA GeForce GTX 1660 Ti Mobile
...
max:
» With all tested laptops playable in detail settings ultra.
Additional Benchmarks
Low Preset 1280x720
121 [X] MSI GP65 Leopard 9SD Intel Core i7-9750H 2.6GHz
GeForce GTX 1660 Ti Mobile
min:
43 fps
...
NVIDIA GeForce GTX 1660 Ti Mobile
...
...
NVIDIA GeForce GTX 1660 Ti Mobile
...
...
NVIDIA GeForce GTX 1660 Ti Mobile
...
NVIDIA GeForce GTX 1660 Ti Mobile
...
NVIDIA GeForce GTX 1660 Ti Mobile
max:
» With all tested laptops playable in detail settings ultra.
...
NVIDIA GeForce GTX 1660 Ti Mobile
...
max:
...
NVIDIA GeForce GTX 1660 Ti Mobile
...
max:
...
NVIDIA GeForce GTX 1660 Ti Mobile
...
max:
NVIDIA GeForce GTX 1660 Ti Mobile
...
max:
NVIDIA GeForce GTX 1660 Ti Mobile
...
max:
» With all tested laptops playable in detail settings ultra.
...
NVIDIA GeForce GTX 1660 Ti Mobile
...
max:
...
NVIDIA GeForce GTX 1660 Ti Mobile
...
max:
...
NVIDIA GeForce GTX 1660 Ti Mobile
...
max:
NVIDIA GeForce GTX 1660 Ti Mobile
...
max:
NVIDIA GeForce GTX 1660 Ti Mobile
...
max:
» With all tested laptops playable in detail settings ultra.
...
NVIDIA GeForce GTX 1660 Ti Mobile
...
max:
...
NVIDIA GeForce GTX 1660 Ti Mobile
...
max:
...
NVIDIA GeForce GTX 1660 Ti Mobile
...
max:
NVIDIA GeForce GTX 1660 Ti Mobile
...
max:
NVIDIA GeForce GTX 1660 Ti Mobile
...
max:
» With all tested laptops playable in detail settings high.
...
NVIDIA GeForce GTX 1660 Ti Mobile
...
max:
...
NVIDIA GeForce GTX 1660 Ti Mobile
...
max:
...
NVIDIA GeForce GTX 1660 Ti Mobile
...
max:
NVIDIA GeForce GTX 1660 Ti Mobile
...
max:
NVIDIA GeForce GTX 1660 Ti Mobile
...
max:
» With all tested laptops playable in detail settings ultra.
...
NVIDIA GeForce GTX 1660 Ti Mobile
...
max:
...
NVIDIA GeForce GTX 1660 Ti Mobile
...
max:
0 100 200 300 400 500 600 700 800 900 1000 1100 1200 1300 1400 1500 1600 1700 1800 1900 2000 2100 2200 2300 2400 2500 2600 2700 2800 2900 3000 3100 3200 3300 3400 3500 3600 3700 3800 3900 4000 4100 4200 4300 4400 4500 4600 4700 4800 4900 5000 5100 5200 5300 5400 5500 5600 5700 5800 5900 6000 6100 6200 6300 6400 6500 6600 6700 6800 6900 7000 7100 7200 7300 7400 7500 7600 7700 7800 7900 8000 8100 8200 8300 8400 8500 8600 8700 8800 8900 9000 9100 9200 9300 9400 9500 9600 9700 9800 9900 Tooltip
...
NVIDIA GeForce GTX 1660 Ti Mobile
...
max:
NVIDIA GeForce GTX 1660 Ti Mobile
...
max:
NVIDIA GeForce GTX 1660 Ti Mobile
...
max:
» With all tested laptops playable in detail settings high.
...
NVIDIA GeForce GTX 1660 Ti Mobile
...
...
NVIDIA GeForce GTX 1660 Ti Mobile
...
...
NVIDIA GeForce GTX 1660 Ti Mobile
...
NVIDIA GeForce GTX 1660 Ti Mobile
...
NVIDIA GeForce GTX 1660 Ti Mobile
...
» With all tested laptops playable in detail settings ultra.
0 100 Tooltip : Ø149.3 (95.805-174.372)
...
NVIDIA GeForce GTX 1660 Ti Mobile
...
max:
...
NVIDIA GeForce GTX 1660 Ti Mobile
...
max:
...
NVIDIA GeForce GTX 1660 Ti Mobile
...
max:
NVIDIA GeForce GTX 1660 Ti Mobile
...
max:
NVIDIA GeForce GTX 1660 Ti Mobile
...
max:
» With all tested laptops playable in detail settings ultra.
...
NVIDIA GeForce GTX 1660 Ti Mobile
max:
...
NVIDIA GeForce GTX 1660 Ti Mobile
max:
NVIDIA GeForce GTX 1660 Ti Mobile
NVIDIA GeForce GTX 1660 Ti Mobile
0 100 200 300 400 500 600 700 Tooltip
NVIDIA GeForce GTX 1660 Ti Mobile
» With all tested laptops playable in detail settings ultra.
Additional Benchmarks
Low Preset 1920x1080
101 [X] MSI GP65 Leopard 9SD Intel Core i7-9750H 2.6GHz
GeForce GTX 1660 Ti Mobile
min:
46.8 fps, P0.1:
51.4 fps, P1:
70.7 fps, max:
151 fps
...
NVIDIA GeForce GTX 1660 Ti Mobile
...
max:
...
NVIDIA GeForce GTX 1660 Ti Mobile
...
max:
...
NVIDIA GeForce GTX 1660 Ti Mobile
...
max:
NVIDIA GeForce GTX 1660 Ti Mobile
...
max:
NVIDIA GeForce GTX 1660 Ti Mobile
...
max:
» With all tested laptops playable in detail settings ultra.
Additional Benchmarks
Low Preset 1920x1080
123 [X] MSI GP65 Leopard 9SD Intel Core i7-9750H 2.6GHz
GeForce GTX 1660 Ti Mobile
NVIDIA GeForce GTX 1660 Ti Mobile
max:
NVIDIA GeForce GTX 1660 Ti Mobile
max:
NVIDIA GeForce GTX 1660 Ti Mobile
max:
NVIDIA GeForce GTX 1660 Ti Mobile
max:
0 100 200 300 400 500 600 700 800 900 1000 1100 1200 Tooltip
NVIDIA GeForce GTX 1660 Ti Mobile
max:
» With all tested laptops playable in detail settings ultra.
Additional Benchmarks
Low Preset 1920x1080
76.6 [X] MSI GP65 Leopard 9SD Intel Core i7-9750H 2.6GHz
GeForce GTX 1660 Ti Mobile
min:
23.3 fps, P0.1:
24.1 fps, P1:
26.3 fps, max:
318 fps
...
NVIDIA GeForce GTX 1660 Ti Mobile
...
max:
...
NVIDIA GeForce GTX 1660 Ti Mobile
...
max:
...
NVIDIA GeForce GTX 1660 Ti Mobile
...
max:
NVIDIA GeForce GTX 1660 Ti Mobile
...
max:
NVIDIA GeForce GTX 1660 Ti Mobile
max:
» With all tested laptops playable in detail settings ultra.
Additional Benchmarks
Low Preset 1920x1080
90 [X] MSI GP65 Leopard 9SD Intel Core i7-9750H 2.6GHz
GeForce GTX 1660 Ti Mobile
min:
62 fps
...
NVIDIA GeForce GTX 1660 Ti Mobile
...
max:
...
NVIDIA GeForce GTX 1660 Ti Mobile
...
max:
...
NVIDIA GeForce GTX 1660 Ti Mobile
...
max:
NVIDIA GeForce GTX 1660 Ti Mobile
...
max:
NVIDIA GeForce GTX 1660 Ti Mobile
...
max:
» With all tested laptops playable in detail settings ultra.
Additional Benchmarks
Low Preset 1920x1080
94 [X] MSI GP65 Leopard 9SD Intel Core i7-9750H 2.6GHz
GeForce GTX 1660 Ti Mobile
min:
62 fps
...
NVIDIA GeForce GTX 1660 Ti Mobile
...
...
NVIDIA GeForce GTX 1660 Ti Mobile
...
...
NVIDIA GeForce GTX 1660 Ti Mobile
...
NVIDIA GeForce GTX 1660 Ti Mobile
...
NVIDIA GeForce GTX 1660 Ti Mobile
max:
» With all tested laptops playable in detail settings ultra.
Additional Benchmarks
Low Preset (DX12) 1920x1080
197 [X] MSI GP65 Leopard 9SD Intel Core i7-9750H 2.6GHz
GeForce GTX 1660 Ti Mobile
min:
24.8 fps, P0.1:
96.1 fps, P1:
124 fps, max:
379 fps
...
NVIDIA GeForce GTX 1660 Ti Mobile
...
max:
...
NVIDIA GeForce GTX 1660 Ti Mobile
...
max:
...
NVIDIA GeForce GTX 1660 Ti Mobile
...
max:
NVIDIA GeForce GTX 1660 Ti Mobile
...
max:
» With all tested laptops playable in detail settings ultra.
Additional Benchmarks
Low Graphics Quality 1920x1080
102 [X] MSI GP65 Leopard 9SD Intel Core i7-9750H 2.6GHz
GeForce GTX 1660 Ti Mobile
min:
60 fps
...
NVIDIA GeForce GTX 1660 Ti Mobile
...
...
NVIDIA GeForce GTX 1660 Ti Mobile
...
max:
NVIDIA GeForce GTX 1660 Ti Mobile
max:
NVIDIA GeForce GTX 1660 Ti Mobile
...
max:
» With all tested laptops playable in detail settings high.
Additional Benchmarks
Low Preset 1920x1080
92.8 [X] MSI GP65 Leopard 9SD Intel Core i7-9750H 2.6GHz
GeForce GTX 1660 Ti Mobile
min:
10.4 fps, P0.1:
22 fps, P1:
54.4 fps, max:
227 fps
0 100 200 300 400 500 600 700 800 900 Tooltip
...
NVIDIA GeForce GTX 1660 Ti Mobile
...
NVIDIA GeForce GTX 1660 Ti Mobile
max:
...
NVIDIA GeForce GTX 1660 Ti Mobile
max:
NVIDIA GeForce GTX 1660 Ti Mobile
max:
NVIDIA GeForce GTX 1660 Ti Mobile
max:
» With all tested laptops playable in detail settings ultra.
Additional Benchmarks
Low Rendering Quality 1920x1080
227 [X] MSI GP65 Leopard 9SD Intel Core i7-9750H 2.6GHz
GeForce GTX 1660 Ti Mobile
min:
19.1 fps, P0.1:
138 fps, P1:
164 fps, max:
299 fps
0 100 200 300 400 500 600 700 800 900 1000 Tooltip
...
NVIDIA GeForce GTX 1660 Ti Mobile
...
max:
...
NVIDIA GeForce GTX 1660 Ti Mobile
...
max:
...
NVIDIA GeForce GTX 1660 Ti Mobile
...
max:
NVIDIA GeForce GTX 1660 Ti Mobile
max:
NVIDIA GeForce GTX 1660 Ti Mobile
max:
» With all tested laptops playable in detail settings ultra.
Additional Benchmarks
Low Video Quality 1920x1080
66.8 [X] MSI GP65 Leopard 9SD Intel Core i7-9750H 2.6GHz
GeForce GTX 1660 Ti Mobile
min:
26.8 fps, P0.1:
29.3 fps, P1:
35.1 fps, max:
146 fps
...
NVIDIA GeForce GTX 1660 Ti Mobile
...
0 100 200 300 400 500 600 700 800 900 1000 1100 1200 1300 1400 1500 1600 1700 1800 1900 2000 2100 2200 2300 2400 2500 2600 2700 2800 2900 3000 3100 3200 3300 3400 3500 3600 3700 3800 3900 4000 4100 4200 4300 4400 4500 4600 4700 4800 4900 5000 5100 5200 5300 5400 5500 5600 5700 5800 5900 6000 6100 6200 6300 6400 6500 6600 6700 6800 6900 7000 7100 7200 7300 7400 7500 7600 7700 7800 7900 8000 8100 8200 8300 Tooltip
...
NVIDIA GeForce GTX 1660 Ti Mobile
...
0 100 200 300 400 500 600 700 800 900 1000 1100 1200 1300 Tooltip
...
NVIDIA GeForce GTX 1660 Ti Mobile
...
NVIDIA GeForce GTX 1660 Ti Mobile
NVIDIA GeForce GTX 1660 Ti Mobile
max:
» With all tested laptops playable in detail settings ultra.
Additional Benchmarks
Low Preset 1920x1080
92.8 [X] MSI GP65 Leopard 9SD Intel Core i7-9750H 2.6GHz
GeForce GTX 1660 Ti Mobile
min:
15.6 fps, P0.1:
18.5 fps, P1:
74.8 fps, max:
139 fps
...
NVIDIA GeForce GTX 1660 Ti Mobile
...
max:
...
NVIDIA GeForce GTX 1660 Ti Mobile
...
max:
» With all tested laptops playable in detail settings high.
Additional Benchmarks
Ultra Low Preset 1920x1080
181 [X] MSI GP65 Leopard 9SD Intel Core i7-9750H 2.6GHz
GeForce GTX 1660 Ti Mobile
min:
157 fps
...
NVIDIA GeForce GTX 1660 Ti Mobile
...
max:
...
NVIDIA GeForce GTX 1660 Ti Mobile
max:
...
NVIDIA GeForce GTX 1660 Ti Mobile
...
max:
NVIDIA GeForce GTX 1660 Ti Mobile
max:
» With all tested laptops playable in detail settings high.
Additional Benchmarks
Low Preset 1920x1080
136 [X] MSI GP65 Leopard 9SD Intel Core i7-9750H 2.6GHz
GeForce GTX 1660 Ti Mobile
min:
72.7 fps, P0.1:
95 fps, P1:
112 fps, max:
161 fps
...
NVIDIA GeForce GTX 1660 Ti Mobile
...
...
NVIDIA GeForce GTX 1660 Ti Mobile
...
...
NVIDIA GeForce GTX 1660 Ti Mobile
...
max:
0 100 200 300 400 500 600 700 800 900 1000 1100 1200 1300 1400 Tooltip
...
NVIDIA GeForce GTX 1660 Ti Mobile
...
max:
NVIDIA GeForce GTX 1660 Ti Mobile
max:
» With all tested laptops playable in detail settings ultra.
Additional Benchmarks
Low Preset 1920x1080
114 [X] MSI GP65 Leopard 9SD Intel Core i7-9750H 2.6GHz
GeForce GTX 1660 Ti Mobile
min:
25.4 fps, P0.1:
41.6 fps, P1:
67.5 fps, max:
264 fps
...
NVIDIA GeForce GTX 1660 Ti Mobile
...
NVIDIA GeForce GTX 1660 Ti Mobile
...
NVIDIA GeForce GTX 1660 Ti Mobile
NVIDIA GeForce GTX 1660 Ti Mobile
max:
» With all tested laptops playable in detail settings ultra.
...
NVIDIA GeForce GTX 1660 Ti Mobile
...
max:
...
NVIDIA GeForce GTX 1660 Ti Mobile
...
max:
...
NVIDIA GeForce GTX 1660 Ti Mobile
...
NVIDIA GeForce GTX 1660 Ti Mobile
...
max:
0 100 200 300 400 500 600 700 800 900 1000 1100 Tooltip
NVIDIA GeForce GTX 1660 Ti Mobile
max:
» With all tested laptops playable in detail settings ultra.
Additional Benchmarks
Prioritize Performance Preset 1920x1080
111 [X] MSI GP65 Leopard 9SD Intel Core i7-9750H 2.6GHz
GeForce GTX 1660 Ti Mobile
min:
70.4 fps, P0.1:
74.1 fps, P1:
82.4 fps, max:
145 fps
...
NVIDIA GeForce GTX 1660 Ti Mobile
...
max:
...
NVIDIA GeForce GTX 1660 Ti Mobile
...
max:
...
NVIDIA GeForce GTX 1660 Ti Mobile
...
max:
...
NVIDIA GeForce GTX 1660 Ti Mobile
...
max:
NVIDIA GeForce GTX 1660 Ti Mobile
max:
» With all tested laptops playable in detail settings ultra.
Additional Benchmarks
Low Preset 1920x1080
111 [X] MSI GP65 Leopard 9SD Intel Core i7-9750H 2.6GHz
GeForce GTX 1660 Ti Mobile
min:
28.2 fps, P0.1:
31 fps, P1:
48.5 fps, max:
202 fps
...
NVIDIA GeForce GTX 1660 Ti Mobile
...
max:
...
NVIDIA GeForce GTX 1660 Ti Mobile
...
max:
...
NVIDIA GeForce GTX 1660 Ti Mobile
...
max:
...
NVIDIA GeForce GTX 1660 Ti Mobile
...
max:
NVIDIA GeForce GTX 1660 Ti Mobile
...
max:
» With all tested laptops playable in detail settings ultra.
Additional Benchmarks
Minimum Settings 1920x1080
159 [X] MSI GP65 Leopard 9SD Intel Core i7-9750H 2.6GHz
GeForce GTX 1660 Ti Mobile
min:
75 fps
...
NVIDIA GeForce GTX 1660 Ti Mobile
...
max:
...
NVIDIA GeForce GTX 1660 Ti Mobile
...
max:
...
NVIDIA GeForce GTX 1660 Ti Mobile
...
max:
NVIDIA GeForce GTX 1660 Ti Mobile
...
max:
NVIDIA GeForce GTX 1660 Ti Mobile
...
max:
» With all tested laptops playable in detail settings ultra.
Additional Benchmarks
Low Preset 1920x1080
70.4 [X] MSI GP65 Leopard 9SD Intel Core i7-9750H 2.6GHz
GeForce GTX 1660 Ti Mobile
min:
16.5 fps, P0.1:
45 fps, P1:
58.1 fps, max:
98.8 fps
Ray Tracing Ultra Preset (DLSS off) 1920x1080
6 [X] MSI GP65 Leopard 9SD Intel Core i7-9750H 2.6GHz
GeForce GTX 1660 Ti Mobile
min:
2.85 fps, P0.1:
2.94 fps, P1:
3.12 fps, max:
51 fps
...
NVIDIA GeForce GTX 1660 Ti Mobile
...
max:
...
NVIDIA GeForce GTX 1660 Ti Mobile
...
max:
...
NVIDIA GeForce GTX 1660 Ti Mobile
...
max:
...
NVIDIA GeForce GTX 1660 Ti Mobile
...
max:
NVIDIA GeForce GTX 1660 Ti Mobile
...
max:
» With all tested laptops playable in detail settings ultra.
0 100 200 300 400 500 600 700 800 Tooltip
...
NVIDIA GeForce GTX 1660 Ti Mobile
...
...
NVIDIA GeForce GTX 1660 Ti Mobile
...
...
NVIDIA GeForce GTX 1660 Ti Mobile
...
0 100 200 300 400 500 600 700 800 900 1000 1100 1200 1300 Tooltip
NVIDIA GeForce GTX 1660 Ti Mobile
...
NVIDIA GeForce GTX 1660 Ti Mobile
...
max:
» With all tested laptops playable in detail settings ultra.
...
NVIDIA GeForce GTX 1660 Ti Mobile
max:
...
NVIDIA GeForce GTX 1660 Ti Mobile
max:
...
NVIDIA GeForce GTX 1660 Ti Mobile
max:
NVIDIA GeForce GTX 1660 Ti Mobile
...
max:
NVIDIA GeForce GTX 1660 Ti Mobile
max:
» With all tested laptops playable in detail settings ultra.
Additional Benchmarks
Highest Settings + Ultra Ray Tracing 1920x1080
21.3 [X] MSI GP65 Leopard 9SD Intel Core i7-9750H 2.6GHz
GeForce GTX 1660 Ti Mobile
min:
16.1 fps, P0.1:
16.8 fps, P1:
18 fps, max:
32.9 fps
...
NVIDIA GeForce GTX 1660 Ti Mobile
...
max:
...
NVIDIA GeForce GTX 1660 Ti Mobile
...
max:
...
NVIDIA GeForce GTX 1660 Ti Mobile
...
max:
...
NVIDIA GeForce GTX 1660 Ti Mobile
...
max:
NVIDIA GeForce GTX 1660 Ti Mobile
...
max:
» With all tested laptops playable in detail settings ultra.
74.5 [X] MSI GP65 Leopard 9SD Intel Core i7-9750H 2.6GHz
GeForce GTX 1660 Ti Mobile
min:
41.6 fps, P0.1:
60.1 fps, P1:
63.6 fps, max:
129 fps
fps
+ Compare
- Hide Comparison
...
NVIDIA GeForce GTX 1660 Ti Mobile
...
max:
56.4 [X] MSI GP65 Leopard 9SD Intel Core i7-9750H 2.6GHz
GeForce GTX 1660 Ti Mobile
min:
27.4 fps, P0.1:
42.7 fps, P1:
46.8 fps, max:
73.9 fps
fps
+ Compare
- Hide Comparison
...
NVIDIA GeForce GTX 1660 Ti Mobile
...
max:
32.5 [X] MSI GP65 Leopard 9SD Intel Core i7-9750H 2.6GHz
GeForce GTX 1660 Ti Mobile
min:
24.7 fps, P0.1:
25.3 fps, P1:
26.6 fps, max:
44.4 fps
fps
+ Compare
- Hide Comparison
...
NVIDIA GeForce GTX 1660 Ti Mobile
...
max:
28 [X] MSI GP65 Leopard 9SD Intel Core i7-9750H 2.6GHz
GeForce GTX 1660 Ti Mobile
min:
19.5 fps, P0.1:
22 fps, P1:
23.5 fps, max:
34.9 fps
fps
+ Compare
- Hide Comparison
NVIDIA GeForce GTX 1660 Ti Mobile
...
max:
20.4 [X] MSI GP65 Leopard 9SD Intel Core i7-9750H 2.6GHz
GeForce GTX 1660 Ti Mobile
min:
12.8 fps, P0.1:
15.2 fps, P1:
17.4 fps, max:
24 fps
fps
+ Compare
- Hide Comparison
NVIDIA GeForce GTX 1660 Ti Mobile
...
max:
» With all tested laptops playable in detail settings high.
...
NVIDIA GeForce GTX 1660 Ti Mobile
...
max:
...
NVIDIA GeForce GTX 1660 Ti Mobile
...
max:
...
NVIDIA GeForce GTX 1660 Ti Mobile
...
max:
...
NVIDIA GeForce GTX 1660 Ti Mobile
...
max:
NVIDIA GeForce GTX 1660 Ti Mobile
...
max:
» With all tested laptops playable in detail settings high.
Additional Benchmarks
Ultra Preset + Ultra Ray Tracing (DX12) 1920x1080
14.5 [X] MSI GP65 Leopard 9SD Intel Core i7-9750H 2.6GHz
GeForce GTX 1660 Ti Mobile
min:
7.74 fps, P1:
10.09 fps, max:
21.99 fps
0 100 200 300 400 Tooltip 1.5.4.5: Ø235 (194.137-421)
...
NVIDIA GeForce GTX 1660 Ti Mobile
max:
0 100 200 Tooltip 1.5.4.5: Ø232 (210.405-294.5)
...
NVIDIA GeForce GTX 1660 Ti Mobile
max:
0 100 200 Tooltip 1.5.4.5: Ø216 (205.281-239.5)
...
NVIDIA GeForce GTX 1660 Ti Mobile
max:
0 100 200 Tooltip 1.5.4.5: Ø213 (194.878-280.3)
...
NVIDIA GeForce GTX 1660 Ti Mobile
max:
0 100 200 Tooltip 1.5.4.5: Ø209 (195.35-237.1)
...
NVIDIA GeForce GTX 1660 Ti Mobile
max:
0 100 Tooltip 1.5.4.5: Ø139.6 (133.085-159.8)
...
NVIDIA GeForce GTX 1660 Ti Mobile
max:
» With all tested laptops playable in detail settings ultra.
0 100 200 Tooltip 1.5.4.5: Ø239 (189.18-269.4)
...
NVIDIA GeForce GTX 1660 Ti Mobile
max:
0 100 200 300 400 Tooltip 1.5.4.5: Ø233 (192.142-453)
...
NVIDIA GeForce GTX 1660 Ti Mobile
max:
0 100 200 Tooltip 1.5.4.5: Ø189.2 (158.552-229.1)
...
NVIDIA GeForce GTX 1660 Ti Mobile
...
max:
0 100 200 Tooltip 1.5.4.5: Ø171.2 (144.316-213.7)
...
NVIDIA GeForce GTX 1660 Ti Mobile
...
max:
0 100 Tooltip 1.5.4.5: Ø110.4 (94.034-151)
...
NVIDIA GeForce GTX 1660 Ti Mobile
...
max:
0 100 Tooltip 1.5.4.5: Ø66.1 (53.006-158.5)
...
NVIDIA GeForce GTX 1660 Ti Mobile
...
max:
» With all tested laptops playable in detail settings ultra.
0 100 200 Tooltip 1.5.4.5: Ø124.2 (94.384-224)
...
NVIDIA GeForce GTX 1660 Ti Mobile
max:
0 Tooltip 1.5.4.5: Ø81.2 (72.337-95.1)
...
NVIDIA GeForce GTX 1660 Ti Mobile
...
max:
0 Tooltip 1.5.4.5: Ø72.9 (64.095-86.8)
...
NVIDIA GeForce GTX 1660 Ti Mobile
...
max:
0 Tooltip 1.5.4.5: Ø49.1 (44.569-67.9)
...
NVIDIA GeForce GTX 1660 Ti Mobile
...
max:
0 100 Tooltip 1.5.4.5: Ø30.1 (22.048-160)
NVIDIA GeForce GTX 1660 Ti Mobile
...
max:
» With all tested laptops playable in detail settings high.
...
NVIDIA GeForce GTX 1660 Ti Mobile
...
max:
...
NVIDIA GeForce GTX 1660 Ti Mobile
...
max:
...
NVIDIA GeForce GTX 1660 Ti Mobile
...
max:
...
NVIDIA GeForce GTX 1660 Ti Mobile
...
max:
...
NVIDIA GeForce GTX 1660 Ti Mobile
...
max:
» With all tested laptops playable in detail settings ultra.
...
NVIDIA GeForce GTX 1660 Ti Mobile
...
max:
...
NVIDIA GeForce GTX 1660 Ti Mobile
...
max:
...
NVIDIA GeForce GTX 1660 Ti Mobile
...
max:
NVIDIA GeForce GTX 1660 Ti Mobile
...
max:
NVIDIA GeForce GTX 1660 Ti Mobile
...
max:
» With all tested laptops playable in detail settings ultra.
0 Tooltip 1.5.4.5: Ø72.7 (6.72-97.1)
...
NVIDIA GeForce GTX 1660 Ti Mobile
...
0 Tooltip 1.5.4.5: Ø56.9 (6.31-74.9)
...
NVIDIA GeForce GTX 1660 Ti Mobile
...
0 Tooltip 1.5.4.5: Ø41.3 (7.43-57.9)
...
NVIDIA GeForce GTX 1660 Ti Mobile
...
0 Tooltip 1.5.4.5: Ø28.2 (10.7-44.8)
...
NVIDIA GeForce GTX 1660 Ti Mobile
...
0 Tooltip 1.5.4.5: Ø20.6 (13.8-38.4)
NVIDIA GeForce GTX 1660 Ti Mobile
...
0 Tooltip 1.5.4.5: Ø11.6 (7.82-25.7)
NVIDIA GeForce GTX 1660 Ti Mobile
...
» With all tested laptops playable in detail settings high.
...
NVIDIA GeForce GTX 1660 Ti Mobile
...
max:
...
NVIDIA GeForce GTX 1660 Ti Mobile
...
max:
...
NVIDIA GeForce GTX 1660 Ti Mobile
...
max:
...
NVIDIA GeForce GTX 1660 Ti Mobile
...
max:
...
NVIDIA GeForce GTX 1660 Ti Mobile
...
max:
NVIDIA GeForce GTX 1660 Ti Mobile
...
max:
» With all tested laptops playable in detail settings ultra.
...
NVIDIA GeForce GTX 1660 Ti Mobile
...
max:
...
NVIDIA GeForce GTX 1660 Ti Mobile
...
max:
...
NVIDIA GeForce GTX 1660 Ti Mobile
...
max:
...
NVIDIA GeForce GTX 1660 Ti Mobile
...
max:
...
NVIDIA GeForce GTX 1660 Ti Mobile
...
max:
NVIDIA GeForce GTX 1660 Ti Mobile
...
max:
» With all tested laptops playable in detail settings ultra.
...
NVIDIA GeForce GTX 1660 Ti Mobile
...
max:
...
NVIDIA GeForce GTX 1660 Ti Mobile
...
max:
...
NVIDIA GeForce GTX 1660 Ti Mobile
...
max:
...
NVIDIA GeForce GTX 1660 Ti Mobile
...
max:
...
NVIDIA GeForce GTX 1660 Ti Mobile
...
max:
...
NVIDIA GeForce GTX 1660 Ti Mobile
...
max:
» With all tested laptops playable in detail settings ultra.
...
NVIDIA GeForce GTX 1660 Ti Mobile
max:
...
NVIDIA GeForce GTX 1660 Ti Mobile
max:
...
NVIDIA GeForce GTX 1660 Ti Mobile
max:
...
NVIDIA GeForce GTX 1660 Ti Mobile
max:
...
NVIDIA GeForce GTX 1660 Ti Mobile
» With all tested laptops playable in detail settings high.
...
NVIDIA GeForce GTX 1660 Ti Mobile
...
max:
...
NVIDIA GeForce GTX 1660 Ti Mobile
...
max:
...
NVIDIA GeForce GTX 1660 Ti Mobile
...
max:
...
NVIDIA GeForce GTX 1660 Ti Mobile
...
max:
...
NVIDIA GeForce GTX 1660 Ti Mobile
...
max:
NVIDIA GeForce GTX 1660 Ti Mobile
...
max:
» With all tested laptops playable in detail settings ultra.
...
NVIDIA GeForce GTX 1660 Ti Mobile
...
max:
...
NVIDIA GeForce GTX 1660 Ti Mobile
...
max:
...
NVIDIA GeForce GTX 1660 Ti Mobile
...
max:
...
NVIDIA GeForce GTX 1660 Ti Mobile
...
max:
NVIDIA GeForce GTX 1660 Ti Mobile
...
max:
NVIDIA GeForce GTX 1660 Ti Mobile
...
max:
» With all tested laptops playable in detail settings ultra.
...
NVIDIA GeForce GTX 1660 Ti Mobile
...
...
NVIDIA GeForce GTX 1660 Ti Mobile
...
...
NVIDIA GeForce GTX 1660 Ti Mobile
...
...
NVIDIA GeForce GTX 1660 Ti Mobile
...
max:
NVIDIA GeForce GTX 1660 Ti Mobile
...
max:
» With all tested laptops playable in detail settings high.
...
NVIDIA GeForce GTX 1660 Ti Mobile
...
NVIDIA GeForce GTX 1660 Ti Mobile
...
max:
...
NVIDIA GeForce GTX 1660 Ti Mobile
...
max:
...
NVIDIA GeForce GTX 1660 Ti Mobile
...
NVIDIA GeForce GTX 1660 Ti Mobile
...
max:
NVIDIA GeForce GTX 1660 Ti Mobile
...
max:
» With all tested laptops playable in detail settings ultra.
...
NVIDIA GeForce GTX 1660 Ti Mobile
...
max:
...
NVIDIA GeForce GTX 1660 Ti Mobile
...
max:
...
NVIDIA GeForce GTX 1660 Ti Mobile
...
max:
...
NVIDIA GeForce GTX 1660 Ti Mobile
...
max:
NVIDIA GeForce GTX 1660 Ti Mobile
...
max:
NVIDIA GeForce GTX 1660 Ti Mobile
...
max:
» With all tested laptops playable in detail settings high.
...
NVIDIA GeForce GTX 1660 Ti Mobile
max:
...
NVIDIA GeForce GTX 1660 Ti Mobile
...
max:
...
NVIDIA GeForce GTX 1660 Ti Mobile
...
max:
...
NVIDIA GeForce GTX 1660 Ti Mobile
...
max:
...
NVIDIA GeForce GTX 1660 Ti Mobile
...
max:
» With all tested laptops playable in detail settings ultra.
...
NVIDIA GeForce GTX 1660 Ti Mobile
max:
...
NVIDIA GeForce GTX 1660 Ti Mobile
...
max:
...
NVIDIA GeForce GTX 1660 Ti Mobile
...
max:
...
NVIDIA GeForce GTX 1660 Ti Mobile
...
max:
...
NVIDIA GeForce GTX 1660 Ti Mobile
...
max:
...
NVIDIA GeForce GTX 1660 Ti Mobile
...
max:
» With all tested laptops playable in detail settings ultra.
Additional Benchmarks
Maximum Settings with Raytracing T2X Filmic SMAA 1920x1080
37.8 [X] MSI GP65 Leopard 9SD Intel Core i7-9750H 2.6GHz
GeForce GTX 1660 Ti Mobile
min:
24 fps
...
NVIDIA GeForce GTX 1660 Ti Mobile
...
NVIDIA GeForce GTX 1660 Ti Mobile
max:
...
NVIDIA GeForce GTX 1660 Ti Mobile
...
max:
...
NVIDIA GeForce GTX 1660 Ti Mobile
...
max:
...
NVIDIA GeForce GTX 1660 Ti Mobile
...
max:
...
NVIDIA GeForce GTX 1660 Ti Mobile
...
max:
» With all tested laptops playable in detail settings ultra.
...
NVIDIA GeForce GTX 1660 Ti Mobile
...
NVIDIA GeForce GTX 1660 Ti Mobile
...
max:
...
NVIDIA GeForce GTX 1660 Ti Mobile
...
max:
...
NVIDIA GeForce GTX 1660 Ti Mobile
...
max:
NVIDIA GeForce GTX 1660 Ti Mobile
...
max:
NVIDIA GeForce GTX 1660 Ti Mobile
...
max:
» With all tested laptops playable in detail settings ultra.
...
NVIDIA GeForce GTX 1660 Ti Mobile
...
NVIDIA GeForce GTX 1660 Ti Mobile
max:
...
NVIDIA GeForce GTX 1660 Ti Mobile
...
max:
...
NVIDIA GeForce GTX 1660 Ti Mobile
max:
...
NVIDIA GeForce GTX 1660 Ti Mobile
...
NVIDIA GeForce GTX 1660 Ti Mobile
max:
» With all tested laptops playable in detail settings ultra.
...
NVIDIA GeForce GTX 1660 Ti Mobile
...
max:
...
NVIDIA GeForce GTX 1660 Ti Mobile
...
max:
...
NVIDIA GeForce GTX 1660 Ti Mobile
...
max:
...
NVIDIA GeForce GTX 1660 Ti Mobile
...
max:
...
NVIDIA GeForce GTX 1660 Ti Mobile
...
max:
...
NVIDIA GeForce GTX 1660 Ti Mobile
...
max:
» With all tested laptops playable in detail settings ultra.
...
NVIDIA GeForce GTX 1660 Ti Mobile
...
max:
...
NVIDIA GeForce GTX 1660 Ti Mobile
...
max:
...
NVIDIA GeForce GTX 1660 Ti Mobile
...
max:
...
NVIDIA GeForce GTX 1660 Ti Mobile
...
max:
...
NVIDIA GeForce GTX 1660 Ti Mobile
...
max:
» With all tested laptops playable in detail settings high.
Additional Benchmarks
High Quality Preset & High Ray Tracing Preset (DX12) 1920x1080
18.2 [X] MSI GP65 Leopard 9SD Intel Core i7-9750H 2.6GHz
GeForce GTX 1660 Ti Mobile
min:
15 fps
181 193 [X] SCHENKER XMG Core 17 Overboost-Profil
Intel Core i7-9750H 2.6GHz
GeForce GTX 1660 Ti Mobile
210 230 [X] MSI GP65 Leopard 9SD Intel Core i7-9750H 2.6GHz
GeForce GTX 1660 Ti Mobile
min:
180 fps
~ 204 fps
+ Compare
- Hide Comparison
...
NVIDIA GeForce GTX 1660 Ti Mobile
max:
141 [X] SCHENKER XMG Core 17 Overboost-Profil
Intel Core i7-9750H 2.6GHz
GeForce GTX 1660 Ti Mobile
144 154 157 [X] MSI GP65 Leopard 9SD Intel Core i7-9750H 2.6GHz
GeForce GTX 1660 Ti Mobile
min:
136 fps
~ 149 fps
+ Compare
- Hide Comparison
...
NVIDIA GeForce GTX 1660 Ti Mobile
...
121 [X] SCHENKER XMG Core 17 Overboost-Profil
Intel Core i7-9750H 2.6GHz
GeForce GTX 1660 Ti Mobile
122 131 141 [X] MSI GP65 Leopard 9SD Intel Core i7-9750H 2.6GHz
GeForce GTX 1660 Ti Mobile
min:
128 fps
~ 129 fps
+ Compare
- Hide Comparison
...
NVIDIA GeForce GTX 1660 Ti Mobile
...
91 92 93 [X] MSI GP65 Leopard 9SD Intel Core i7-9750H 2.6GHz
GeForce GTX 1660 Ti Mobile
min:
83 fps
99 [X] SCHENKER XMG Core 17 Overboost-Profil
Intel Core i7-9750H 2.6GHz
GeForce GTX 1660 Ti Mobile
~ 94 fps
+ Compare
- Hide Comparison
...
NVIDIA GeForce GTX 1660 Ti Mobile
...
...
NVIDIA GeForce GTX 1660 Ti Mobile
...
...
NVIDIA GeForce GTX 1660 Ti Mobile
...
max:
» With all tested laptops playable in detail settings ultra.
...
NVIDIA GeForce GTX 1660 Ti Mobile
...
max:
...
NVIDIA GeForce GTX 1660 Ti Mobile
...
max:
...
NVIDIA GeForce GTX 1660 Ti Mobile
...
max:
...
NVIDIA GeForce GTX 1660 Ti Mobile
...
max:
» With all tested laptops playable in detail settings ultra.
...
NVIDIA GeForce GTX 1660 Ti Mobile
max:
...
NVIDIA GeForce GTX 1660 Ti Mobile
...
max:
...
NVIDIA GeForce GTX 1660 Ti Mobile
...
max:
...
NVIDIA GeForce GTX 1660 Ti Mobile
...
max:
» With all tested laptops playable in detail settings ultra.
...
NVIDIA GeForce GTX 1660 Ti Mobile
max:
Intel Arc A580
...
NVIDIA GeForce GTX 1660 Ti Mobile
max:
...
NVIDIA GeForce GTX 1660 Ti Mobile
...
max:
...
NVIDIA GeForce GTX 1660 Ti Mobile
...
max:
...
NVIDIA GeForce GTX 1660 Ti Mobile
...
max:
...
NVIDIA GeForce GTX 1660 Ti Mobile
...
max:
» With most tested laptops playable in detail settings ultra.
...
NVIDIA GeForce GTX 1660 Ti Mobile
...
max:
...
NVIDIA GeForce GTX 1660 Ti Mobile
...
max:
...
NVIDIA GeForce GTX 1660 Ti Mobile
...
max:
...
NVIDIA GeForce GTX 1660 Ti Mobile
...
max:
...
NVIDIA GeForce GTX 1660 Ti Mobile
...
max:
» With all tested laptops playable in detail settings ultra.
...
NVIDIA GeForce GTX 1660 Ti Mobile
...
max:
...
NVIDIA GeForce GTX 1660 Ti Mobile
...
...
NVIDIA GeForce GTX 1660 Ti Mobile
...
max:
...
NVIDIA GeForce GTX 1660 Ti Mobile
...
max:
» With all tested laptops playable in detail settings ultra.
...
NVIDIA GeForce GTX 1660 Ti Mobile
...
NVIDIA GeForce GTX 1660 Ti Mobile
max:
...
NVIDIA GeForce GTX 1660 Ti Mobile
max:
...
NVIDIA GeForce GTX 1660 Ti Mobile
max:
...
NVIDIA GeForce GTX 1660 Ti Mobile
max:
» With all tested laptops playable in detail settings ultra.
0 100 Tooltip Aspire Nitro 5 AN517-51-7887: Ø104.5 (59-156)
Omen 15-ek0456ng: Ø105.9 (82-146)
...
NVIDIA GeForce GTX 1660 Ti Mobile
...
max:
0 100 Tooltip Aspire Nitro 5 AN517-51-7887: Ø86.6 (53-109)
Omen 15-ek0456ng: Ø88.2 (72-113)
...
NVIDIA GeForce GTX 1660 Ti Mobile
...
max:
0 100 Tooltip Aspire Nitro 5 AN517-51-7887: Ø83.2 (65-106)
Omen 15-ek0456ng: Ø84.9 (70-106)
...
NVIDIA GeForce GTX 1660 Ti Mobile
...
max:
0 Tooltip Aspire Nitro 5 AN517-51-7887: Ø74.4 (55-100)
Omen 15-ek0456ng: Ø76.3 (58-100)
...
NVIDIA GeForce GTX 1660 Ti Mobile
...
max:
0 Tooltip Aspire Nitro 5 AN517-51-7887: Ø59.8 (50-75)
...
NVIDIA GeForce GTX 1660 Ti Mobile
...
max:
0 Tooltip Aspire Nitro 5 AN517-51-7887: Ø32.1 (26-40)
...
NVIDIA GeForce GTX 1660 Ti Mobile
...
max:
» With all tested laptops playable in detail settings ultra.
...
NVIDIA GeForce GTX 1660 Ti Mobile
...
max:
...
NVIDIA GeForce GTX 1660 Ti Mobile
...
max:
...
NVIDIA GeForce GTX 1660 Ti Mobile
...
max:
...
NVIDIA GeForce GTX 1660 Ti Mobile
...
max:
...
NVIDIA GeForce GTX 1660 Ti Mobile
...
max:
...
NVIDIA GeForce GTX 1660 Ti Mobile
...
max:
» With all tested laptops playable in detail settings ultra.
...
NVIDIA GeForce GTX 1660 Ti Mobile
...
...
NVIDIA GeForce GTX 1660 Ti Mobile
...
...
NVIDIA GeForce GTX 1660 Ti Mobile
...
...
NVIDIA GeForce GTX 1660 Ti Mobile
...
max:
...
NVIDIA GeForce GTX 1660 Ti Mobile
...
max:
» With all tested laptops playable in detail settings ultra.
...
NVIDIA GeForce GTX 1660 Ti Mobile
...
max:
...
NVIDIA GeForce GTX 1660 Ti Mobile
...
max:
...
NVIDIA GeForce GTX 1660 Ti Mobile
...
max:
NVIDIA GeForce GTX 1660 Ti Mobile
...
max:
...
NVIDIA GeForce GTX 1660 Ti Mobile
...
max:
» With all tested laptops playable in detail settings ultra.
...
NVIDIA GeForce GTX 1660 Ti Mobile
...
...
NVIDIA GeForce GTX 1660 Ti Mobile
...
...
NVIDIA GeForce GTX 1660 Ti Mobile
...
max:
NVIDIA GeForce GTX 1660 Ti Mobile
...
max:
...
NVIDIA GeForce GTX 1660 Ti Mobile
...
max:
» With all tested laptops playable in detail settings ultra.
...
NVIDIA GeForce GTX 1660 Ti Mobile
...
max:
...
NVIDIA GeForce GTX 1660 Ti Mobile
...
max:
...
NVIDIA GeForce GTX 1660 Ti Mobile
...
max:
...
NVIDIA GeForce GTX 1660 Ti Mobile
...
max:
...
NVIDIA GeForce GTX 1660 Ti Mobile
...
max:
» With all tested laptops playable in detail settings ultra.
...
NVIDIA GeForce GTX 1660 Ti Mobile
...
max:
...
NVIDIA GeForce GTX 1660 Ti Mobile
max:
...
NVIDIA GeForce GTX 1660 Ti Mobile
...
max:
...
NVIDIA GeForce GTX 1660 Ti Mobile
max:
NVIDIA GeForce GTX 1660 Ti Mobile
max:
» With all tested laptops playable in detail settings ultra.
...
NVIDIA GeForce GTX 1660 Ti Mobile
...
NVIDIA GeForce GTX 1660 Ti Mobile
max:
...
NVIDIA GeForce GTX 1660 Ti Mobile
max:
...
NVIDIA GeForce GTX 1660 Ti Mobile
...
max:
...
NVIDIA GeForce GTX 1660 Ti Mobile
...
max:
» With all tested laptops playable in detail settings ultra.
...
NVIDIA GeForce GTX 1660 Ti Mobile
...
max:
...
NVIDIA GeForce GTX 1660 Ti Mobile
...
max:
...
NVIDIA GeForce GTX 1660 Ti Mobile
...
max:
...
NVIDIA GeForce GTX 1660 Ti Mobile
max:
...
NVIDIA GeForce GTX 1660 Ti Mobile
max:
» With all tested laptops playable in detail settings ultra.
...
NVIDIA GeForce GTX 1660 Ti Mobile
...
max:
...
NVIDIA GeForce GTX 1660 Ti Mobile
...
max:
47 [X] Schenker Compact 15 Intel Core i7-9750H 2.6GHz
GeForce GTX 1660 Ti Mobile
min:
23 fps
59 [X] presample NVIDIA GeForce GTX 1660 Ti (Laptop) GeForce GTX 1660 Ti Mobile
~ 53 fps
+ Compare
- Hide Comparison
...
NVIDIA GeForce GTX 1660 Ti Mobile
...
max:
...
NVIDIA GeForce GTX 1660 Ti Mobile
...
max:
...
NVIDIA GeForce GTX 1660 Ti Mobile
...
max:
» With all tested laptops playable in detail settings ultra.
...
NVIDIA GeForce GTX 1660 Ti Mobile
max:
...
NVIDIA GeForce GTX 1660 Ti Mobile
max:
...
NVIDIA GeForce GTX 1660 Ti Mobile
max:
...
NVIDIA GeForce GTX 1660 Ti Mobile
max:
» With all tested laptops playable in detail settings ultra.
...
NVIDIA GeForce GTX 1660 Ti Mobile
...
NVIDIA GeForce GTX 1660 Ti Mobile
max:
...
NVIDIA GeForce GTX 1660 Ti Mobile
max:
...
NVIDIA GeForce GTX 1660 Ti Mobile
max:
...
NVIDIA GeForce GTX 1660 Ti Mobile
max:
» With all tested laptops playable in detail settings ultra.
...
NVIDIA GeForce GTX 1660 Ti Mobile
...
max:
...
NVIDIA GeForce GTX 1660 Ti Mobile
...
max:
...
NVIDIA GeForce GTX 1660 Ti Mobile
...
max:
...
NVIDIA GeForce GTX 1660 Ti Mobile
...
max:
...
NVIDIA GeForce GTX 1660 Ti Mobile
...
max:
...
NVIDIA GeForce GTX 1660 Ti Mobile
...
max:
» With all tested laptops playable in detail settings ultra.
Additional Benchmarks
Lowest Preset 1920x1080
...
NVIDIA GeForce GTX 1660 Ti Mobile
...
max:
...
NVIDIA GeForce GTX 1660 Ti Mobile
...
max:
...
NVIDIA GeForce GTX 1660 Ti Mobile
...
max:
...
NVIDIA GeForce GTX 1660 Ti Mobile
...
max:
» With all tested laptops playable in detail settings ultra.
...
NVIDIA GeForce GTX 1660 Ti Mobile
max:
...
NVIDIA GeForce GTX 1660 Ti Mobile
max:
...
NVIDIA GeForce GTX 1660 Ti Mobile
max:
...
NVIDIA GeForce GTX 1660 Ti Mobile
max:
...
NVIDIA GeForce GTX 1660 Ti Mobile
...
max:
» With all tested laptops playable in detail settings ultra.
...
NVIDIA GeForce GTX 1660 Ti Mobile
max:
...
NVIDIA GeForce GTX 1660 Ti Mobile
...
max:
...
NVIDIA GeForce GTX 1660 Ti Mobile
...
max:
NVIDIA GeForce GTX 1660 Ti Mobile
...
max:
NVIDIA GeForce GTX 1660 Ti Mobile
...
max:
» With all tested laptops playable in detail settings ultra.
...
NVIDIA GeForce GTX 1660 Ti Mobile
...
...
NVIDIA GeForce GTX 1660 Ti Mobile
...
max:
...
NVIDIA GeForce GTX 1660 Ti Mobile
...
max:
...
NVIDIA GeForce GTX 1660 Ti Mobile
...
max:
...
NVIDIA GeForce GTX 1660 Ti Mobile
max:
» With all tested laptops playable in detail settings ultra.
0 100 Tooltip Aspire Nitro 5 AN517-51-7887: Ø107.5 (49-156)
Omen 15-ek0456ng: Ø124.4 (99-156)
...
NVIDIA GeForce GTX 1660 Ti Mobile
...
max:
0 100 Tooltip Aspire Nitro 5 AN517-51-7887: Ø91.8 (69-110)
Omen 15-ek0456ng: Ø97 (80-109)
...
NVIDIA GeForce GTX 1660 Ti Mobile
...
max:
0 100 Tooltip Aspire Nitro 5 AN517-51-7887: Ø89.6 (69-108)
Omen 15-ek0456ng: Ø90.1 (74-104)
...
NVIDIA GeForce GTX 1660 Ti Mobile
...
max:
0 100 Tooltip Omen 15-ek0456ng: Ø85.2 (73-99)
Aspire Nitro 5 AN517-51-7887: Ø86.6 (77-101)
...
NVIDIA GeForce GTX 1660 Ti Mobile
...
max:
0 Tooltip Aspire Nitro 5 AN517-51-7887: Ø60.2 (54-73)
...
NVIDIA GeForce GTX 1660 Ti Mobile
...
max:
0 Tooltip Aspire Nitro 5 AN517-51-7887: Ø30.9 (27-39)
...
NVIDIA GeForce GTX 1660 Ti Mobile
...
max:
» With all tested laptops playable in detail settings ultra.
...
NVIDIA GeForce GTX 1660 Ti Mobile
...
NVIDIA GeForce GTX 1660 Ti Mobile
...
NVIDIA GeForce GTX 1660 Ti Mobile
max:
» With all tested laptops playable in detail settings ultra.
...
NVIDIA GeForce GTX 1660 Ti Mobile
...
max:
...
NVIDIA GeForce GTX 1660 Ti Mobile
...
max:
...
NVIDIA GeForce GTX 1660 Ti Mobile
...
max:
» With all tested laptops playable in detail settings high.
...
NVIDIA GeForce GTX 1660 Ti Mobile
max:
...
NVIDIA GeForce GTX 1660 Ti Mobile
...
max:
...
NVIDIA GeForce GTX 1660 Ti Mobile
...
max:
...
NVIDIA GeForce GTX 1660 Ti Mobile
...
max:
...
NVIDIA GeForce GTX 1660 Ti Mobile
...
max:
» With all tested laptops playable in detail settings ultra.
...
NVIDIA GeForce GTX 1660 Ti Mobile
...
max:
...
NVIDIA GeForce GTX 1660 Ti Mobile
...
max:
...
NVIDIA GeForce GTX 1660 Ti Mobile
...
max:
...
NVIDIA GeForce GTX 1660 Ti Mobile
...
max:
» With all tested laptops playable in detail settings high.
...
NVIDIA GeForce GTX 1660 Ti Mobile
...
max:
...
NVIDIA GeForce GTX 1660 Ti Mobile
...
max:
» With all tested laptops playable in detail settings ultra.
...
NVIDIA GeForce GTX 1660 Ti Mobile
max:
...
NVIDIA GeForce GTX 1660 Ti Mobile
max:
...
NVIDIA GeForce GTX 1660 Ti Mobile
max:
NVIDIA GeForce GTX 1660 Ti Mobile
max:
...
NVIDIA GeForce GTX 1660 Ti Mobile
max:
» With all tested laptops playable in detail settings ultra.
...
NVIDIA GeForce GTX 1660 Ti Mobile
...
NVIDIA GeForce GTX 1660 Ti Mobile
...
NVIDIA GeForce GTX 1660 Ti Mobile
NVIDIA GeForce GTX 1660 Ti Mobile
max:
NVIDIA GeForce GTX 1660 Ti Mobile
max:
» With all tested laptops playable in detail settings ultra.
...
NVIDIA GeForce GTX 1660 Ti Mobile
max:
...
NVIDIA GeForce GTX 1660 Ti Mobile
max:
...
NVIDIA GeForce GTX 1660 Ti Mobile
max:
NVIDIA GeForce GTX 1660 Ti Mobile
max:
NVIDIA GeForce GTX 1660 Ti Mobile
max:
» With all tested laptops playable in detail settings ultra.
...
NVIDIA GeForce GTX 1660 Ti Mobile
...
max:
...
NVIDIA GeForce GTX 1660 Ti Mobile
...
max:
...
NVIDIA GeForce GTX 1660 Ti Mobile
...
max:
...
NVIDIA GeForce GTX 1660 Ti Mobile
...
max:
» With all tested laptops playable in detail settings ultra.
...
NVIDIA GeForce GTX 1660 Ti Mobile
max:
» With all tested laptops playable in detail settings ultra.
...
NVIDIA GeForce GTX 1660 Ti Mobile
...
...
NVIDIA GeForce GTX 1660 Ti Mobile
max:
...
NVIDIA GeForce GTX 1660 Ti Mobile
...
max:
...
NVIDIA GeForce GTX 1660 Ti Mobile
...
max:
» With all tested laptops playable in detail settings high.
...
NVIDIA GeForce GTX 1660 Ti Mobile
...
NVIDIA GeForce GTX 1660 Ti Mobile
...
NVIDIA GeForce GTX 1660 Ti Mobile
...
...
NVIDIA GeForce GTX 1660 Ti Mobile
...
max:
» With all tested laptops playable in detail settings ultra.
...
NVIDIA GeForce GTX 1660 Ti Mobile
max:
...
NVIDIA GeForce GTX 1660 Ti Mobile
max:
...
NVIDIA GeForce GTX 1660 Ti Mobile
...
max:
...
NVIDIA GeForce GTX 1660 Ti Mobile
...
max:
...
NVIDIA GeForce GTX 1660 Ti Mobile
...
max:
» With all tested laptops playable in detail settings ultra.
...
NVIDIA GeForce GTX 1660 Ti Mobile
max:
...
NVIDIA GeForce GTX 1660 Ti Mobile
...
max:
...
NVIDIA GeForce GTX 1660 Ti Mobile
...
max:
...
NVIDIA GeForce GTX 1660 Ti Mobile
...
max:
...
NVIDIA GeForce GTX 1660 Ti Mobile
...
» With all tested laptops playable in detail settings ultra.
...
NVIDIA GeForce GTX 1660 Ti Mobile
max:
...
NVIDIA GeForce GTX 1660 Ti Mobile
...
max:
...
NVIDIA GeForce GTX 1660 Ti Mobile
...
max:
...
NVIDIA GeForce GTX 1660 Ti Mobile
...
max:
» With all tested laptops playable in detail settings ultra.
...
NVIDIA GeForce GTX 1660 Ti Mobile
max:
...
NVIDIA GeForce GTX 1660 Ti Mobile
...
NVIDIA GeForce GTX 1660 Ti Mobile
max:
» With all tested laptops playable in detail settings ultra.
...
NVIDIA GeForce GTX 1660 Ti Mobile
max:
...
NVIDIA GeForce GTX 1660 Ti Mobile
...
...
NVIDIA GeForce GTX 1660 Ti Mobile
max:
» With all tested laptops playable in detail settings ultra.
...
NVIDIA GeForce GTX 1660 Ti Mobile
...
...
NVIDIA GeForce GTX 1660 Ti Mobile
...
NVIDIA GeForce GTX 1660 Ti Mobile
...
» With all tested laptops playable in detail settings ultra.
...
NVIDIA GeForce GTX 1660 Ti Mobile
...
...
NVIDIA GeForce GTX 1660 Ti Mobile
...
max:
...
NVIDIA GeForce GTX 1660 Ti Mobile
...
max:
» With all tested laptops playable in detail settings ultra.
Additional Benchmarks
Epic (Render Scale 100 %) 16xAF SMAA 2560x1440
92.1 [X] MSI GP65 Leopard 9SD Intel Core i7-9750H 2.6GHz
GeForce GTX 1660 Ti Mobile
min:
79 fps
...
NVIDIA GeForce GTX 1660 Ti Mobile
...
NVIDIA GeForce GTX 1660 Ti Mobile
...
max:
...
NVIDIA GeForce GTX 1660 Ti Mobile
...
max:
» With all tested laptops playable in detail settings ultra.
...
NVIDIA GeForce GTX 1660 Ti Mobile
...
max:
...
NVIDIA GeForce GTX 1660 Ti Mobile
...
max:
...
NVIDIA GeForce GTX 1660 Ti Mobile
...
max:
...
NVIDIA GeForce GTX 1660 Ti Mobile
...
max:
...
NVIDIA GeForce GTX 1660 Ti Mobile
...
max:
» With all tested laptops playable in detail settings ultra.
...
NVIDIA GeForce GTX 1660 Ti Mobile
max:
...
NVIDIA GeForce GTX 1660 Ti Mobile
max:
...
NVIDIA GeForce GTX 1660 Ti Mobile
max:
» With all tested laptops playable in detail settings ultra.
...
NVIDIA GeForce GTX 1660 Ti Mobile
max:
...
NVIDIA GeForce GTX 1660 Ti Mobile
max:
...
NVIDIA GeForce GTX 1660 Ti Mobile
max:
...
NVIDIA GeForce GTX 1660 Ti Mobile
max:
» With all tested laptops playable in detail settings ultra.
...
NVIDIA GeForce GTX 1660 Ti Mobile
...
max:
...
NVIDIA GeForce GTX 1660 Ti Mobile
...
max:
...
NVIDIA GeForce GTX 1660 Ti Mobile
...
max:
...
NVIDIA GeForce GTX 1660 Ti Mobile
...
max:
...
NVIDIA GeForce GTX 1660 Ti Mobile
...
max:
» With all tested laptops playable in detail settings ultra.
...
NVIDIA GeForce GTX 1660 Ti Mobile
...
max:
...
NVIDIA GeForce GTX 1660 Ti Mobile
...
max:
0 100 Tooltip TUF A17 FA706IU-AS76: Ø101.5 (89-108)
...
NVIDIA GeForce GTX 1660 Ti Mobile
...
max:
0 Tooltip Blade 15 GTX 1660 Ti: Ø47 (38-50)
GH7 716IG: Ø52.1 (49-56)
Legion Y540-15IRH-81SX00B2GE: Ø53.1 (50-58)
XMG Core 17: Ø54.5 (52-58)
ROG Strix G GL731GU-RB74: Ø52.2 (48-57)
XMG Core 15 GK5CP6V: Ø55.8 (51-61)
Omen 15-ek0456ng: Ø54 (49-58)
Predator Helios 300 PH315-52-79TY: Ø51.9 (47-58)
Legion Y540-17IRH: Ø55.1 (51-58)
ROG Zephyrus M15 GU502GU-XB74: Ø48.3 (0-51)
Aspire Nitro 5 AN517-51-7887: Ø52.7 (48-62)
GF75 Thin 10SDR: Ø55.9 (52-60)
15-SA: Ø57.9 (4-61)
GP75 Leopard 9SD: Ø58.4 (50-62)
Nightsky Ti15: Ø54.3 (50-59)
GF65 9SD: Ø54.2 (50-59)
Vector 15: Ø52.1 (48-62)
ROG Zephyrus M15 GU502LU-BI7N4: Ø60 (56-64)
...
NVIDIA GeForce GTX 1660 Ti Mobile
...
max:
...
NVIDIA GeForce GTX 1660 Ti Mobile
...
max:
» With all tested laptops playable in detail settings ultra.
...
NVIDIA GeForce GTX 1660 Ti Mobile
...
max:
...
NVIDIA GeForce GTX 1660 Ti Mobile
...
max:
...
NVIDIA GeForce GTX 1660 Ti Mobile
...
max:
...
NVIDIA GeForce GTX 1660 Ti Mobile
...
max:
» With all tested laptops playable in detail settings ultra.
Additional Benchmarks
Normal/Off 4xAF 1920x1080
165 [X] MSI GP65 Leopard 9SD Intel Core i7-9750H 2.6GHz
GeForce GTX 1660 Ti Mobile
min:
4.58 fps, P1:
100 fps, max:
286 fps
Lowest Settings possible 1920x1080
173 [X] MSI GP65 Leopard 9SD Intel Core i7-9750H 2.6GHz
GeForce GTX 1660 Ti Mobile
min:
5.54 fps, P1:
125 fps, max:
270 fps
...
NVIDIA GeForce GTX 1660 Ti Mobile
...
...
NVIDIA GeForce GTX 1660 Ti Mobile
...
...
NVIDIA GeForce GTX 1660 Ti Mobile
...
...
NVIDIA GeForce GTX 1660 Ti Mobile
...
max:
» With all tested laptops playable in detail settings ultra.
For more games that might be playable and a list of all games and graphics cards visit our Gaming List
v1.26
log 17. 04:32:04
#0 no ids found in url (should be separated by "_") +0s ... 0s
#1 not redirecting to Ajax server +0s ... 0s
#2 did not recreate cache, as it is less than 5 days old! Created at Tue, 16 Apr 2024 05:39:00 +0200 +0.001s ... 0.001s
#3 composed specs +0.072s ... 0.073s
#4 did output specs +0s ... 0.073s
#5 start showIntegratedCPUs +0s ... 0.073s
#6 getting avg benchmarks for device 9641 +0.03s ... 0.103s
#7 got single benchmarks 9641 +0.116s ... 0.219s
#8 got avg benchmarks for devices +0s ... 0.219s
#9 min, max, avg, median took s +0.86s ... 1.08s
#10 before gaming benchmark output +0s ... 1.08s
#11 Got 1105 rows for game benchmarks. +0.091s ... 1.17s
#12 composed SQL query for gamebenchmarks +0s ... 1.17s
#13 got data and put it in $dataArray +0.117s ... 1.287s
#14 benchmarks composed for output. +6.124s ... 7.411s
#15 return log +0.064s ... 7.475s
Notebook reviews with NVIDIA GeForce GTX 1660 Ti Mobile graphics card
Asus Zephyrus M15 GU502LU vs. GU502LW: What's The Difference? Turbo mode makes all the difference if you're looking to maximize performance out of either machine. We go over what users can expect from Asus' mid-range gamin...
Intel Core i7-10750H | NVIDIA GeForce GTX 1660 Ti Mobile | 15.60" | 2 kg
MSI GF75 Thin 10SDR Laptop Review: For Budget Gamers According to MSI the GF75 10SDR-253 might become one of this holiday seasons's best-selling notebooks. You get a six-core CPU, a 144 Hz panel, and a GeForce GTX...
Intel Core i7-10750H | NVIDIA GeForce GTX 1660 Ti Mobile | 17.30" | 2.2 kg
HP Omen 15: Gaming laptop with good battery life With the Omen series, HP offers gaming laptops that are directly aimed at gamers. Not only does HP cover the high-end segment here, but it also offers attractiv...
Intel Core i5-10300H | NVIDIA GeForce GTX 1660 Ti Mobile | 15.60" | 2.1 kg
Nexoc GH7 (Clevo NH77DCQ) Review: Gaming laptop with a replaceable battery Due to its rather classic build, the GH7 from Nexoc, which is based on a Clevo barebone, offers a lot of space for maintenance options. While the cooling system...
Intel Core i7-10750H | NVIDIA GeForce GTX 1660 Ti Mobile | 17.30" | 2.5 kg
Asus TUF A17 FA706IU Ryzen 7 Laptop Review: Core i9 Performance for $1100 USD Asus has completely revamped its TUF series from top to bottom and the changes are significant. If you were considering the older FX705/FX505 series, skip it an...
AMD Ryzen 7 4800H | NVIDIA GeForce GTX 1660 Ti Mobile | 17.30" | 2.6 kg
SCHENKER XMG Core 15 GK5CP6V : Intel Core i7-9750H, 15.60", 2 kgReview » Schenker XMG Core 15 (Tongfang GK5CP6V) Laptop Review: Budget Gamer
Maingear Vector 15 : Intel Core i7-9750H, 15.60", 1.9 kgReview » Maingear Vector 15 Laptop Review: Gaming All-rounder
Acer Predator Helios 300 PH315-52-79TY : Intel Core i7-9750H, 15.60", 2.3 kgReview » Acer Predator Helios 300 Laptop Review: A modern gaming laptop with a Turing GPU
Asus ROG Zephyrus M15 GU502GU-XB74 : Intel Core i7-9750H, 15.60", 2 kgReview » Asus Zephyrus M GU502GU Laptop Review: $1800 for Single-Channel RAM
MSI GF65 9SD : Intel Core i7-9750H, 15.60", 1.9 kgReview » MSI GF65 9SD Laptop Review: GeForce GTX 1660 Ti for under $1000
Razer Blade 15 GTX 1660 Ti : Intel Core i7-9750H, 15.60", 2.1 kgReview » No RTX? No Problem — Razer Blade 15 GTX 1660 Ti Base Model Laptop Review
Acer Aspire Nitro 5 AN517-51-7887 : Intel Core i7-9750H, 17.30", 2.8 kgReview » Acer Aspire Nitro 5 Laptop Review: A gaming laptop with decent battery life
Eurocom Nightsky Ti15 : Intel Core i7-9750H, 15.60", 2.5 kgReview » Eurocom Nightsky Ti15 (Clevo PB51RF) Laptop Review
Lenovo Legion Y540-15IRH-81SX00B2GE : Intel Core i7-9750H, 15.60", 2.2 kgReview » Lenovo Legion Y540-15IRH Laptop Review: A good gaming laptop with a GeForce GTX 1660 Ti GPU
Lenovo Legion Y540-17IRH : Intel Core i5-9300H, 17.30", 2.8 kgReview » Lenovo Legion Y540-17IRH in Review: Mid-Range Gamer Makes Full Use of its Core i5
Asus ROG Strix G GL731GU-RB74 : Intel Core i7-9750H, 17.30", 2.9 kgReview » An LED Light Show: Asus ROG Strix G GL731GU Laptop Review
SCHENKER XMG Core 17 : Intel Core i7-9750H, 17.30", 2.5 kgReview » Schenker XMG Core 17 (Core i7-9750H, GeForce GTX 1660 Ti, 144-Hz Display) Tongfang GK7CP6R Laptop Review
MSI GP75 Leopard 9SD : Intel Core i7-9750H, 17.30", 2.6 kgReview » Review of the MSI GP75 Leopard 9SD: Low-priced Gaming Laptop with a 144 Hz Panel
Aorus 15-SA : Intel Core i7-9750H, 15.60", 2.1 kgReview » Gigabyte Aorus 15-SA (Core i7-9750H, GTX 1660 Ti, 144 Hz FHD) Laptop Review
Medion Erazer Deputy P10-MD62132 : Intel Core i5-10300H, 15.60", 2.3 kgExternal Review » Medion Erazer Deputy P10-MD62132
Dell G3 15 3500-WDP8D : Intel Core i7-10750H, 15.60", 2.6 kgExternal Review » Dell G3 15 3500-WDP8D
MSI GS66 Stealth 10SD-614NL : Intel Core i7-10750H, 15.60", 2.1 kgExternal Review » MSI GS66 Stealth 10SD-614NL
Acer Predator Helios 300 PH315-53-70M2 : Intel Core i7-10750H, 15.60", 2.3 kgExternal Review » Acer Predator Helios 300 PH315-53-70M2
HP Omen 15-en0006na : AMD Ryzen 7 4800H, 15.60", 2.4 kgExternal Review » HP Omen 15-en0006na
Asus TUF Gaming F15 FX506LU-HN106 : Intel Core i7-10870H, 15.60", 2.3 kgExternal Review » Asus TUF Gaming F15 FX506LU-HN106
MSI GP75 Leopard 9SD-822BE : Intel Core i7-9750H, 17.30"External Review » MSI GP75 Leopard 9SD-822BE
Acer Nitro 5 AN517-52-79W0 : Intel Core i7-10750H, 17.30", 2.2 kgExternal Review » Acer Nitro 5 AN517-52-79W0
HP Omen 15-ek0015ns : Intel Core i7-10750H, 15.60", 2.4 kgExternal Review » HP Omen 15-ek0015ns
MSI GL75 Leopard 10SDR-271NL : Intel Core i7-10750H, 17.30", 2.6 kgExternal Review » MSI GL75 Leopard 10SDR-271NL
Lenovo Legion 5 15ARH05H-82B1000AUS : AMD Ryzen 7 4800H, 15.60", 2.5 kgExternal Review » Lenovo Legion 5 15ARH05H-82B1000AUS
Acer Aspire Nitro 5 AN515-55-74RJ : Intel Core i7-10750H, 15.60"External Review » Acer Aspire Nitro 5 AN515-55-74RJ
MSI GF75 Thin 10SDR : Intel Core i7-10750H, 17.30", 2.2 kgExternal Review » MSI GF75 Thin 10SDR
Gigabyte Aorus 5 SB-7UK1131SH : Intel Core i7-10750H, 15.60"External Review » Gigabyte Aorus 5 SB-7UK1131SH
Acer Nitro 5 AN517-52-746S : Intel Core i7-10750H, 17.30", 2.2 kgExternal Review » Acer Nitro 5 AN517-52-746S
HP Pavilion Gaming 15-ec1076ax : AMD Ryzen 7 4800H, 15.60", 2.2 kgExternal Review » HP Pavilion Gaming 15-ec1076ax
Asus TUF A17 FX706IU-H7081T : AMD Ryzen 7 4800H, 17.30", 2.6 kgExternal Review » Asus TUF A17 FX706IU-H7081T
Asus TUF A15 FA566IU-HN244T : AMD Ryzen 7 4800H, 15.60", 2.3 kgExternal Review » Asus TUF A15 FA566IU-HN244T
HP Omen 15-en0029nr : AMD Ryzen 7 4800H, 15.60", 2.5 kgExternal Review » HP Omen 15-en0029nr
Asus TUF A17 FX706 : AMD Ryzen 7 4800H, 17.30", 2.6 kgExternal Review » Asus TUF A17 FX706
Asus Strix G17 G712LU-H7092T : Intel Core i7-10750H, 17.30", 2.9 kgExternal Review » Asus Strix G17 G712LU-H7092T
Asus ROG Zephyrus M15 GU502LU-BI7N4 : Intel Core i7-10750H, 15.60", 2 kgExternal Review » Asus Zephyrus M15 GU502LU-BI7N4
MSI GF65 Thin 10SDR-1022XES : Intel Core i7-10750H, 15.60", 1.9 kgExternal Review » MSI GF65 Thin 10SDR-1022XES
MSI GF65 Thin 9SD-657XES : Intel Core i7-9750H, 15.60", 1.9 kgExternal Review » MSI GF65 Thin 9SD-657XES
Asus Zephyrus G14 GA401IU-HE103T : AMD Ryzen 7 4800HS, 14.00", 1.6 kgExternal Review » Asus Zephyrus G14 GA401IU-HE103T
Asus TUF Gaming A15 FA506IU-HN278 : AMD Ryzen 7 4800H, 15.60"External Review » Asus TUF A15 FA506IU-HN278
MSI GP75 Leopard 10SDK-023PL : Intel Core i7-10750H, 17.30", 2.6 kgExternal Review » MSI GP75 Leopard 10SDK-023PL
Acer Aspire Nitro 5 AN515-54-53CU : Intel Core i5-9300H, 15.60", 2.5 kgExternal Review » Acer Aspire Nitro 5 AN515-54-53CU
HP Omen 15-ek0456ng : Intel Core i5-10300H, 15.60", 2.1 kgExternal Review » HP Omen 15-ek0456ng
Medion Erazer P15811-i7-1024F16 : Intel Core i7-9750H, 15.60", 2.1 kgExternal Review » Medion Erazer P15811-i7-1024F16
Clevo NH55 : unknown, 15.60", 2.7 kgExternal Review » Clevo NH55
HP Omen 15-en0263ng : AMD Ryzen 7 4800H, 15.60", 2.4 kgExternal Review » HP Omen 15-en0263ng
Lenovo Legion 5 15IMH05H-81Y60044GE : Intel Core i7-10750H, 15.60", 2.5 kgExternal Review » Lenovo Legion 5 15IMH05H-81Y60044GE
Asus ROG Strix G15 G512LU-HN093 : Intel Core i7-10750H, 15.60", 2.3 kgExternal Review » Asus ROG Strix G15 G512LU-HN093
Acer Nitro 7 AN715, i5-10300H : Intel Core i5-10300H, 15.60", 2.5 kgExternal Review » Acer Nitro 7 AN715, i5-10300H
HP Omen 15-ek0071ng : Intel Core i7-10750H, 15.60", 2.4 kgExternal Review » HP Omen 15-ek0071ng
Dell G5 15 5500-FMD52 : Intel Core i7-10750H, 15.60", 2.4 kgExternal Review » Dell G5 15 5500-FMD52
Acer Nitro 5 AN517-51-748R : Intel Core i7-9750H, 17.30", 2.7 kgExternal Review » Acer Nitro 5 AN517-51-748R
Acer Predator Triton 300 PT315-52-51U8 : Intel Core i5-10300H, 15.60", 2.3 kgExternal Review » Acer Predator Triton 300 PT315-52-51U8
Acer Nitro 5 AN515-55-7800 : Intel Core i7-10750H, 15.60", 2.3 kgExternal Review » Acer Nitro 5 AN515-55-7800
Aorus 5 SB-7US1130SH : Intel Core i7-10750H, 15.60", 2.2 kgExternal Review » Aorus 5 SB-7US1130SH
MSI GL65 10SDK-032XES : Intel Core i7-10750H, 15.60", 2.3 kgExternal Review » MSI GL65 10SDK-032XES
MSI GL75 10SDK-041XES : Intel Core i7-10750H, 17.30", 2.6 kgExternal Review » MSI GL75 10SDK-041XES
Asus TUF A17 FA706IU-AS76 : AMD Ryzen 7 4800H, 17.30", 2.6 kgExternal Review » Asus TUF A17 FA706IU-AS76
Asus TUF Gaming F15 FX506IU-AL109T : AMD Ryzen 7 4800H, 15.60", 2.3 kgExternal Review » Asus TUF Gaming A15 FX506IU-AL109T
MSI GL75 10SDR-222 : Intel Core i7-10750H, 17.30", 2.6 kgExternal Review » MSI GL75 10SDR-222
Asus TUF Gaming F15 FX506IU-BQ225 : AMD Ryzen 7 4800H, 15.60", 2.3 kgExternal Review » Asus TUF Gaming A15 FX506IU-BQ225
MSI GL75 9SDK-268XES : Intel Core i7-9750H, 17.30", 2.5 kgExternal Review » MSI GL75 9SDK-268XES
Acer Predator Helios 300 PH315-52-796B : Intel Core i7-9750H, 15.60", 2.4 kgExternal Review » Acer Predator Helios 300 PH315-52-796B
HP Pavilion Gaming 15-ec0012ng : AMD Ryzen 7 3750H, 15.60", 2.3 kgExternal Review » HP Pavilion Gaming 15-ec0012ng
Acer Nitro 5 AN515-54-71P8 : Intel Core i7-9750H, 15.60", 2.2 kgExternal Review » Acer Nitro 5 AN515-54-71P8
MSI GL75 9SD-032 : Intel Core i7-9750H, 17.30", 2.5 kgExternal Review » MSI GL75 9SD-032
MSI GL65 9SD-007NL : Intel Core i7-9750H, 15.60", 2.3 kgExternal Review » MSI GL65 9SD-007NL
Asus ROG Strix G731GU-H7154 : Intel Core i7-9750H, 17.30", 2.9 kgExternal Review » Asus ROG Strix G731GU-H7154
HP Pavilion Gaming 15-dk0760nd : Intel Core i7-9750H, 15.60", 2.3 kgExternal Review » HP Pavilion Gaming 15-dk0760nd
Lenovo Legion Y540-15IRH-81SX004UGE : Intel Core i5-9300H, 15.60", 2.3 kgExternal Review » Lenovo Legion Y540-15IRH-81SX004UGE
Acer Aspire Nitro 5 AN515-54-56MH : Intel Core i5-9300H, 15.60", 2.5 kgExternal Review » Acer Aspire Nitro 5 AN515-54-56MH
Lenovo Legion Y540-15-81SX0034TX : Intel Core i7-9750H, 15.60", 2.3 kgExternal Review » Lenovo Legion Y540-15-81SX0034TX
Acer Aspire Nitro 5 AN515-54-57M8 : Intel Core i5-9300H, 15.60", 2.5 kgExternal Review » Acer Aspire Nitro 5 AN515-54-57M8
MSI GF65 10SDR-478 Thin : Intel Core i7-10750H, 15.60", 1.9 kgExternal Review » MSI GF65 10SDR-478 Thin
Asus ROG Strix GL531GU-AL061T : Intel Core i7-9750H, 15.60", 2.4 kgExternal Review » Asus ROG Strix GL531GU-AL061T
Dell G5 15 5590-YWTRF : Intel Core i7-9750H, 15.60", 2.9 kgExternal Review » Dell G5 15 5590-YWTRF
Asus TUF Gaming A15 FA506UI : AMD Ryzen 7 4800H, 15.60", 2.3 kgExternal Review » Asus TUF Gaming A15 FA506UI
Asus ROG Strix G731GU-EV038T : Intel Core i7-9750H, 17.30", 2.9 kgExternal Review » Asus ROG Strix G731GU-EV038T
HP Pavilion Gaming 15-dk0040nf : Intel Core i7-9750H, 15.60", 2.3 kgExternal Review » HP Pavilion Gaming 15-dk0040nf
Asus TUF Gaming A15 FA506, Ryzen 5 4600H : AMD Ryzen 5 4600H, 15.60", 2.3 kgExternal Review » Asus TUF Gaming A15 FA506, Ryzen 5 4600H
Acer Nitro 7 AN715-51-76LS : Intel Core i7-9750H, 15.60", 2.5 kgExternal Review » Acer Nitro 7 AN715-51-76LS
MSI Prestige P75 9SD Creator 625 : Intel Core i7-9750H, 17.30", 2.3 kgExternal Review » MSI Prestige P75 9SD Creator 625
Lenovo Legion Y540-17IRH-81Q4002DGE : Intel Core i5-9300H, 17.30", 2.8 kgExternal Review » Lenovo Legion Y540-17IRH-81Q4002DGE
Acer Nitro 5 AN517-51-76B3 : Intel Core i7-9750H, 17.30", 2.7 kgExternal Review » Acer Nitro 5 AN517-51-76B3
Razer Blade 15 GTX 1660 Ti : Intel Core i7-9750H, 15.60", 2.1 kgExternal Review » Razer Blade 15 GTX 1660 Ti
MSI GL63 9SD-1041IN : Intel Core i7-9750H, 15.60", 2.3 kgExternal Review » MSI GL63 9SD-1041IN
MSI GF65 Thin 9SD-072XES : Intel Core i7-9750H, 15.60", 0.2 kgExternal Review » MSI GF65 Thin 9SD-072XES
HP Omen 15-dc1036ns : Intel Core i7-9750H, 15.60", 2.3 kgExternal Review » HP Omen 15-dc1036ns
SCHENKER XMG Fusion 15-L19jby : Intel Core i7-9750H, 15.60", 1.9 kgExternal Review » Schenker XMG Fusion 15-L19jby
Asus ROG STRIX G531GU-AL003 : Intel Core i7-9750H, 15.60", 2.4 kgExternal Review » Asus ROG STRIX G531GU-AL003
HP Pavilion Gaming 15-ec0022ax : AMD Ryzen 7 3750H, 15.60", 2 kgExternal Review » HP Pavilion Gaming 15-ec0022ax
Acer Predator Helios 300 PH317-53-75B4 : Intel Core i7-9750H, 15.60", 3 kgExternal Review » Acer Predator Helios 300 PH317-53-75B4
HP Pavilion Gaming 15-dk0052tx : Intel Core i7-9750H, 15.60", 2.3 kgExternal Review » HP Pavilion Gaming 15-dk0052tx
MSI GL65 9SD-043IT : Intel Core i5-9300H, 15.60", 3 kgExternal Review » MSI GL65 9SD-043IT
Acer Predator Helios 300 PH315-52-52ZM : Intel Core i5-9300H, 15.60", 2.4 kgExternal Review » Acer Predator Helios 300 PH315-52-52ZM
Asus ROG Strix G531GU-AL018 : Intel Core i7-9750H, 15.60", 2.4 kgExternal Review » Asus ROG Strix G531GU-AL018
MSI GL63 8SD-269ES : Intel Core i7-8750H, 15.60", 2.2 kgExternal Review » MSI GL63 8SD-269ES
Asus ROG Strix Scar III G731GU-EV044 : Intel Core i7-9750H, 17.30", 2.9 kgExternal Review » Asus ROG Strix Scar III G731GU-EV044
MSI GP75 Leopard 9SD : Intel Core i7-9750H, 17.30", 2.6 kgExternal Review » MSI GP75 Leopard 9SD
Acer Predator Helios 300 PH315-52-NH.Q53EA.007 : Intel Core i5-9300H, 15.60", 2.5 kgExternal Review » Acer Predator Helios 300 PH315-52-NH.Q53EA.007
Lenovo Legion Y7000 2019-81NSCTO1WW : Intel Core i7-9750H, 15.60", 2.3 kgExternal Review » Lenovo Legion Y7000 2019-81NSCTO1WW
Acer Aspire Nitro 7 AN715-51-70D6 : Intel Core i7-9750H, 15.60", 2.7 kgExternal Review » Acer Aspire Nitro 7 AN715-51-70D6
Dell G3 15 3590-cn35907 : Intel Core i5-9300H, 15.60", 2.4 kgExternal Review » Dell G3 15 3590-cn35907
HP Omen 15-dh0015ns : Intel Core i7-9750H, 15.60", 2.6 kgExternal Review » HP Omen 15-dh0015ns
Lenovo Legion Y545-15-81Q6CTO1WWENMY0 : Intel Core i7-9750H, 15.60", 2.3 kgExternal Review » Lenovo Legion Y545-15-81Q6CTO1WWENMY0
HP Gaming Pavilion 15-dk0205ng : Intel Core i7-9750H, 15.60", 2.3 kgExternal Review » HP Gaming Pavilion 15-dk0205ng
Asus ROG Zephyrus G15 GA502DU-BQ015 : AMD Ryzen 7 3750H, 15.60", 2.1 kgExternal Review » Asus ROG Zephyrus G GA502DU-BQ015
Acer Nitro 7 AN715-51-786X : Intel Core i7-9750H, 15.60", 2.7 kgExternal Review » Acer Nitro 7 AN715-51-786X
Dell G3 15 3590-G1DFD : Intel Core i7-9750H, 15.60", 2.3 kgExternal Review » Dell G3 15 3590-G1DFD
Asus ROG Strix G531GU-AL008T : Intel Core i7-9750H, 15.60", 2.4 kgExternal Review » Asus ROG Strix G531GU-AL008T
MSI GL63 8SD-270XES : Intel Core i7-8750H, 15.60", 2.3 kgExternal Review » MSI GL63 8SD-270XES
Acer Predator Helios 300 PH315-52-78VL : Intel Core i7-9750H, 15.60", 2.5 kgExternal Review » Acer Predator Helios 300 PH315-52-78VL
Aorus 15-SA : Intel Core i7-9750H, 15.60", 2.1 kgExternal Review » Aorus 15-SA
Lenovo Legion Y540-15IRH-81SX00B2GE : Intel Core i7-9750H, 15.60", 2.2 kgExternal Review » Lenovo Legion Y540-15IRH-81SX00B2GE
Asus ROG Zephyrus M15 GU502GU-XB74 : Intel Core i7-9750H, 15.60", 2 kgExternal Review » Asus Zephyrus M GU502GU-XB74
Asus TUF Gaming FX505DU-AL085T : AMD Ryzen 7 3750H, 15.60", 2.2 kgExternal Review » Asus TUF Gaming FX505DU-AL085T
Acer Nitro 5 AN515-54-72T8 : Intel Core i7-9750H, 15.60", 2.7 kgExternal Review » Acer Nitro 5 AN515-54-72T8
Asus TUF FX705DU-AU029T : AMD Ryzen 7 3750H, 17.30", 2.7 kgExternal Review » Asus TUF FX705DU-AU029T
Asus ROG Strix G G531GU-AL061T : Intel Core i7-9750H, 15.60", 2.4 kgExternal Review » Asus ROG Strix G G531GU-AL061T
Asus ROG Strix G G531GU-AL001 : Intel Core i7-9750H, 15.60", 2.4 kgExternal Review » Asus ROG Strix G G531GU-AL001
Gigabyte Aorus 7 SA : Intel Core i7-9750H, 17.30", 2.5 kgExternal Review » Gigabyte Aorus 7 SA
MSI GS75 Stealth 9SD-604ES : Intel Core i7-9750H, 17.30", 2.3 kgExternal Review » MSI GS75 Stealth 9SD-604ES
Acer Predator Helios 300 PH315-52-79TY : Intel Core i7-9750H, 15.60", 2.3 kgExternal Review » Acer Predator Helios 300 PH315-52-79TY
Acer Aspire Nitro 5 AN517-51-754T : Intel Core i7-9750H, 17.30", 2.7 kgExternal Review » Acer Aspire Nitro 5 AN517-51-754T
Asus ROG Zephyrus G15 GA502DU-AL025T : AMD Ryzen 7 3750H, 15.60", 2.1 kgExternal Review » Asus Zephyrus G GA502DU-AL025T
Asus TUF FX505DU-BQ045 : AMD Ryzen 7 3750H, 15.60", 2.2 kgExternal Review » Asus TUF FX505DU-BQ045
Asus ROG Strix G G731GU-EV032T : Intel Core i7-9750H, 17.30", 2.9 kgExternal Review » Asus ROG Strix G G731GU-EV032T
Lenovo Legion Y540-15IRH-81SX00B2GE : Intel Core i5-9300H, 15.60", 2.3 kgExternal Review » Lenovo Legion Y540-15IRH-81SX00B2GE
MSI GL73 8SD-044ES : Intel Core i7-8750H, 17.30", 2.9 kgExternal Review » MSI GL73 8SD-044ES
HP Pavilion 17-cd0228ng : Intel Core i7-9750H, 17.30", 2.8 kgExternal Review » HP Pavilion 17-cd0228ng
Asus TUF FX705DU-AU053T : AMD Ryzen 7 3750H, 17.30", 2.6 kgExternal Review » Asus TUF FX705DU-AU053T
MSI GL63 8SD-437ID : Intel Core i7-8750H, 15.60", 2.2 kgExternal Review » MSI GL63 8SD-437ID
Asus ROG Zephyrus M15 GU502GU-ES001T : Intel Core i7-9750H, 15.60", 2 kgExternal Review » Asus Zephyrus M GU502GU-ES001T
Asus TUF FX705DU-AU019T : AMD Ryzen 7 3750H, 17.30", 2.6 kgExternal Review » Asus TUF FX705DU-AU019T
Asus TUF FX505DU-MB74 : AMD Ryzen 7 3750H, 15.60", 2.2 kgExternal Review » Asus TUF FX505DU-MB74
Gigabyte Aero 15 Classic-SA-F74ADW : Intel Core i7-9750H, 15.60", 2 kgExternal Review » Gigabyte Aero 15 Classic-SA-F74ADW
Acer Aspire Nitro 7 AN715-51-77D0 : Intel Core i7-9750H, 15.60", 2.7 kgExternal Review » Acer Aspire Nitro 7 AN715-51-77D0
Acer Aspire Nitro 5 AN515-54-72B7 : Intel Core i7-9750H, 15.60", 2.3 kgExternal Review » Acer Aspire Nitro 5 AN515-54-72B7
MSI GF75 Thin 10SDR : Intel Core i7-10750H, 17.30", 2.2 kgMSI GF75 Thin 10SDR: Price-Performance Tip
HP Omen 15-ek0456ng : Intel Core i5-10300H, 15.60", 2.1 kgThe HP Omen 15 convinces with a good display and long battery life
Nexoc GH7 716IG : Intel Core i7-10750H, 17.30", 2.5 kgNexoc GH7: Maintenance friendly with Clevo barebone
Asus TUF A17 FA706IU-AS76 : AMD Ryzen 7 4800H, 17.30", 2.6 kgAsus TUF A17 is a beefy 17.3-inch gaming laptop with some of the smallest arrow keys we've seen
SCHENKER XMG Core 15 GK5CP6V : Intel Core i7-9750H, 15.60", 2 kgGood Price-Performance Ratio: Schenker XMG Core 15 (Tongfang GK5CP6V)
Please share our article, every link counts!
» Comparison of GPUs
» Benchmark List
» Notebook Gaming List
Class 1
Class 2 Radeon PRO W6600M *
Class 3 UHD Graphics 32EUs
UHD Graphics 750
Class 4
Class 5 * Approximate position of the graphics adapter
Working For Notebookcheck
Are you a techie who knows how to translate? Then join our Team!
Details here
Top 10 Laptops Multimedia , Budget Multimedia , Gaming , Budget Gaming , Lightweight Gaming , Business , Budget Office , Workstation , Subnotebooks , Ultrabooks , Chromebooks
under 300 USD/Euros , under 500 USD/Euros , 1,000 USD/Euros , for University Students , Best Displays
Top 10 Smartphones Smartphones , Phablets , ≤6-inch , Camera Smartphones
Klaus Hinum (Update: 2019-03-28)
 Deutsch
 English
 Español
 Français
 Italiano
 Nederlands
 Polski
 Português
 Русский
 Türkçe
 Svenska
 Chinese
 Magyar