Notebookcheck Logo

Intel Core m3-8100Y vs Apple M1 Pro

Intel Core m3-8100Y

► remove from comparison

The Intel Core m3-8100Y is a very efficient dual-core SoC for tablets and passively cooled notebooks based on the Amber Lake generation and will be announced around August 2018. The CPU consists of two processor cores clocked at 1.1 - 3.4 GHz. Thanks to Hyper Threading, the processor can execute up to four threads simultaneously. The chips also includes the Intel HD Graphics 615 GPU, a dual-channel memory controller (DDR3L/LPDDR3) as well as VP9 and H.265 video de- and encoder.  Compared to the Kaby Lake-Y predecessors (e.g. Core m3-7Y32), Amber Lake uses the same architecture produced in the improved 14nm+ FinFET process (no 14nm++) but offers higher clock speeds at an increased TDP rating.

Architecture

Intel basically used the familiar micro architecture from the Skylake / Kaby Lake generation, so the per-MHz performance is identical.

Performance

The performance of the Y series is highly depending on the cooling solution of the laptop / tablet and the TDP settings for sustained load. Therefore, the differences between a Core m3 and a i7 may be rather slim, if the thermals are very limited. The high Turbo clock speeds in Amber Lake should however lead to a very good single thread performance for short bursts.

Graphics

The integrated Intel HD Graphics 615 GPU has 24 Execution Units (EUs) like the old HD Graphics 515 and runs with clocks between 300 and 950 MHz in combination with this processor. The performance heavily depends on the TDP limit as well as the memory configuration; with fast LPDDR3-1866 RAM in dual-channel mode, the GPU should sometimes be able to compete with the HD Graphics 520, but can also be much slower in other scenarios. Modern games from 2016 will, if at all, only run smoothly in the lowest settings.

Contrary to Skylake, Kaby Lake and Amber Lake now also supports hardware decoding for H.265/HEVC Main10 with a 10-bit color depth as well as Google's VP9 codec.

Power Consumption

The chip is manufactured in the old 14 nm+ process with FinFET transistors. The typical TDP for the Amber Lake Y-series is specified at 5 Watts (previous generations were 4.5 Watt), and can be adjusted in both directions depending on the usage scenario.

Apple M1 Pro

► remove from comparison Apple M1 Pro

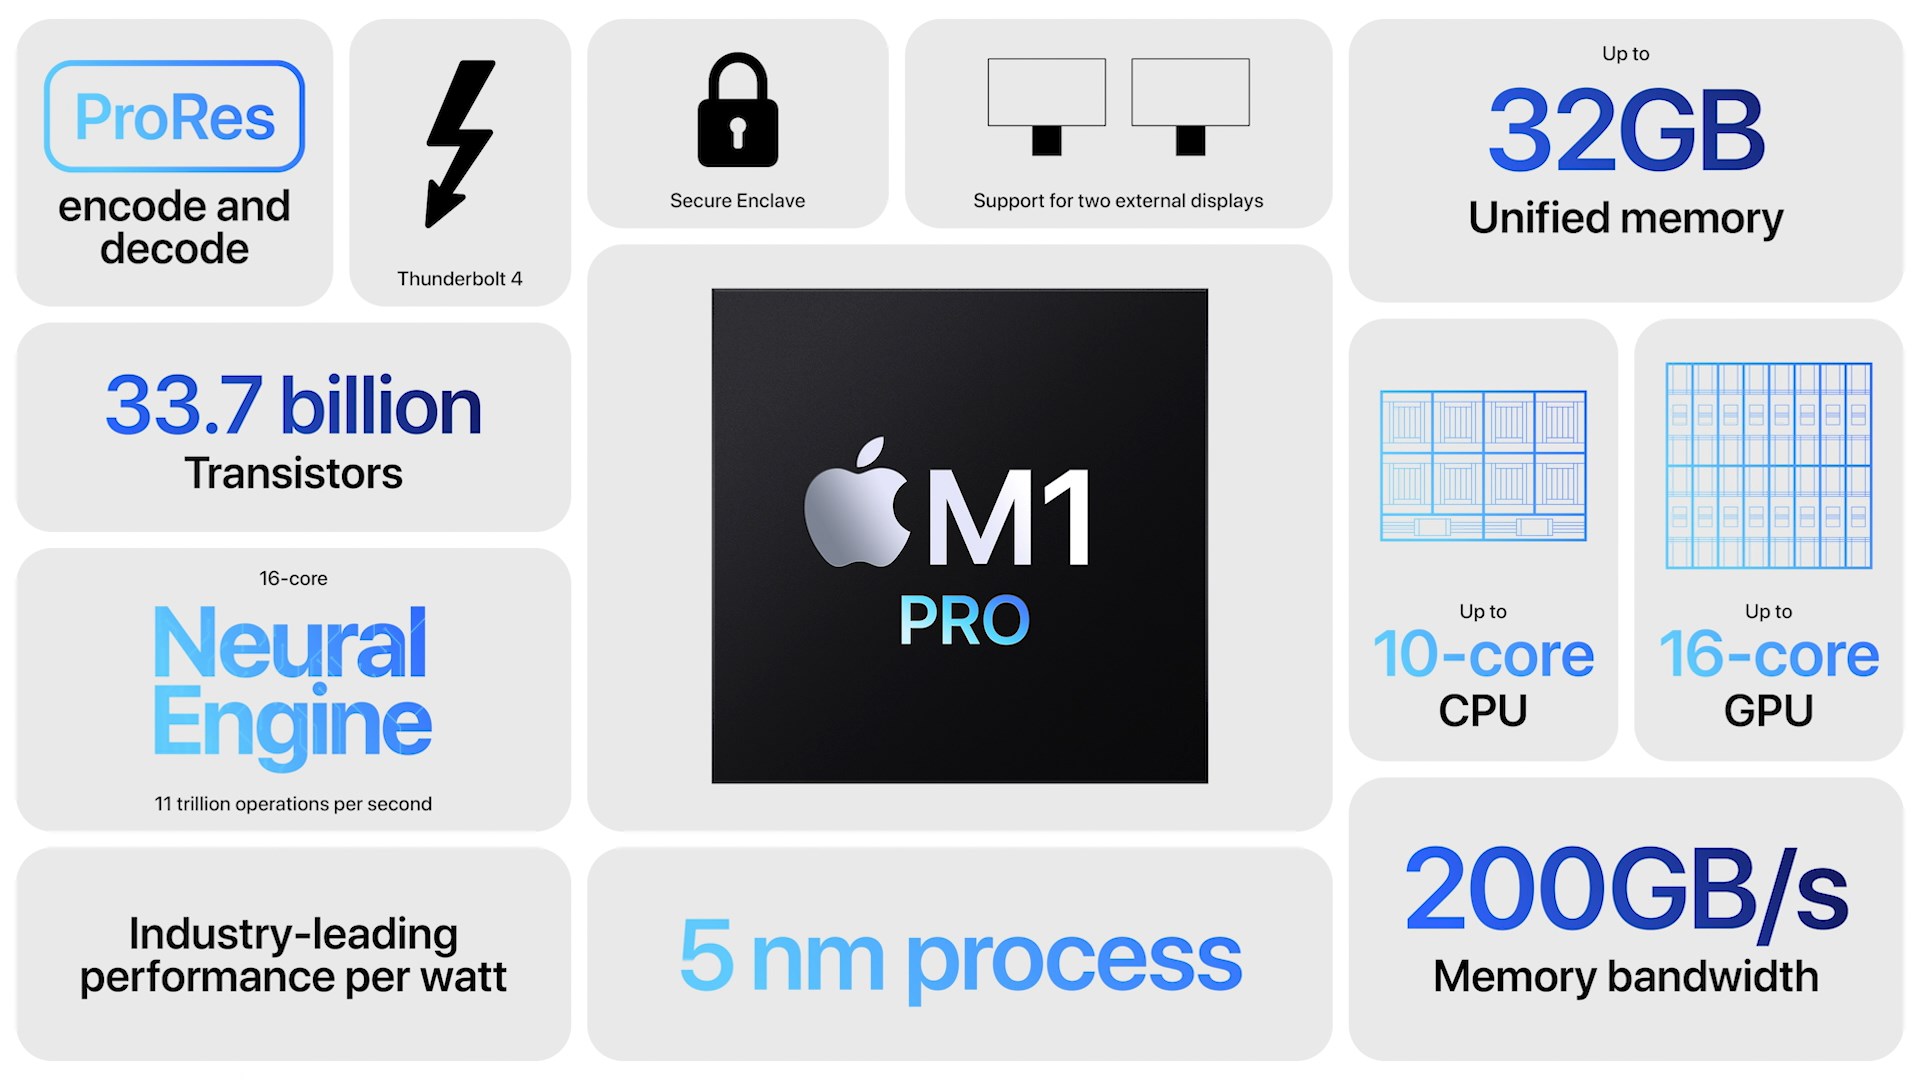
The Apple M1 Pro is a System on a Chip (SoC) from Apple that is found in the late 2021 MacBook Pro 14 and 16-inch models. It offers  all 10 cores available in the chip divided in eight performance cores (P-cores with 600 - 3220 MHz) and two power-efficiency cores (E-cores with 600 - 2064 MHz). There is no Turbo Boost for single cores or short burst periods. The cores are similar to the cores in the Apple M1. The entry level model offers only 8 cores.

The big cores (codename Firestorm) offer 192 KB instruction cache, 128 KB data cache, and 24 MB shared L2 cache (up from 12 MB in the M1). The four efficiency cores (codename Icestorm) are a lot smaller and offer only 128 KB instruction cache, 64 KB data cache, and 4 MB shared cache. CPU and GPU can both use the 24 MB SLC (System Level Cache). The efficiency cores (E cluster) clock with 600 - 2064 MHz, the performance cores (P cluster) with 600 - 3228 MHz.

The unified memory (16 or 32 GB LPDDR5-6400) next to the chip is connected by a 256 bit memory controller (200 GB/s bandwidth) and can be used by the GPU and CPU.

The integrated graphics card in the M1 Pro offers all 16 cores.

Furthermore, the SoC integrates a fast 16 core neural engine, a secure enclave (e.g., for encryption), a unified memory architecture, Thunderbolt 4 controller, an ISP, and media de- and encoders (including ProRes).

The M1 Pro is manufactured in 5 nm at TSMC and integrates 33.7 billion transistors. The peak power consumption of the chip was advertised around 30W for CPU intensive tasks. In the Prime95 benchmark the chip uses in our tests (with a MBP16) 33.6W package power and 31W for the CPU part. In idle the SoC only reports 1W package power.

ModelIntel Core m3-8100YApple M1 Pro
SeriesIntel Amber LakeApple Apple M-Series
CodenameAmber Lake-Y
Series: Apple M-Series
Intel Core i5-10310Y compare1.1 - 4.1 GHz4 / 8 cores6 MB L3
Intel Core i5-10210Y compare1 - 4 GHz4 / 8 cores6 MB L3
Intel Core i7-8500Y compare1.5 - 4.2 GHz2 / 4 cores4 MB L3
Intel Core i3-10110Y compare1 - 4 GHz2 / 4 cores4 MB L3
Intel Core i5-8210Y compare1.6 - 3.6 GHz2 / 4 cores4 MB L3
Intel Core i5-8200Y compare1.3 - 3.9 GHz2 / 4 cores4 MB L3
Intel Core i3-10100Y compare1.3 - 3.9 GHz2 / 4 cores4 MB L3
Intel Core m3-8100Y « 1.1 - 3.4 GHz2 / 4 cores4 MB L3
Intel Pentium Gold 6500Y compare1.1 - 3.4 GHz2 / 4 cores4 MB L3
Apple M1 Max compare2.06 - 3.22 GHz10 / 10 cores48 MB L3
Apple M1 Pro « 2.06 - 3.22 GHz10 / 10 cores24 MB L3
Apple M1 Pro 8-Core compare2.06 - 3.22 GHz8 / 8 cores16 MB L3
Apple M1 compare2.06 - 3.22 GHz8 / 8 cores8 MB L3
Clock1100 - 3400 MHz2064 - 3220 MHz
L1 Cache128 KB2.9 MB
L2 Cache512 KB28 MB
L3 Cache4 MB24 MB
Cores / Threads2 / 410 / 10
TDP5 Watt
Technology14 nm5 nm
max. Temp.100 °C
SocketBGA
FeaturesDual-Channel DDR3L-1600/LPDDR3-1866 Memory Controller, HyperThreading, AVX, AVX2, Quick Sync, Virtualization, AES-NI, vPro, TXTARMv8 Instruction Set
iGPUIntel UHD Graphics 615 (300 - 950 MHz)Apple M1 Pro 16-Core GPU
Architecturex86ARM
$281 U.S.
Announced
Manufacturerark.intel.com
Transistors33700 Million

Benchmarks

Performance Rating - CB R15 + R20 + 7-Zip + X265 + Blender + 3DM11 CPU - m3-8100Y
20.2 pt (28%)
Cinebench 2024 - Cinebench 2024 CPU Single Core
100%
1 M1 Pro +
112 Points (78%)
Cinebench 2024 - Cinebench 2024 CPU Multi Core
100%
1 M1 Pro +
824 Points (15%)
Cinebench R23 - Cinebench R23 Multi Core
100%
1 M1 Pro +
12370 Points (11%)
Cinebench R23 - Cinebench R23 Single Core
100%
1 M1 Pro +
1534 Points (65%)
Cinebench R20 - Cinebench R20 CPU (Single Core)
min: 232     avg: 257.7     median: 243 (27%)     max: 298 Points
393 Points (44%)
Cinebench R20 - Cinebench R20 CPU (Multi Core)
min: 382     avg: 440.7     median: 413 (1%)     max: 527 Points
2721 Points (7%)
Cinebench R15 - Cinebench R15 CPU Multi 64 Bit
min: 157     avg: 190.8     median: 179.5 (1%)     max: 247 Points
1690 Points (11%)
Cinebench R15 - Cinebench R15 CPU Single 64 Bit
min: 91     avg: 101.3     median: 96.6 (29%)     max: 121 Points
209 Points (63%)
Cinebench R10 - Cinebench R10 Rend. Single (32bit)
3850 Points (23%)
Cinebench R10 - Cinebench R10 Rend. Multi (32bit)
6055 Points (4%)
wPrime 2.10 - wPrime 2.0 1024m *
906 s (11%)
wPrime 2.10 - wPrime 2.0 32m *
18.6 s (4%)
WinRAR - WinRAR 4.0
1646 Points (3%)
7-Zip 18.03 - 7-Zip 18.03 Multli Thread 4 runs
min: 4937     avg: 6246     median: 6245.5 (4%)     max: 7554 MIPS
7-Zip 18.03 - 7-Zip 18.03 Single Thread 4 runs
min: 2683     avg: 2983     median: 2982.5 (36%)     max: 3282 MIPS
X264 HD Benchmark 4.0 - x264 Pass 2
11.2 fps (4%)
X264 HD Benchmark 4.0 - x264 Pass 1
58.3 fps (13%)
HWBOT x265 Benchmark v2.2 - HWBOT x265 4k Preset
min: 1.42     avg: 1.7     median: 1.7 (3%)     max: 1.96 fps
TrueCrypt - TrueCrypt Serpent
0.2 GB/s (0%)
TrueCrypt - TrueCrypt Twofish
0.3 GB/s (5%)
TrueCrypt - TrueCrypt AES
1.7 GB/s (4%)
Blender - Blender 2.79 BMW27 CPU *
min: 1893     avg: 2206     median: 2206 (16%)     max: 2519 Seconds
183.3 Seconds (1%)
R Benchmark 2.5 - R Benchmark 2.5 *
min: 0.942     avg: 1.1     median: 1.1 (23%)     max: 1.204 sec
Super Pi mod 1.5 XS 1M - Super Pi mod 1.5 XS 1M *
11.4 s (2%)
Super Pi mod 1.5 XS 2M - Super Pi mod 1.5 XS 2M *
29.5 s (1%)
Super Pi Mod 1.5 XS 32M - Super Pi mod 1.5 XS 32M *
818 s (4%)
3DMark 11 - 3DM11 Performance Physics
min: 2165     avg: 2747     median: 2579.5 (7%)     max: 3665 Points
3DMark - 3DMark Ice Storm Physics
min: 24135     avg: 26883     median: 26882.5 (22%)     max: 29630 Points
3DMark - 3DMark Ice Storm Extreme Physics
min: 20632     avg: 22076     median: 22076 (18%)     max: 23520 Points
3DMark - 3DMark Ice Storm Unlimited Physics
min: 18736     avg: 26552     median: 26177 (22%)     max: 34742 Points
3DMark - 3DMark Cloud Gate Physics
min: 1941     avg: 2084     median: 1968 (5%)     max: 2460 Points
3DMark - 3DMark Fire Strike Standard Physics
min: 2692     avg: 2986     median: 2837.5 (5%)     max: 3577 Points
3DMark - 3DMark Time Spy CPU
min: 943     avg: 1061     median: 992 (4%)     max: 1248 Points
Geekbench 6.2 - Geekbench 6.2 Single-Core
100%
1 M1 Pro +
2409 Points (65%)
Geekbench 6.2 - Geekbench 6.2 Multi-Core
100%
1 M1 Pro +
12440 Points (49%)
Geekbench 5.5 - Geekbench 5.1 - 5.4 64 Bit Single-Core
min: 809     avg: 846     median: 845.5 (36%)     max: 882 Points
1768 Points (75%)
Geekbench 5.5 - Geekbench 5.1 - 5.4 64 Bit Multi-Core
min: 1178     avg: 1397     median: 1396.5 (3%)     max: 1615 Points
12499 Points (22%)
Geekbench 5.0 - Geekbench 5.0 64 Bit Single-Core
765 Points (3%)
Geekbench 5.0 - Geekbench 5.0 64 Bit Multi-Core
1279 Points (4%)
Geekbench 4.4 - Geekbench 4.1 - 4.4 64 Bit Single-Core
4159 Points (42%)
Geekbench 4.4 - Geekbench 4.1 - 4.4 64 Bit Multi-Core
6934 Points (8%)
Geekbench 4.0 - Geekbench 4.0 64 Bit Single-Core
4043 Points (55%)
Geekbench 4.0 - Geekbench 4.0 64 Bit Multi-Core
6676 Points (16%)
Geekbench 3 - Geekbench 3 32 Bit Multi-Core
5446 Points (10%)
Geekbench 3 - Geekbench 3 32 Bit Single-Core
2702 Points (53%)
Geekbench 3 - Geekbench 3 64 Bit Multi-Core
5958 Points (9%)
Geekbench 3 - Geekbench 3 64 Bit Single-Core
3081 Points (46%)
Geekbench 2 - 32 Bit - Geekbench Stream
8823 Points (71%)
Geekbench 2 - 32 Bit - Geekbench Memory
6189 Points (56%)
Geekbench 2 - 32 Bit - Geekbench Floating Point
5047 Points (10%)
Geekbench 2 - 32 Bit - Geekbench Integer
6364 Points (13%)
Geekbench 2 - 32 Bit - Geekbench Total Score
6113 Points (16%)
Mozilla Kraken 1.1 - Kraken 1.1 Total Score *
min: 1295     avg: 1652     median: 1715 (2%)     max: 2163 ms
405.4 ms (0%)
Sunspider - Sunspider 1.0 Total Score *
min: 117.4     avg: 211     median: 211 (2%)     max: 304.6 ms
75.6 ms (1%)
Octane V2 - Octane V2 Total Score
min: 14701     avg: 21429     median: 20267 (18%)     max: 29318 Points
66203 Points (58%)
WebXPRT 3 - WebXPRT 3 Score
min: 128     avg: 134.5     median: 135.5 (28%)     max: 139 Points
342 Points (71%)
PCMark for Android - PCM f. Android Computer Vision
5961 Points (31%)
PCMark for Android - PCM f. Android Storage
25599 Points (55%)
PCMark for Android - PCM f. Android Work Score 2.0
9760 Points (64%)
PCMark for Android - PCM f. Android Work Score
13598 Points (68%)
CrossMark - CrossMark Overall
100%
1 M1 Pro +
1556 Points (60%)
Power Consumption - Prime95 Power Consumption - external Monitor *
100%
1 M1 Pro +
41.5 Watt (7%)
Power Consumption - Cinebench R15 Multi Power Consumption - external Monitor *
100%
1 M1 Pro +
48.3 Watt (9%)
Power Consumption - Geekbench 5.5 Power Consumption 150cd *
100%
1 M1 Pro +
19.9 Watt (9%)
Power Consumption - Idle Power Consumption - external Monitor *
100%
1 M1 Pro +
6.4 Watt (4%)
Power Consumption - Idle Power Consumption 150cd 1min *
100%
1 M1 Pro +
9.9 Watt (11%)
Power Consumption - Cinebench R15 Multi Power Efficiency - external Monitor
100%
1 M1 Pro +
35 Points per Watt (26%)

Average Benchmarks Intel Core m3-8100Y → 100% n=11

Average Benchmarks Apple M1 Pro → 362% n=11

- Range of benchmark values for this graphics card
- Average benchmark values for this graphics card
* Smaller numbers mean a higher performance
1 This benchmark is not used for the average calculation

Add one or more devices and compare

In the following list you can select (and also search for) devices that should be added to the comparison. You can select more than one device.

restrict list:

show all (including archived), 2024, 2023
v1.28
log 04. 09:38:05

#0 checking url part for id 10086 +0s ... 0s

#1 checking url part for id 13845 +0s ... 0s

#2 redirected to Ajax server, took 1720078685 +0s ... 0s

#3 did not recreate cache, as it is less than 5 days old! Created at Thu, 04 Jul 2024 05:15:21 +0200 +0s ... 0s

#4 composed specs +0.005s ... 0.005s

#5 did output specs +0s ... 0.005s

#6 getting avg benchmarks for device 10086 +0.004s ... 0.008s

#7 got single benchmarks 10086 +0.008s ... 0.017s

#8 getting avg benchmarks for device 13845 +0.001s ... 0.017s

#9 got single benchmarks 13845 +0.004s ... 0.021s

#10 got avg benchmarks for devices +0s ... 0.021s

#11 min, max, avg, median took s +0.035s ... 0.056s

#12 return log +0.002s ... 0.058s

Please share our article, every link counts!
> Expert Reviews and News on Laptops, Smartphones and Tech Innovations > Benchmarks / Tech > Processor Comparison - Head 2 Head
Redaktion, 2017-09- 8 (Update: 2023-07- 1)