Intel Core i9-13900K vs AMD Ryzen 9 5950X
Intel Core i9-13900K ► remove from comparison
The Intel Core i9-13900K is a fast high-end desktop processor of the Raptor Lake series. It includes a hybrid architecture for the CPU cores with combined 24 cores and 32 threads. Eight fast Raptor Cove performance cores (P-cores) with HyperThreading and a clock speed of 3 - 5.8 GHz and sixteen Gracemont efficiency cores without HyperThreading and a clock speed of 2.2 - 4.3 GHz.
Thanks to the faster P-cores and more E-cores, the i9-13900K is significantly faster than the old i9-12900K (especially in multi-threaded workloads). Compared to the Raphael AMD Ryzen 9 7950X (Zen 4) , the 13900K offers a slightly higher multi-thread-performance and a slightly lower single core performance. In games, the Intel CPU is currently the clear winner (at the time of announcement of the 7950X).
The 13900K is rated at 125 Watt TDP base power (PL1) and 253 Watt Turbo Power (PL2) and therefore slightly higher than the old i9-12900K .
AMD Ryzen 9 5950X ► remove from comparison
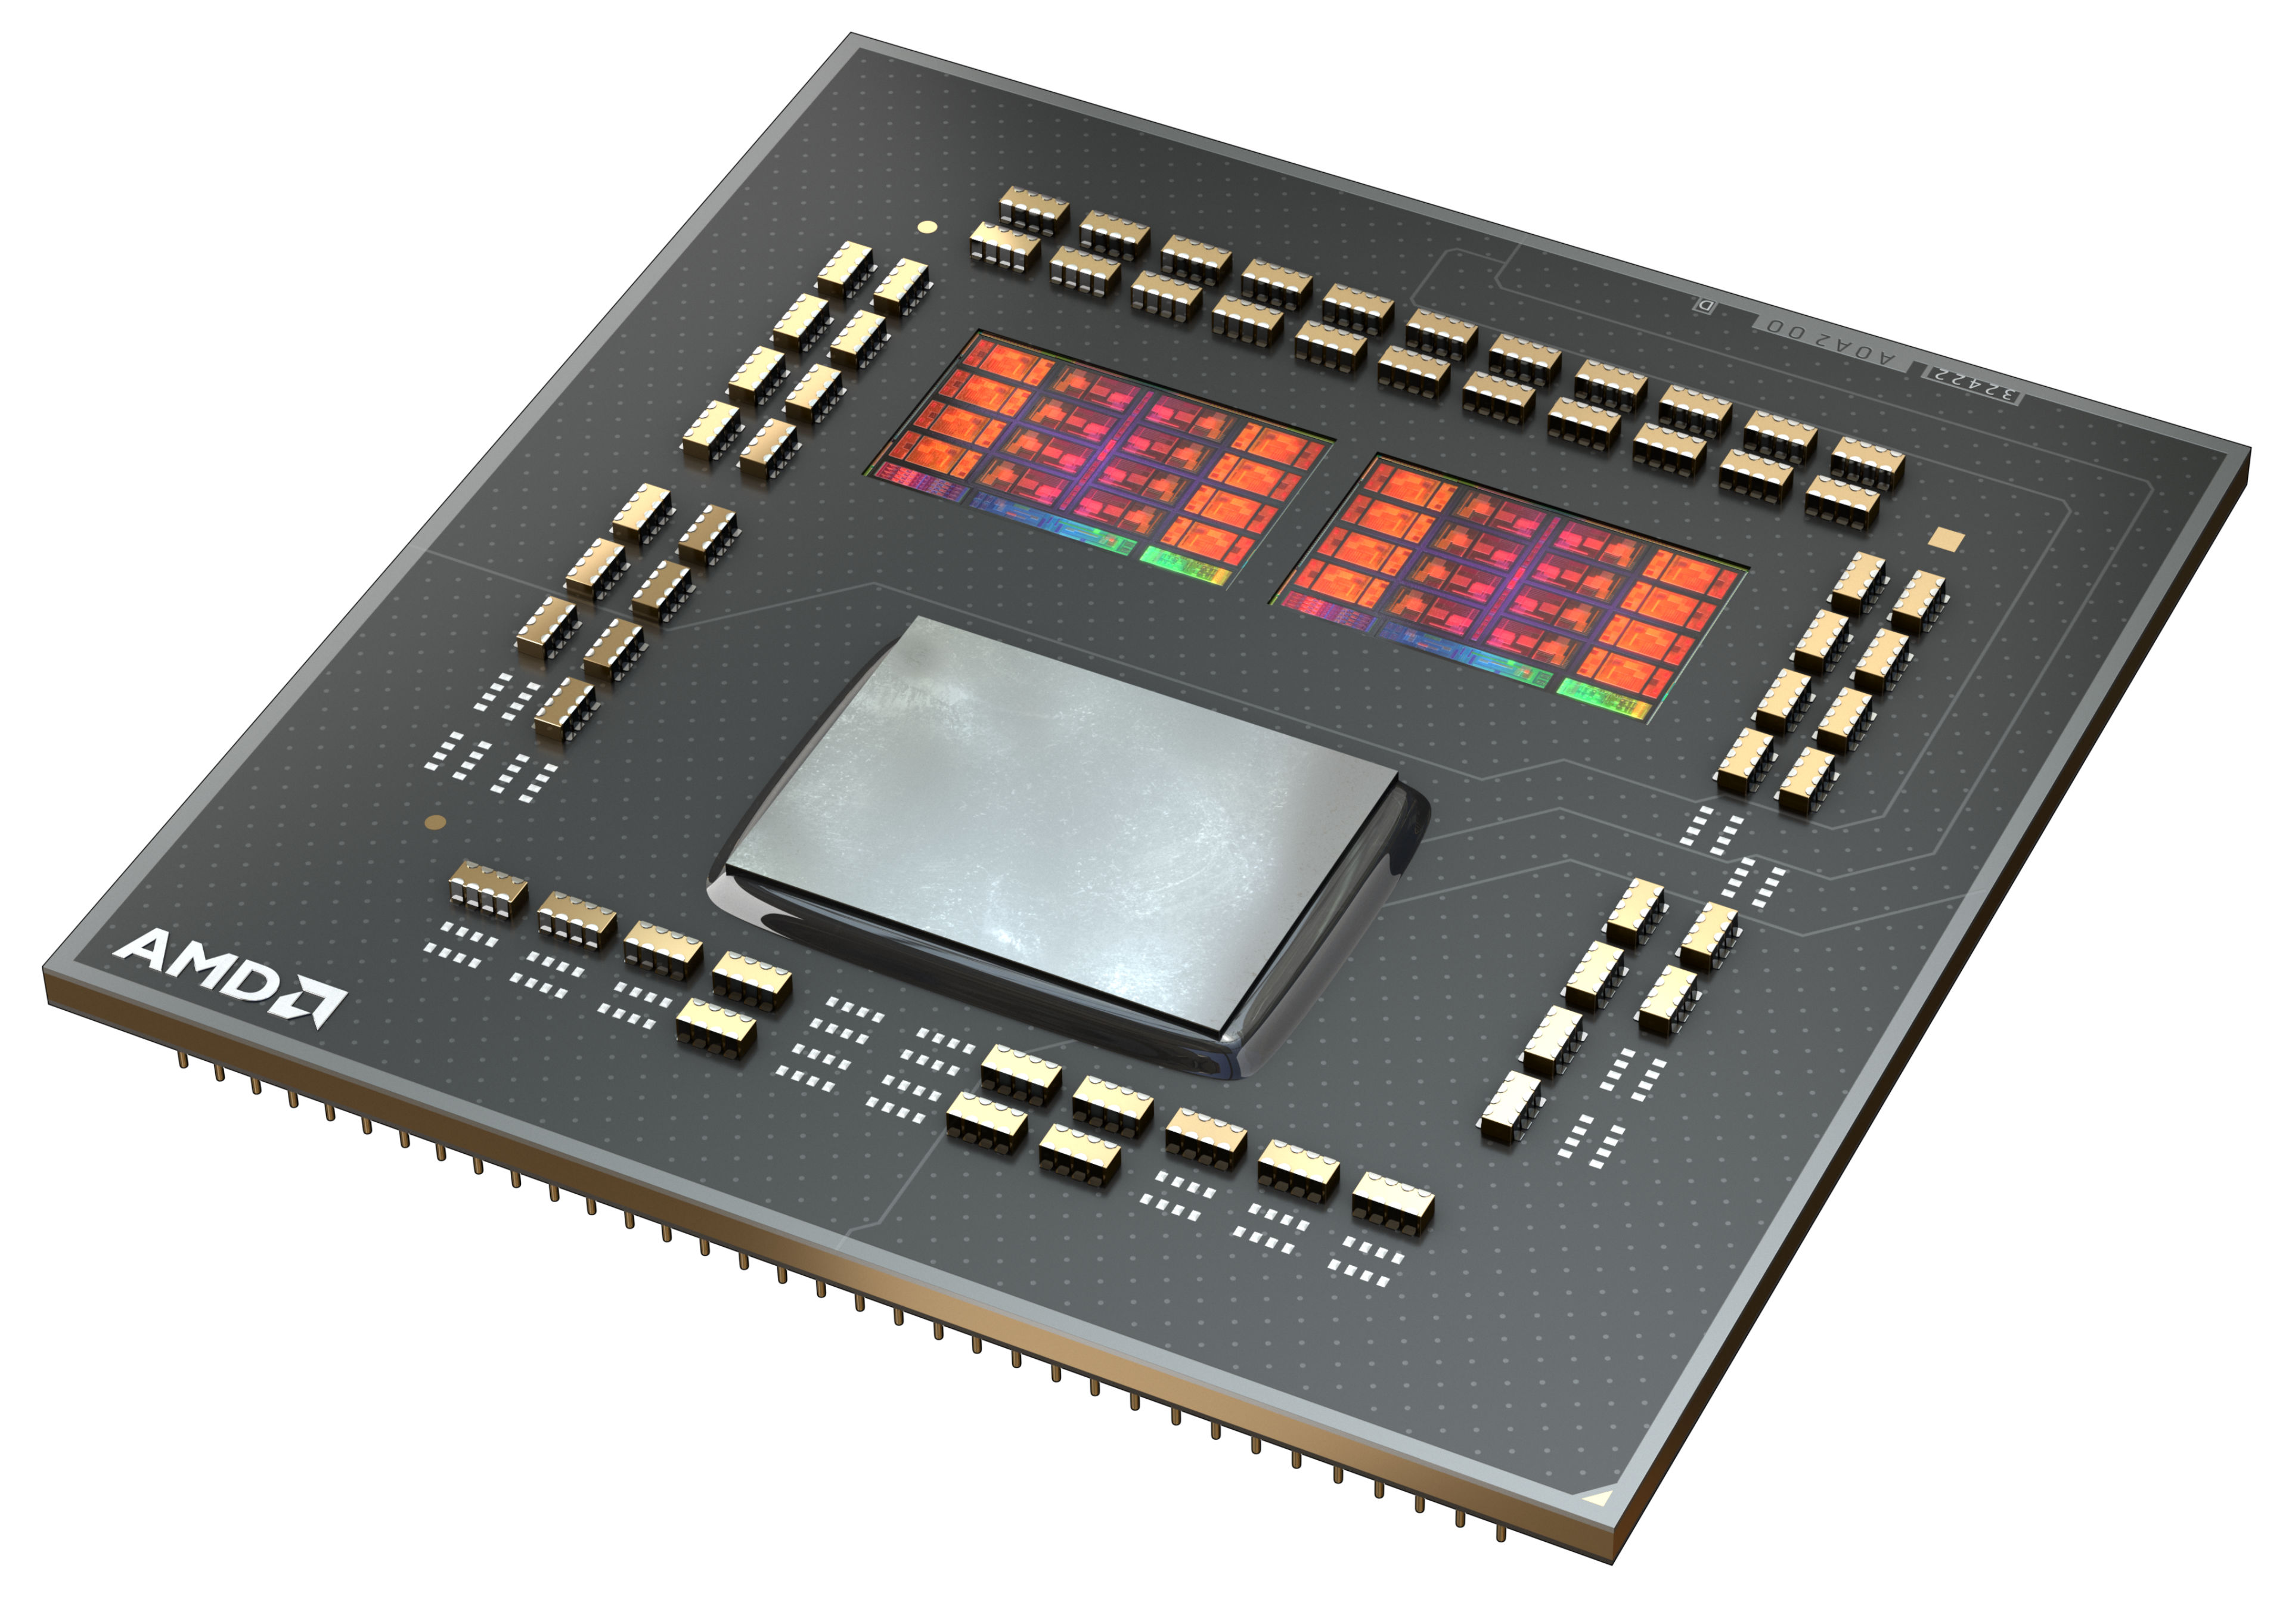
The AMD Ryzen 9 5950X is a high-end 16-core, hyperthreaded (SMT) Vermeer Series desktop processor. With 32 threads, the new flagship offers as many threads as the AMD Ryzen 9 3950X. Introduced on October 8, 2020, the Ryzen 9 5950X is the fastest 16-core processor and is specified at 105 watts TDP.
The Ryzen 9 5950X runs at 3.4 GHz to 4.9 GHz (single core). Wen all 16 cores are loaded, up to 4.5 GHz are still possible.
The internal structure of the processor has not changed fundamentally at first glance. The CCX structure has changed a bit compared to Zen 2, because now a CCX consists of up to 8 CPU cores. So each individual core can access the complete L3 cache (32 MByte). Furthermore the CCX modules are connected to each other via the same I/O die, which we already know from Zen2. According to AMD, the Infinity fabric should now reach clock rates of up to 2 Ghz, which in turn allows a RAM clock of 4,000 MHz without performance loss.
Performance
The average 5950X in our database matches the Core i9-12900K , the Core i9-12900HX and also the Ryzen Threadripper 2970WX in multi-thread performance, making this Ryzen a great processor for pretty much any task imaginable as of mid 2022.
Power consumption
This Ryzen 9 series chip has a default TDP (also known as the long-term power limit) of 105 W. It will, however, happily consume much more than that as long as the cooling solution is able to handle the heat - even before one starts considering the possibility of overclocking the thing.
The Ryzen 9 5950X is built with TSMC's 7 nm process for average, as of mid 2023, energy efficiency.
Model Intel Core i9-13900K AMD Ryzen 9 5950X Series Intel Raptor Lake-S AMD Vermeer (Ryzen 5000) Codename Raptor Lake Vermeer (Zen 3) Series: Vermeer (Ryzen 5000) Vermeer (Zen 3) Intel Core i9-13900K « 3 - 5.8 GHz 24 / 32 36 MB L3 Intel Core i7-13700K 3.4 - 5.4 GHz 16 / 24 30 MB L3 Intel Core i5-13600K 3.5 - 5.1 GHz 14 / 20 24 MB L3 Intel Core i5-13500 2.5 - 4.8 GHz 14 / 20 24 MB L3 Intel Core i5-13500T 2.5 - 4.6 GHz 14 / 20 24 MB L3
Clock 3000 - 5800 MHz 3400 - 4900 MHz L2 Cache 32 MB 8 MB L3 Cache 36 MB 64 MB Cores / Threads 24 / 32 16 / 32 TDP 125 Watt 105 Watt Technology 10 nm 7 nm Die Size 257 mm2 CPU cores: 2x 80.7 sq. mm., I/O: 125 mm2 max. Temp. 100 °C Socket LGA 1700 AM4 Features Intel UHD Graphics 770, DDR5 5600 MT/s, DDR4 3200 MT/s DDR4-3200 RAM, PCIe 4, MMX (+), SSE, SSE2, SSE3, SSSE3, SSE4.1, SSE4.2, SSE4A, AES, AVX, AVX2, FMA3, SHA iGPU Intel UHD Graphics 770 (300 - 1650 MHz)Architecture x86 x86 $589 U.S. $799 U.S. Announced Manufacturer www.intel.com www.amd.com L1 Cache 1 MB
Benchmarks Performance Rating - CB R15 + R20 + 7-Zip + X265 + Blender + 3DM11 CPU - i9-13900K
59.3 pt (82%)
...
Performance Rating - CB R15 + R20 + 7-Zip + X265 + Blender + 3DM11 CPU - R9 5950X
50.5 pt (70%)
...
...
Cinebench R23 - Cinebench R23 Multi Core
min: 32592 avg: 37310 median: 38271.5 (36%) max: 40103 Points
CPU TDP ? TDP 125 W TDP 150 W 100% 95% 81%
min: 24972 avg: 26017 median: 26017 (24%) max: 27062 Points
CPU TDP ? TDP 125 W TDP 150 W 80% 100% 85%
Cinebench R23 - Cinebench R23 Single Core
min: 2203 avg: 2238 median: 2238.5 (95%) max: 2272 Points
CPU TDP ? TDP 125 W TDP 150 W 100% 99% 97%
min: 1579 avg: 1614 median: 1614 (69%) max: 1649 Points
CPU TDP ? TDP 125 W TDP 150 W 82% 100% 98%
Cinebench R20 - Cinebench R20 CPU (Single Core)
min: 828 avg: 849 median: 849.5 (94%) max: 870 Points
CPU TDP ? TDP 125 W TDP 150 W 97% 100% 99%
min: 617 avg: 629 median: 629 (70%) max: 641 Points
CPU TDP ? TDP 125 W TDP 150 W 81% 100% 99%
Cinebench R20 - Cinebench R20 CPU (Multi Core)
min: 13415 avg: 14459 median: 14620.5 (36%) max: 15181 Points
CPU TDP ? TDP 125 W TDP 150 W 100% 96% 88%
min: 9640 avg: 10061 median: 10061 (25%) max: 10482 Points
CPU TDP ? TDP 125 W TDP 150 W 80% 100% 92%
Cinebench R15 - Cinebench R15 CPU Multi 64 Bit
min: 5321 avg: 5798 median: 5805.5 (37%) max: 6191 Points
CPU TDP ? TDP 125 W TDP 150 W 97% 100% 89%
min: 4156 avg: 4324 median: 4324 (27%) max: 4492 Points
CPU TDP ? TDP 125 W TDP 150 W 89% 100% 89%
Cinebench R15 - Cinebench R15 CPU Single 64 Bit
min: 299 avg: 314.1 median: 318 (96%) max: 328 Points
CPU TDP ? TDP 125 W TDP 150 W 95% 100% 99%
min: 261 avg: 266.5 median: 266.5 (80%) max: 272 Points
CPU TDP ? TDP 125 W TDP 150 W 91% 100% 99%
Cinebench R11.5 - Cinebench R11.5 CPU Multi 64 Bit
min: 62.2 avg: 67 median: 67.5 (88%) max: 70.78 Points
CPU TDP ? TDP 125 W TDP 150 W 100% 95% 88%
min: 46.05 avg: 47.8 median: 47.8 (62%) max: 49.6 Points
CPU TDP ? TDP 125 W TDP 150 W 82% 100% 92%
Cinebench R11.5 - Cinebench R11.5 CPU Single 64 Bit
min: 3.8 avg: 3.9 median: 3.9 (96%) max: 3.93 Points
CPU TDP ? TDP 125 W TDP 150 W 100% 99% 97%
min: 3.02 avg: 3.1 median: 3.1 (77%) max: 3.14 Points
CPU TDP ? TDP 125 W TDP 150 W 87% 100% 98%
Cinebench R10 - Cinebench R10 Rend. Single (32bit)
min: 11661 avg: 11989 median: 12017.5 (73%) max: 12259 Points
CPU TDP ? TDP 125 W TDP 150 W 100% 98% 97%
min: 6564 avg: 6690 median: 6689.5 (40%) max: 6815 Points
CPU TDP ? TDP 125 W TDP 150 W 71% 100% 99%
Cinebench R10 - Cinebench R10 Rend. Multi (32bit)
min: 85342 avg: 88253 median: 87738 (64%) max: 92192 Points
CPU TDP ? TDP 125 W TDP 150 W 98% 100% 100%
min: 55185 avg: 56641 median: 56640.5 (41%) max: 58096 Points
CPU TDP ? TDP 125 W TDP 150 W 75% 100% 100%
Cinebench R10 - Cinebench R10 Rend. Multi (64bit)
min: 132000 avg: 134526 median: 133567 (93%) max: 138969 Points
CPU TDP ? TDP 125 W TDP 150 W 95% 96% 100%
min: 99617 avg: 102128 median: 102128 (71%) max: 104638 Points
CPU TDP ? TDP 125 W TDP 150 W 81% 96% 100%
Cinebench R10 - Cinebench R10 Rend. Single (64bit)
min: 17418 avg: 17943 median: 17998.5 (22%) max: 18355 Points
CPU TDP ? TDP 125 W TDP 150 W 100% 98% 97%
min: 12655 avg: 12967 median: 12967 (16%) max: 13279 Points
CPU TDP ? TDP 125 W TDP 150 W 82% 100% 99%
wPrime 2.10 - wPrime 2.0 1024m *
min: 79.738 avg: 84.6 median: 84.2 (1%) max: 90.13 s
CPU TDP ? TDP 125 W TDP 150 W 100% 100% 100%
min: 52 avg: 58.5 median: 58.5 (1%) max: 64.9 s
CPU TDP ? TDP 125 W TDP 150 W 100% 100% 100%
wPrime 2.10 - wPrime 2.0 32m *
min: 1.818 avg: 2.1 median: 2 (0%) max: 2.305 s
CPU TDP ? TDP 125 W TDP 150 W 100% 100% 100%
min: 2.538 avg: 4.2 median: 4.2 (1%) max: 5.928 s
CPU TDP ? TDP 125 W TDP 150 W 100% 100% 100%
min: 13210 avg: 14265 median: 14271 (23%) max: 15309 Points
CPU TDP ? TDP 125 W TDP 150 W 100% 98% 89%
min: 12503 avg: 12736 median: 12735.5 (20%) max: 12968 Points
CPU TDP ? TDP 125 W TDP 150 W 93% 100% 91%
7-Zip 18.03 - 7-Zip 18.03 Multli Thread 4 runs
min: 127201 avg: 142777 median: 146984 (84%) max: 148053 MIPS
CPU TDP ? TDP 125 W TDP 150 W 100% 100% 86%
min: 118165 avg: 122979 median: 122978 (71%) max: 127792 MIPS
CPU TDP ? TDP 125 W TDP 150 W 89% 100% 87%
7-Zip 18.03 - 7-Zip 18.03 Single Thread 4 runs
min: 7176 avg: 7343 median: 7272 (87%) max: 7539 MIPS
CPU TDP ? TDP 125 W TDP 150 W 98% 100% 98%
min: 6729 avg: 6852 median: 6851.5 (82%) max: 6974 MIPS
CPU TDP ? TDP 125 W TDP 150 W 95% 100% 98%
X264 HD Benchmark 4.0 - x264 Pass 2
min: 247.5 avg: 261.5 median: 264.8 (92%) max: 269 fps
CPU TDP ? TDP 125 W TDP 150 W 100% 100% 93%
min: 203 avg: 212 median: 212 (74%) max: 221 fps
CPU TDP ? TDP 125 W TDP 150 W 87% 100% 93%
X264 HD Benchmark 4.0 - x264 Pass 1
min: 412 avg: 419 median: 419.3 (97%) max: 425.5 fps
CPU TDP ? TDP 125 W TDP 150 W 97% 100% 98%
min: 321.5 avg: 330 median: 330 (76%) max: 338.5 fps
CPU TDP ? TDP 125 W TDP 150 W 84% 100% 98%
HWBOT x265 Benchmark v2.2 - HWBOT x265 4k Preset
min: 34.5 avg: 39.9 median: 40.7 (72%) max: 42.6 fps
CPU TDP ? TDP 125 W TDP 150 W 100% 96% 81%
min: 29.9 avg: 30.9 median: 30.9 (54%) max: 31.8 fps
CPU TDP ? TDP 125 W TDP 150 W 85% 100% 85%
TrueCrypt - TrueCrypt Serpent
min: 2.6 avg: 2.9 median: 2.9 (0%) max: 3 GB/s
CPU TDP ? TDP 125 W TDP 150 W 100% 97% 87%
min: 2.3 avg: 2.4 median: 2.4 (0%) max: 2.4 GB/s
CPU TDP ? TDP 125 W TDP 150 W 89% 100% 90%
TrueCrypt - TrueCrypt Twofish
min: 5.2 avg: 5.4 median: 5.4 (93%) max: 5.4 GB/s
CPU TDP ? TDP 125 W TDP 150 W 100% 100% 96%
min: 3.3 avg: 3.5 median: 3.5 (60%) max: 3.7 GB/s
CPU TDP ? TDP 125 W TDP 150 W 77% 100% 96%
TrueCrypt - TrueCrypt AES
min: 20.5 avg: 23.3 median: 22.9 (60%) max: 27 GB/s
CPU TDP ? TDP 125 W TDP 150 W 100% 85% 76%
min: 25.1 avg: 26 median: 26 (68%) max: 26.9 GB/s
CPU TDP ? TDP 125 W TDP 150 W 100% 87% 78%
Blender - Blender 3.3 Classroom CPU *
min: 136 avg: 145.2 median: 140.5 (2%) max: 174 Seconds
CPU TDP ? TDP 125 W TDP 150 W 100% 100% 100%
Blender - Blender 2.79 BMW27 CPU *
min: 80 avg: 85.7 median: 84 (1%) max: 101 Seconds
CPU TDP ? TDP 125 W TDP 150 W 100% 100% 100%
min: 112.8 avg: 117.7 median: 117.7 (1%) max: 122.5 Seconds
CPU TDP ? TDP 125 W TDP 150 W 100% 100% 100%
R Benchmark 2.5 - R Benchmark 2.5 *
min: 0.3468 avg: 0.4 median: 0.4 (8%) max: 0.3911 sec
CPU TDP ? TDP 125 W TDP 150 W 101% 101% 100%
min: 0.4556 avg: 0.5 median: 0.5 (10%) max: 0.4698 sec
CPU TDP ? TDP 125 W TDP 150 W 100% 102% 101%
3DMark 06 - CPU - 3DMark 06 - CPU
min: 19989 avg: 20578 median: 20192 (43%) max: 21934 Points
CPU TDP ? TDP 125 W TDP 150 W 100% 97% 96%
min: 17229 avg: 17657 median: 17656.5 (38%) max: 18084 Points
CPU TDP ? TDP 125 W TDP 150 W 95% 100% 99%
Super Pi mod 1.5 XS 1M - Super Pi mod 1.5 XS 1M *
min: 5.655 avg: 5.7 median: 5.7 (1%) max: 5.86 s
CPU TDP ? TDP 125 W TDP 150 W 100% 100% 100%
min: 7.065 avg: 7.2 median: 7.2 (2%) max: 7.405 s
CPU TDP ? TDP 125 W TDP 150 W 100% 100% 100%
Super Pi mod 1.5 XS 2M - Super Pi mod 1.5 XS 2M *
min: 12.287 avg: 12.6 median: 12.5 (1%) max: 13.193 s
CPU TDP ? TDP 125 W TDP 150 W 100% 100% 100%
min: 15.28 avg: 15.7 median: 15.7 (1%) max: 16.02 s
CPU TDP ? TDP 125 W TDP 150 W 100% 100% 100%
Super Pi Mod 1.5 XS 32M - Super Pi mod 1.5 XS 32M *
min: 289.628 avg: 296.6 median: 293.3 (1%) max: 310.125 s
CPU TDP ? TDP 125 W TDP 150 W 100% 100% 100%
min: 349.3 avg: 361.5 median: 361.5 (2%) max: 373.7 s
CPU TDP ? TDP 125 W TDP 150 W 100% 100% 100%
3DMark Vantage - 3DM Vant. Perf. CPU no Physx
min: 86915 avg: 97290 median: 96473 (84%) max: 112434 Points
CPU TDP ? TDP 125 W TDP 150 W 100% 86% 81%
min: 84237 avg: 85367 median: 85367 (75%) max: 86497 Points
CPU TDP ? TDP 125 W TDP 150 W 100% 96% 90%
3DMark 11 - 3DM11 Performance Physics
min: 29023 avg: 31289 median: 31187.5 (84%) max: 33181 Points
CPU TDP ? TDP 125 W TDP 150 W 100% 99% 92%
min: 23012 avg: 25067 median: 25154.5 (68%) max: 27383 Points
CPU TDP ? TDP 125 W TDP 150 W 94% 100% 93%
3DMark - 3DMark Ice Storm Physics
min: 79257 avg: 97847 median: 97246.5 (79%) max: 111988 Points
CPU TDP ? TDP 125 W TDP 150 W 100% 91% 96%
min: 70120 avg: 77979 median: 79716 (65%) max: 84100 Points
CPU TDP ? TDP 125 W TDP 150 W 100% 95% 100%
3DMark - 3DMark Ice Storm Extreme Physics
min: 80320 avg: 96904 median: 97919.5 (79%) max: 102987 Points
CPU TDP ? TDP 125 W TDP 150 W 100% 93% 99%
min: 69902 avg: 78121 median: 80185 (65%) max: 84275 Points
CPU TDP ? TDP 125 W TDP 150 W 96% 94% 100%
3DMark - 3DMark Ice Storm Unlimited Physics
min: 83056 avg: 98634 median: 97311 (82%) max: 105981 Points
CPU TDP ? TDP 125 W TDP 150 W 100% 92% 93%
min: 82412 avg: 82452 median: 82452 (69%) max: 82492 Points
CPU TDP ? TDP 125 W TDP 150 W 100% 94% 95%
3DMark - 3DMark Cloud Gate Physics
min: 26626 avg: 29034 median: 29044.5 (73%) max: 30955 Points
CPU TDP ? TDP 125 W TDP 150 W 100% 98% 91%
min: 21419 avg: 22558 median: 22436 (57%) max: 23939 Points
CPU TDP ? TDP 125 W TDP 150 W 96% 100% 93%
3DMark - 3DMark Fire Strike Standard Physics
min: 46013 avg: 51456 median: 51140 (91%) max: 54226 Points
CPU TDP ? TDP 125 W TDP 150 W 100% 100% 89%
min: 34080 avg: 37236 median: 37498.5 (67%) max: 39600 Points
CPU TDP ? TDP 125 W TDP 150 W 91% 100% 89%
3DMark - 3DMark Time Spy CPU
min: 16236 avg: 20507 median: 20037 (84%) max: 22794 Points
CPU TDP ? TDP 125 W TDP 150 W 100% 95% 77%
min: 11111 avg: 12919 median: 13441 (57%) max: 14559 Points
CPU TDP ? TDP 125 W TDP 150 W 93% 100% 82%
Geekbench 5.5 - Geekbench 5.1 - 5.4 64 Bit Single-Core
min: 2106 avg: 2237 median: 2286 (96%) max: 2290 Points
CPU TDP ? TDP 125 W TDP 150 W 100% 99% 92%
min: 1621 avg: 1652 median: 1651.5 (70%) max: 1682 Points
CPU TDP ? TDP 125 W TDP 150 W 82% 100% 93%
Geekbench 5.5 - Geekbench 5.1 - 5.4 64 Bit Multi-Core
min: 22448 avg: 23743 median: 24033 (43%) max: 24157 Points
CPU TDP ? TDP 125 W TDP 150 W 100% 100% 93%
min: 15605 avg: 16248 median: 16248 (29%) max: 16891 Points
CPU TDP ? TDP 125 W TDP 150 W 79% 100% 93%
Geekbench 5.0 - Geekbench 5.0 64 Bit Single-Core
min: 2148 avg: 2191 median: 2197 (10%) max: 2246 Points
CPU TDP ? TDP 125 W TDP 150 W 100% 99% 97%
min: 1625 avg: 1654 median: 1654 (7%) max: 1683 Points
CPU TDP ? TDP 125 W TDP 150 W 84% 100% 98%
Geekbench 5.0 - Geekbench 5.0 64 Bit Multi-Core
min: 22024 avg: 23446 median: 23664 (75%) max: 24021 Points
CPU TDP ? TDP 125 W TDP 150 W 100% 99% 92%
min: 15396 avg: 15983 median: 15983 (50%) max: 16570 Points
CPU TDP ? TDP 125 W TDP 150 W 79% 100% 93%
Geekbench 4.4 - Geekbench 4.1 - 4.4 64 Bit Single-Core
min: 9218 avg: 9542 median: 9598 (96%) max: 9683 Points
CPU TDP ? TDP 125 W TDP 150 W 100% 100% 96%
min: 7021 avg: 7119 median: 7118.5 (71%) max: 7216 Points
CPU TDP ? TDP 125 W TDP 150 W 82% 100% 96%
Geekbench 4.4 - Geekbench 4.1 - 4.4 64 Bit Multi-Core
min: 77347 avg: 84105 median: 85336 (94%) max: 86695 Points
CPU TDP ? TDP 125 W TDP 150 W 100% 99% 89%
min: 57584 avg: 60409 median: 60408.5 (66%) max: 63233 Points
CPU TDP ? TDP 125 W TDP 150 W 81% 100% 90%
Mozilla Kraken 1.1 - Kraken 1.1 Total Score *
min: 423 avg: 430.6 median: 432 (1%) max: 438 ms
CPU TDP ? TDP 125 W TDP 150 W 100% 100% 100%
min: 558 avg: 570 median: 569.5 (1%) max: 581 ms
CPU TDP ? TDP 125 W TDP 150 W 100% 100% 100%
WebXPRT 4 - WebXPRT 4 Score
min: 304 avg: 317.6 median: 316 (91%) max: 335 Points
CPU TDP ? TDP 125 W TDP 150 W 98% 100% 94%
WebXPRT 3 - WebXPRT 3 Score
min: 338 avg: 364 median: 368 (77%) max: 382 Points
CPU TDP ? TDP 125 W TDP 150 W 97% 100% 90%
min: 288 avg: 289.5 median: 289.5 (60%) max: 291 Points
CPU TDP ? TDP 125 W TDP 150 W 84% 100% 90%
CrossMark - CrossMark Overall
min: 2263 avg: 2497 median: 2580 (99%) max: 2589 Points
CPU TDP ? TDP 125 W TDP 150 W 100% 98% 87%
1495 Points (57%)
CPU TDP ? TDP 125 W TDP 150 W 80% 100% 89%
Power Consumption - Prime95 Power Consumption - external Monitor *
min: 228 avg: 354.3 median: 359 (62%) max: 471 Watt
CPU TDP ? TDP 125 W TDP 150 W 100% 203% 323%
min: 232.8 avg: 242.6 median: 242.6 (42%) max: 252.3 Watt
CPU TDP ? TDP 125 W TDP 150 W 118% 100% 159%
Power Consumption - Cinebench R15 Multi Power Consumption - external Monitor *
min: 349 avg: 392.5 median: 370.5 (68%) max: 480 Watt
CPU TDP ? TDP 125 W TDP 150 W 100% 261% 293%
min: 226.1 avg: 227.4 median: 227.4 (41%) max: 228.7 Watt
CPU TDP ? TDP 125 W TDP 150 W 133% 100% 112%
Power Consumption - Idle Power Consumption - external Monitor *
min: 41.8 avg: 91.7 median: 94.4 (62%) max: 138.2 Watt
CPU TDP ? TDP 125 W TDP 150 W 100% 134% 214%
Power Consumption - Cinebench R15 Multi Power Efficiency - external Monitor
min: 12.9 avg: 15 median: 15.2 (11%) max: 16.8 Points per Watt
CPU TDP ? TDP 125 W TDP 150 W 77% 100% 90%
min: 18.2 avg: 19.1 median: 19.1 (14%) max: 19.9 Points per Watt
CPU TDP ? TDP 125 W TDP 150 W 100% 99% 89%
Average Benchmarks Intel Core i9-13900K → 100% n=46 Average Benchmarks AMD Ryzen 9 5950X → 81% n=46
- Range of benchmark values for this graphics card
- Average benchmark values for this graphics card
* Smaller numbers mean a higher performance
1 This benchmark is not used for the average calculation
v1.28
log 04. 07:49:44
#0 checking url part for id 14625 +0s ... 0s
#1 checking url part for id 12787 +0s ... 0s
#2 redirected to Ajax server, took 1720072184 +0s ... 0s
#3 did not recreate cache, as it is less than 5 days old! Created at Thu, 04 Jul 2024 05:15:21 +0200 +0s ... 0s
#4 composed specs +0.005s ... 0.005s
#5 did output specs +0s ... 0.005s
#6 getting avg benchmarks for device 14625 +0.005s ... 0.01s
#7 got single benchmarks 14625 +0.023s ... 0.033s
#8 getting avg benchmarks for device 12787 +0.005s ... 0.038s
#9 got single benchmarks 12787 +0.01s ... 0.048s
#10 got avg benchmarks for devices +0s ... 0.048s
#11 min, max, avg, median took s +0.059s ... 0.107s
#12 return log +0.002s ... 0.109s
Please share our article, every link counts!
Redaktion, 2017-09- 8 (Update: 2023-07- 1)
 Deutsch
 English
 Español
 Français
 Italiano
 Nederlands
 Polski
 Português
 Русский
 Türkçe
 Svenska
 Chinese
 Magyar