Notebookcheck Logo

Intel Core i9-11900K vs Intel Core i7-1370P vs Intel Core i5-11400T

Intel Core i9-11900K

► remove from comparison Intel i9-11900K

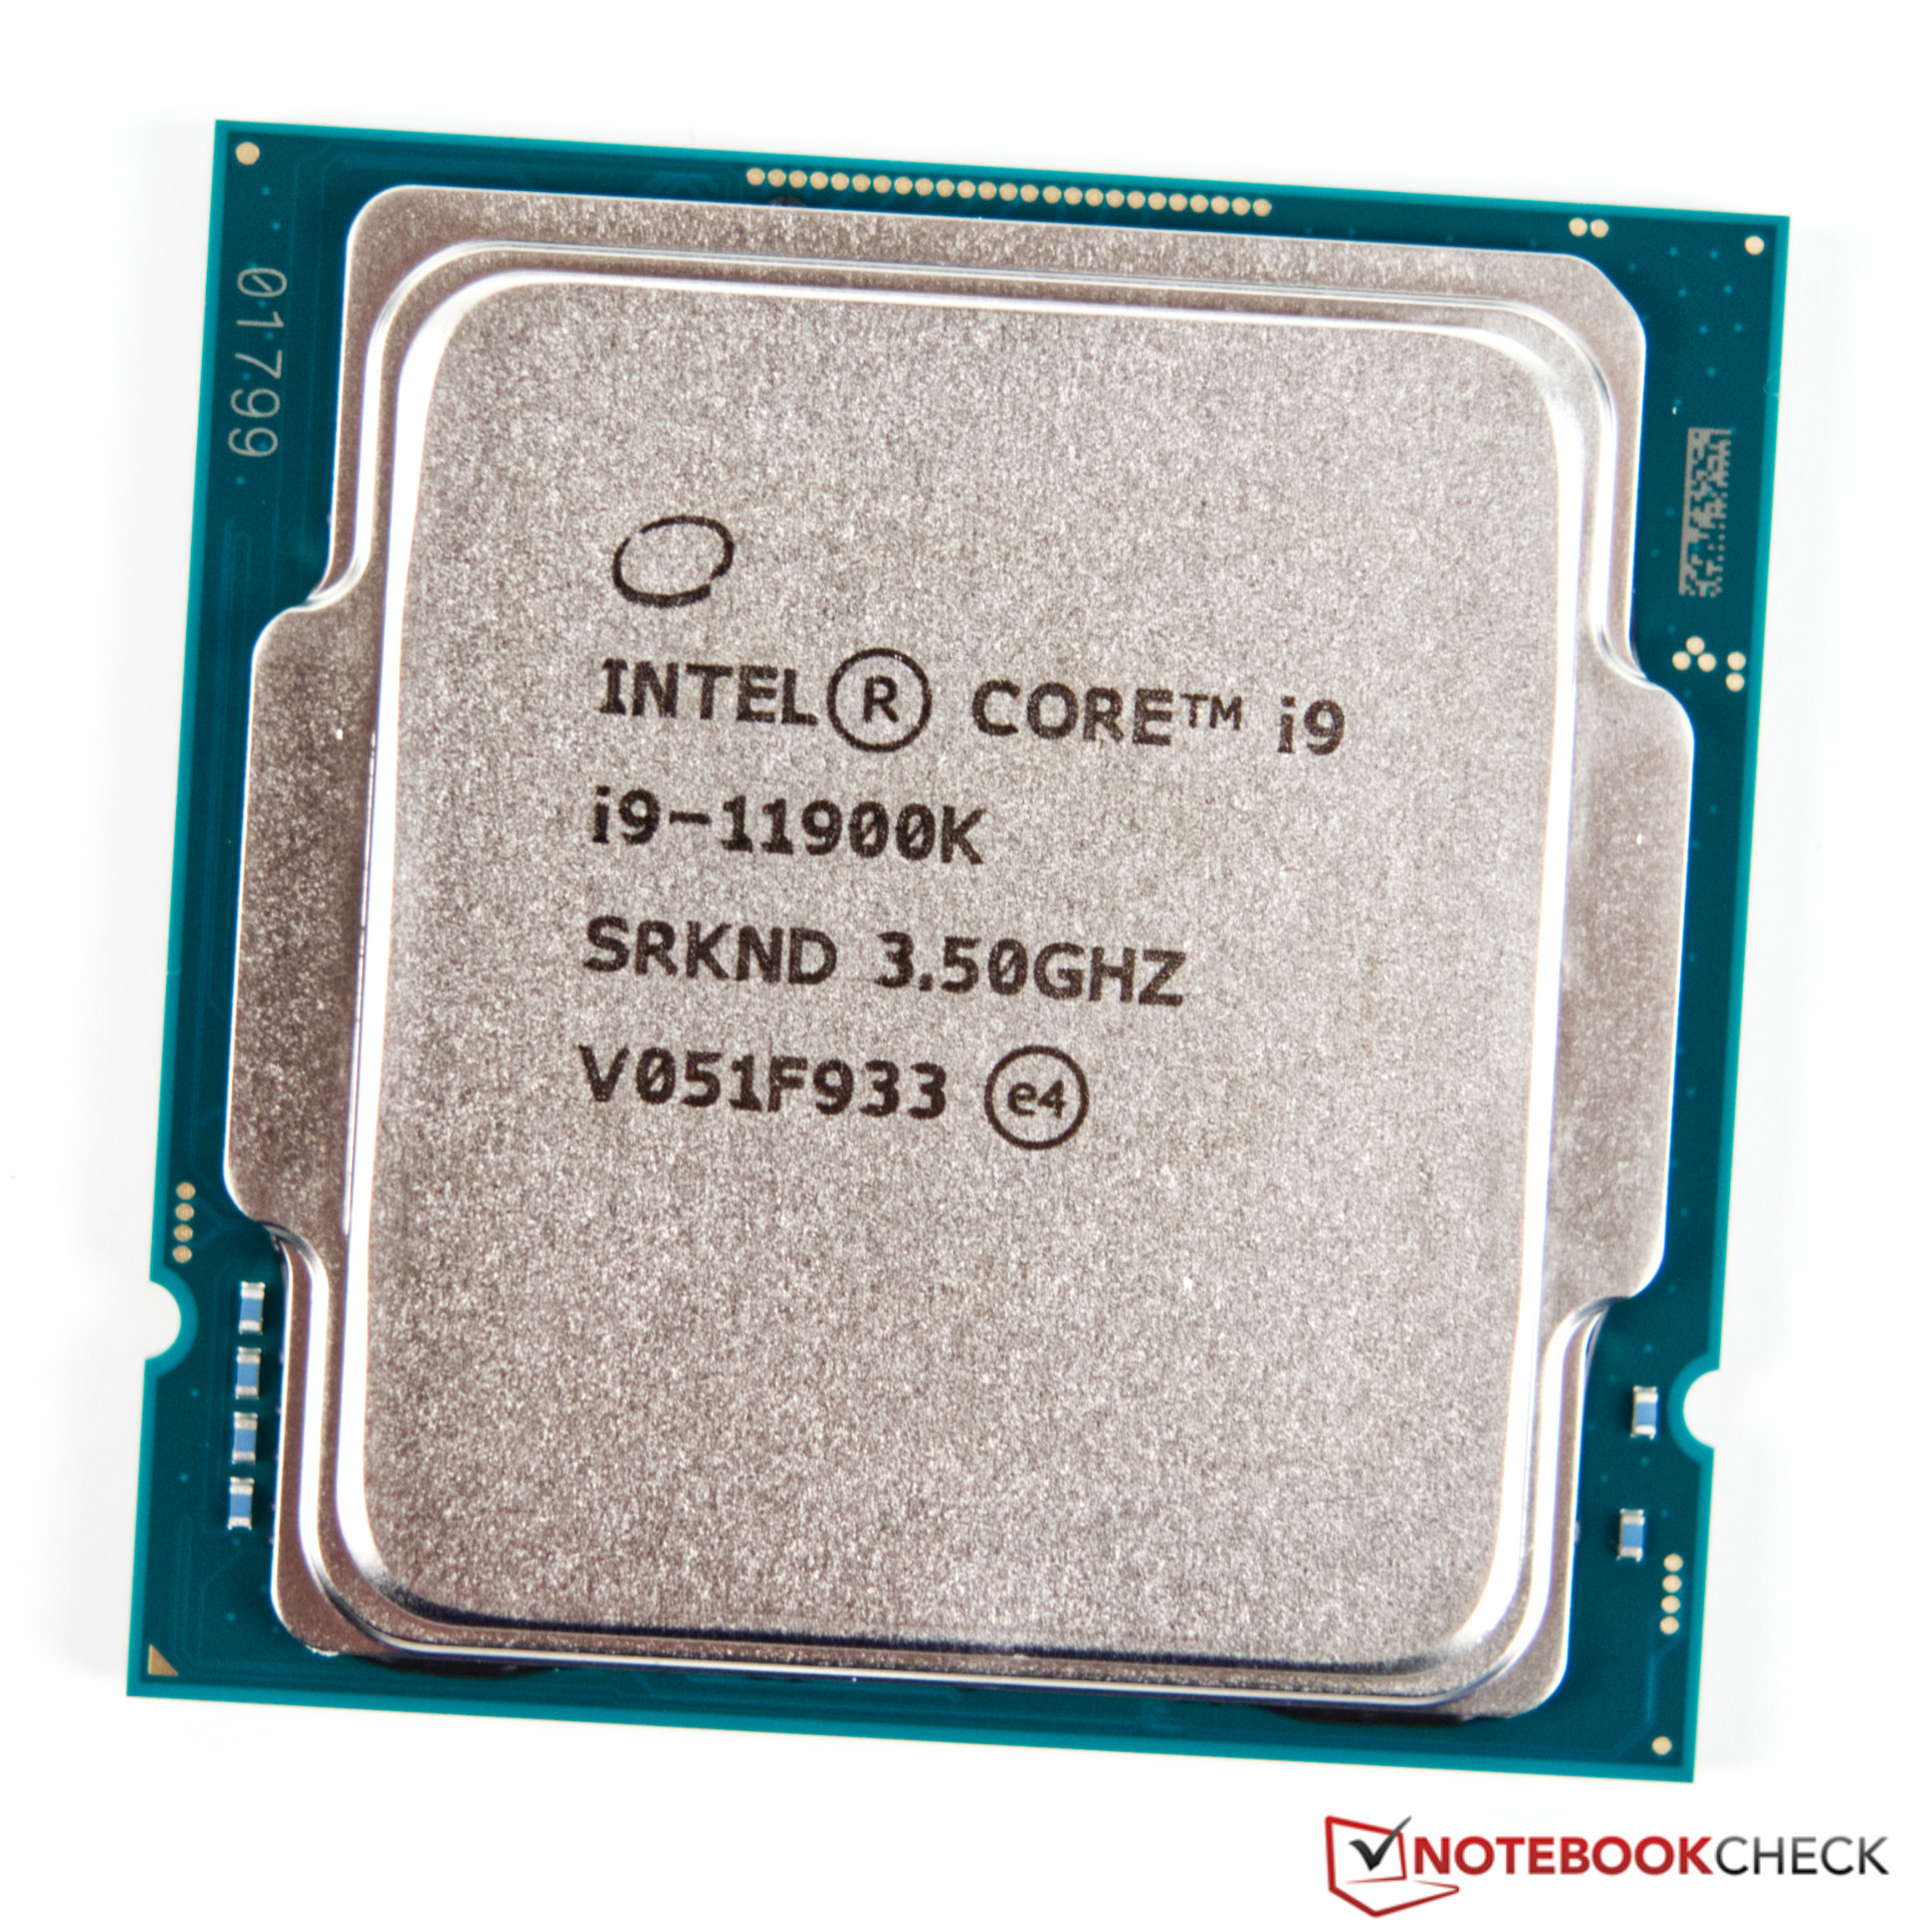
The Intel Core i9-11900K is a high-end desktop CPU based on the Rocket Lake architecture. The CPU offers 8 cores and 16 threads clocked at 3.5 - 5.3 GHz (Turbo Boost 3.0 / TVB). With Turbo Boost 2.0, 5.1 GHz can be reached with a single thread. Using all cores, the CPU can clock up to 4.8 GHz. Adaptive Boost enables even higher multi-core frequencies (5.1 GHz all core Turbo) but uses a lot more power.

The TDP is rated at 125 Watt (PL1, power limit sustained load) but the PL2 is set to around 250 Watt for short term boosts (up to 56 seconds).

The Sunny Cove processor cores (known from the Ice Lake mobile CPUs) offer larger caches and an improved IPC (up to 19%). Furthermore, the chip also includes (partly) integrated WiFi 6E and Thunderbolt 4. The platform supports PCIe 4.0 and Intel DL Boost for AI acceleration.

The faster Rocket Lake-S CPUs also integrate a new Intel UHD Graphics 750 that is based on the current Intel Xe architecture (e.g. mobile Tiger Lake) and offers 32 EUs. In the 11900K, the GPU is clocked from 350 - 1300 MHz.

Performance

The average 11900K in our database is in the same league as the Ryzen 7 5800X3D, as far as multi-thread benchmark scores are concerned. Which is an impressive result, as of mid 2022, and good enough for any task imaginable including content creation and professional gaming.

Power consumption

This Core i9 has a 125 W TDP, also known as the long-term power limit. Intel lets PC manufacturers reduce that value somewhat if required, 95 W being the lower limit, which would result in lower clock speeds and lower performance. The reality is, an 11900K can be much more power hungry than either of the two numbers imply simply because of its sheer might but also because it is manufactured on an old 14 nm Intel process that makes for lower-than-average, as of mid-2022, energy efficiency.

Intel Core i7-1370P

► remove from comparison Intel i7-1370P

The Intel Core i7-1370P is the flagship Alder Lake-P CPU, which is to say, an expensive 28 W part meant for use in ultra-light (yet actively cooled) laptops. This CPU will probably be announced in early 2023 and it has 6 performance cores (P-cores, Golden Cove architecture) mated to 8 efficient cores (E-cores, Gracemont architecture) according to a leak on Geekbench. The P-cores are Hyper-Threading-enabled for whopping 20 threads when combined with the E-cores. The clock speeds can reach up to 5.2 GHz for the performance cluster (1.9 GHz base speed) and 1.4 GHz to 3.9 GHz for the efficiency cluster. The CPU is quite similar to the older Core i7-1280P but probably offers higher clock speeds.

Full vPro feature set is supported by this Core i7 ("Enterprise" tier, allowing for remote device management).

Architecture

The i7 is a continuation of Intel's efforts to use the ARM-developed big.LITTLE technology for its own benefit. A single "little" Alder Lake core is supposed to be just as fast as a Skylake core (as found in the venerable Core i7-6700HQ among other options) which is six years old at this point. All of a Core i7-1280P's CPU cores enjoy access to 24 MB of L3 cache. The integrated memory controller supports up to 64 GB of LPDDR5-5200, DDR5-4800, LPDDR4x-4267 or DDR4-3200 RAM. Just like the other 12th Gen Intel Core processors, Core i7-1280P comes with Thread Director which is a new functionality designed to help Windows 11 decide which cores to use for what workload for best performance and efficiency possible. Hardware acceleration of AI algorithms is supported via GNA 3.0 and DL Boost (via AVX2). PCI-Express 5.0 support has not found its way into Alder Lake P processors, so users will have to be content with PCI-Express 4.0 for the time being. The CPU still only supports PCIe 4.0 x8 for a GPU and two PCIe 4.0 x4 for SSDs.

Please note this is not a user-replaceable CPU. It gets soldered permanently on to the motherboard (BGA1744 socket interface).

Performance

Multi-thread performance is most comparable to AMD Ryzen 9 5900HS, Ryzen 9 PRO 6950HS, Intel Core i9-11980HK. Which is impressive but comes with a catch; long-term performance sustainability will be rather poor unless the Power Limits are very high and the cooling solution is a truly capable one.

Graphics

The built-in graphics adapter in the form of the 96 EU Iris Xe running at up to 1.5 GHz has seen no change from what was built into the 11th Gen Tiger Lake-UP3 processors, like a i7-1165G7, which is hardly a downside as this iGPU is loaded with modern features such as AV1 video decoding capability and SUHD 4320p monitor support. 

Power Consumption

The i7's base power consumption (also known as the default TDP value or PL1) is 28 W, with 64 W being its maximum Intel-recommended Turbo power consumption (also known as the PL2). The "Minimum Assured" power consumption is fairly high at 20 watts. All in all, an active cooling solution is nearly a must.

Core i7-1370P is built with Intel's third-gen 10 nm process marketed as Intel 7.

Intel Core i5-11400T

► remove from comparison Intel i5-11400T

The Intel Core i5-11400T is a power-efficient six-core desktop processor based on the new Rocket Lake architecture, which was introduced in March 2021. The processor clocks with a base clock of only 1.3 GHz and reaches an all-core boost of 3.7 GHz under load. Intel also gives the Rocket Lake processors the Hyperthreading feature, which allows the i5-11400T to process up to 12 threads simultaneously. As known, the Intel Core i5-11400F is manufactured in the 14 nm process. Nevertheless, many changes have been made with the Rocket Lake architecture, which is also reflected in the performance compared to the Comet Lake. 

Performance

Compared to the Intel Core i5-10400T, the Core i5-11400T offers a significantly better IPC. This can be seen clearly in the single-core benchmarks. The multi-core performance also benefits from the better IPC compared to Comet-Lake. A performance increase of up to 20 percent can be expected.

Graphics

The processors integrates a Intel UHD Graphics 730 iGPU that features 24 EUs clocked at 350 - 1200 MHz.

Power consumption

The TDP turns out relatively low with 35 watts. This is the PL1 value. For Turbo, the Intel Core i5-11400T offers a higher TDP of up to 84 watts with PL2. However, this may only be applied for a maximum of 28 seconds (dew). 

ModelIntel Core i9-11900KIntel Core i7-1370PIntel Core i5-11400T
SeriesIntel Rocket LakeIntel Raptor Lake-PIntel Rocket Lake
CodenameRocket LakeRaptor Lake-PRocket Lake
Series: Rocket Lake Rocket Lake
Intel Core i9-11900K « 3.5 - 5.3 GHz8 / 16 cores16 MB L3
Intel Core i7-11700K3.6 - 5 GHz8 / 16 cores16 MB L3
Intel Core i7-117002.5 - 4.9 GHz8 / 16 cores16 MB L3
Intel Core i5-11600K3.9 - 4.9 GHz6 / 12 cores12 MB L3
Intel Core i5-11400F2.6 - 4.4 GHz6 / 12 cores12 MB L3
Intel Core i5-11400T1.3 - 3.7 GHz6 / 12 cores12 MB L3
Intel Core i7-1370P « 1.4 - 5.2 GHz14 / 20 cores24 MB L3
Intel Core i7-1360P1.6 - 5 GHz12 / 16 cores18 MB L3
Intel Core i5-1350P1.4 - 4.7 GHz12 / 16 cores18 MB L3
Intel Core i5-1340P1.4 - 4.6 GHz12 / 16 cores12 MB L3
Intel Core i9-11900K3.5 - 5.3 GHz8 / 16 cores16 MB L3
Intel Core i7-11700K3.6 - 5 GHz8 / 16 cores16 MB L3
Intel Core i7-117002.5 - 4.9 GHz8 / 16 cores16 MB L3
Intel Core i5-11600K3.9 - 4.9 GHz6 / 12 cores12 MB L3
Intel Core i5-11400F2.6 - 4.4 GHz6 / 12 cores12 MB L3
Intel Core i5-11400T « 1.3 - 3.7 GHz6 / 12 cores12 MB L3
Clock3500 - 5300 MHz1400 - 5200 MHz1300 - 3700 MHz
L1 Cache640 KB1.2 MB480 KB
L2 Cache4 MB11.5 MB3 MB
L3 Cache16 MB24 MB12 MB
Cores / Threads8 / 1614 / 20
6 x 5.2 GHz Intel Golden Cove P-Core
8 x 3.9 GHz Intel Gracemont E-Core
6 / 12
TDP125 Watt28 Watt35 Watt
Technology14 nm10 nm14 nm
max. Temp.100 °C100 °C100 °C
SocketLGA1200FCBGA1744LGA1200
FeaturesDDR4-3200 RAM, PCIe 4, 8 GT/s bus, DL Boost, GNA, vPro, MMX, SSE, SSE2, SSE3, SSSE3, SSE4.1, SSE4.2, AES, AVX, AVX2, AVX512F, FMA3, SHAThread DirectorDDR4-3200 RAM, PCIe 4, 8 GT/s bus, DL Boost, GNA, MMX, SSE, SSE2, SSE3, SSSE3, SSE4.1, SSE4.2, AES, AVX, AVX2, AVX512F, FMA3, SHA
iGPUIntel UHD Graphics Xe 750 32EUs (Rocket Lake) (350 - 1300 MHz)Intel Iris Xe Graphics G7 96EUs ( - 1500 MHz)Intel UHD Graphics 730 (Rocket Lake) (350 - 1200 MHz)
Architecturex86x86x86
Announced
Manufacturerark.intel.comark.intel.comark.intel.com
Die Size276 mm2
$182 U.S.

Benchmarks

Performance Rating - CB R15 + R20 + 7-Zip + X265 + Blender + 3DM11 CPU - i9-11900K
42.7 pt (59%)
Performance Rating - CB R15 + R20 + 7-Zip + X265 + Blender + 3DM11 CPU - i7-1370P
43.5 pt (60%)
Performance Rating - CB R15 + R20 + 7-Zip + X265 + Blender + 3DM11 CPU - i5-11400T
28 pt (39%)
Cinebench 2024 - Cinebench 2024 CPU Single Core
98 Points (68%)
Cinebench 2024 - Cinebench 2024 CPU Multi Core
698 Points (13%)
366 Points (7%)
Cinebench R23 - Cinebench R23 Multi Core
min: 13825     avg: 14669     median: 14747 (14%)     max: 15519 Points
min: 12778     avg: 13559     median: 13159 (12%)     max: 14741 Points
3891 Points (4%)
Cinebench R23 - Cinebench R23 Single Core
min: 1604     avg: 1640     median: 1636 (70%)     max: 1693 Points
min: 1750     avg: 1887     median: 1915 (81%)     max: 1995 Points
972 Points (41%)
Cinebench R20 - Cinebench R20 CPU (Single Core)
min: 619     avg: 633     median: 633 (70%)     max: 647 Points
min: 675     avg: 723     median: 729 (81%)     max: 764 Points
378 Points (42%)
Cinebench R20 - Cinebench R20 CPU (Multi Core)
min: 5055     avg: 5499     median: 5306 (13%)     max: 5997 Points
min: 5079     avg: 5293     median: 5148 (13%)     max: 5651 Points
1500 Points (4%)
Cinebench R15 - Cinebench R15 CPU Multi 64 Bit
min: 2238     avg: 2358     median: 2379 (15%)     max: 2436 Points
min: 2052     avg: 2316     median: 2404 (15%)     max: 2492 Points
642 Points (4%)
Cinebench R15 - Cinebench R15 CPU Single 64 Bit
min: 254     avg: 256.5     median: 255 (77%)     max: 262 Points
min: 258     avg: 268.7     median: 264 (80%)     max: 284 Points
153 Points (46%)
Cinebench R11.5 - Cinebench R11.5 CPU Multi 64 Bit
26.8 Points (35%)
7.3 Points (9%)
Cinebench R11.5 - Cinebench R11.5 CPU Single 64 Bit
3.1 Points (77%)
1.8 Points (45%)
Cinebench R10 - Cinebench R10 Rend. Single (32bit)
10545 Points (64%)
6122 Points (37%)
Cinebench R10 - Cinebench R10 Rend. Multi (32bit)
62024 Points (45%)
20362 Points (15%)
Cinebench R10 - Cinebench R10 Rend. Multi (64bit)
80613 Points (56%)
25835 Points (18%)
Cinebench R10 - Cinebench R10 Rend. Single (64bit)
14149 Points (17%)
8290 Points (10%)
wPrime 2.10 - wPrime 2.0 1024m *
77.9 s (1%)
261.3 s (3%)
wPrime 2.10 - wPrime 2.0 32m *
4 s (1%)
7.8 s (2%)
WinRAR - WinRAR 4.0
9030 Points (14%)
4409 Points (7%)
7-Zip 18.03 - 7-Zip 18.03 Multli Thread 4 runs
min: 54125     avg: 59047     median: 59658.5 (34%)     max: 62746 MIPS
min: 48229     avg: 52228     median: 53407 (31%)     max: 55049 MIPS
19699 MIPS (11%)
7-Zip 18.03 - 7-Zip 18.03 Single Thread 4 runs
min: 6174     avg: 6380     median: 6347 (76%)     max: 6652 MIPS
min: 6140     avg: 6334     median: 6176 (74%)     max: 6687 MIPS
4157 MIPS (50%)
X264 HD Benchmark 4.0 - x264 Pass 2
137 fps (48%)
40 fps (14%)
X264 HD Benchmark 4.0 - x264 Pass 1
309.5 fps (71%)
154.5 fps (36%)
HWBOT x265 Benchmark v2.2 - HWBOT x265 4k Preset
min: 16.6     avg: 18.2     median: 18.2 (32%)     max: 19.8 fps
min: 9.65     avg: 13.2     median: 14.5 (25%)     max: 15.5 fps
5.2 fps (9%)
TrueCrypt - TrueCrypt Serpent
1.2 GB/s (0%)
0.4 GB/s (0%)
TrueCrypt - TrueCrypt Twofish
1.9 GB/s (33%)
0.6 GB/s (11%)
TrueCrypt - TrueCrypt AES
13 GB/s (34%)
4.2 GB/s (11%)
Blender - Blender 3.3 Classroom CPU *
428 Seconds (5%)
min: 444     avg: 563     median: 472 (6%)     max: 774 Seconds
Blender - Blender 2.79 BMW27 CPU *
min: 190.3     avg: 210.8     median: 211.9 (1%)     max: 229 Seconds
min: 246     avg: 297.7     median: 258 (2%)     max: 389 Seconds
704 Seconds (5%)
R Benchmark 2.5 - R Benchmark 2.5 *
min: 0.4733     avg: 0.5     median: 0.5 (11%)     max: 0.4981 sec
min: 0.4244     avg: 0.4     median: 0.4 (9%)     max: 0.4649 sec
0.8 sec (17%)
3DMark 06 - CPU - 3DMark 06 - CPU
10031 Points (21%)
7263 Points (15%)
Super Pi mod 1.5 XS 1M - Super Pi mod 1.5 XS 1M *
6.3 s (1%)
10.1 s (2%)
Super Pi mod 1.5 XS 2M - Super Pi mod 1.5 XS 2M *
13.7 s (1%)
22.2 s (1%)
Super Pi Mod 1.5 XS 32M - Super Pi mod 1.5 XS 32M *
331.4 s (1%)
543 s (2%)
3DMark Vantage - 3DM Vant. Perf. CPU no Physx
46629 Points (41%)
25621 Points (22%)
3DMark 11 - 3DM11 Performance Physics
min: 20149     avg: 20662     median: 20662 (56%)     max: 21175 Points
min: 13806     avg: 15963     median: 16281 (44%)     max: 17803 Points
7319 Points (20%)
3DMark - 3DMark Ice Storm Physics
min: 74965     avg: 79326     median: 79325.5 (64%)     max: 83686 Points
73456 Points (60%)
50228 Points (41%)
3DMark - 3DMark Ice Storm Extreme Physics
75316 Points (61%)
50210 Points (41%)
3DMark - 3DMark Ice Storm Unlimited Physics
85348 Points (72%)
53123 Points (45%)
3DMark - 3DMark Cloud Gate Physics
min: 18242     avg: 19567     median: 20094 (51%)     max: 20364 Points
min: 7878     avg: 11188     median: 10336 (26%)     max: 15350 Points
6654 Points (17%)
3DMark - 3DMark Fire Strike Standard Physics
min: 26699     avg: 27967     median: 28121 (50%)     max: 28927 Points
min: 12349     avg: 17027     median: 15761 (28%)     max: 22970 Points
10064 Points (18%)
3DMark - 3DMark Time Spy CPU
min: 11012     avg: 12563     median: 12902.5 (54%)     max: 13433 Points
min: 4929     avg: 6752     median: 6281 (26%)     max: 9045 Points
Geekbench 6.2 - Geekbench 6.2 Single-Core
min: 2639     avg: 2642     median: 2641.5 (71%)     max: 2644 Points
Geekbench 6.2 - Geekbench 6.2 Multi-Core
min: 12497     avg: 12694     median: 12694 (50%)     max: 12891 Points
Geekbench 5.5 - Geekbench 5.1 - 5.4 64 Bit Single-Core
min: 1748     avg: 1796     median: 1787.5 (75%)     max: 1885 Points
min: 1655     avg: 1843     median: 1871.5 (79%)     max: 1974 Points
1146 Points (48%)
Geekbench 5.5 - Geekbench 5.1 - 5.4 64 Bit Multi-Core
min: 9547     avg: 10328     median: 10483 (19%)     max: 11035 Points
min: 10184     avg: 11028     median: 11048.5 (20%)     max: 11832 Points
3510 Points (6%)
Geekbench 5.0 - Geekbench 5.0 64 Bit Single-Core
1863 Points (8%)
1939 Points (8%)
1130 Points (5%)
Geekbench 5.0 - Geekbench 5.0 64 Bit Multi-Core
11008 Points (35%)
11474 Points (36%)
3495 Points (11%)
Geekbench 4.4 - Geekbench 4.1 - 4.4 64 Bit Single-Core
7976 Points (80%)
4855 Points (49%)
Geekbench 4.4 - Geekbench 4.1 - 4.4 64 Bit Multi-Core
42329 Points (46%)
17082 Points (19%)
Mozilla Kraken 1.1 - Kraken 1.1 Total Score *
min: 544     avg: 566     median: 569.5 (1%)     max: 581 ms
min: 479     avg: 484     median: 485 (1%)     max: 487 ms
887 ms (1%)
WebXPRT 4 - WebXPRT 4 Score
min: 244     avg: 247     median: 247 (71%)     max: 250 Points
min: 270     avg: 277.5     median: 277.5 (80%)     max: 285 Points
WebXPRT 3 - WebXPRT 3 Score
min: 217     avg: 268.5     median: 283.5 (59%)     max: 290 Points
min: 288     avg: 302     median: 296.5 (62%)     max: 327 Points
208 Points (43%)
CrossMark - CrossMark Overall
min: 1728     avg: 1795     median: 1827 (70%)     max: 1830 Points
1125 Points (43%)
Power Consumption - Prime95 Power Consumption - external Monitor *
min: 197     avg: 235.6     median: 221.5 (38%)     max: 302.2 Watt
min: 36.7     avg: 53     median: 60.3 (10%)     max: 62.1 Watt
59.3 Watt (10%)
Power Consumption - Cinebench R15 Multi Power Consumption - external Monitor *
min: 243     avg: 274.3     median: 259.2 (47%)     max: 336 Watt
60.6 Watt (11%)
57.8 Watt (11%)
Power Consumption - Idle Power Consumption - external Monitor *
min: 3.23     avg: 6.9     median: 5.9 (4%)     max: 12.5 Watt
40.9 Watt (27%)
Power Consumption - Idle Power Consumption 150cd 1min *
min: 8.39     avg: 9.8     median: 9.8 (11%)     max: 11.3 Watt
Power Consumption - Cinebench R15 Multi Power Efficiency - external Monitor
min: 7.03     avg: 8.4     median: 8.6 (6%)     max: 9.39 Points per Watt
11.1 Points per Watt (8%)

Average Benchmarks Intel Core i9-11900K → 100% n=21

Average Benchmarks Intel Core i7-1370P → 95% n=21

Average Benchmarks Intel Core i5-11400T → 53% n=21

- Range of benchmark values for this graphics card
- Average benchmark values for this graphics card
* Smaller numbers mean a higher performance
1 This benchmark is not used for the average calculation

v1.28
log 03. 19:57:30

#0 checking url part for id 13161 +0s ... 0s

#1 checking url part for id 14657 +0s ... 0s

#2 checking url part for id 14535 +0s ... 0s

#3 redirected to Ajax server, took 1720029450 +0s ... 0s

#4 did not recreate cache, as it is less than 5 days old! Created at Mon, 01 Jul 2024 05:15:43 +0200 +0s ... 0s

#5 composed specs +0.008s ... 0.008s

#6 did output specs +0s ... 0.008s

#7 getting avg benchmarks for device 13161 +0.003s ... 0.012s

#8 got single benchmarks 13161 +0.009s ... 0.02s

#9 getting avg benchmarks for device 14657 +0.003s ... 0.024s

#10 got single benchmarks 14657 +0.006s ... 0.03s

#11 getting avg benchmarks for device 14535 +0.004s ... 0.033s

#12 got single benchmarks 14535 +0.004s ... 0.037s

#13 got avg benchmarks for devices +0s ... 0.037s

#14 min, max, avg, median took s +0.059s ... 0.096s

#15 return log +0s ... 0.096s

Please share our article, every link counts!
> Expert Reviews and News on Laptops, Smartphones and Tech Innovations > Benchmarks / Tech > Processor Comparison - Head 2 Head
Redaktion, 2017-09- 8 (Update: 2023-07- 1)