Notebookcheck Logo

Intel Core i7-9850H vs AMD Ryzen 5 5600H

Intel Core i7-9850H

► remove from comparison Intel i7-9850H

The Intel Core i7-9850H is a high-end processor for laptops with six cores based on the Coffee Lake architecture (2019 refresh, CFL-HR). The processor clocks at between 2.6 and 4.6 GHz (4 GHz with 6 cores) and can execute up to twelve threads simultaneously thanks to Hyper-Threading. According to Intel, the CPU is manufactured in an improved 14nm (14nm++) process. Compared to the predecessor, the Core i7-8850H, the 9850H offers only improved clock rates.

The Coffee Lake architecture is similar to Kaby Lake and differs only in the amount of cores (now six cores for the high end versions) and the improved 14nm process (14nm++ according to Intel).

Performance

Due to the two additional cores, performance has increased by almost 50% compared to a similar clocked Kaby Lake processor like the Core i7-7920HQ (3.1 - 4.1 GHz). Single-core performance has not improved since its Kaby Lake predecessor. Compared to the i7-8850H, the performance improved only slightly.

Graphics

The integrated Intel UHD Graphics 630 iGPU is supposed to offer a slightly higher performance as its clock rate has been increased by 50 MHz (rumored). The architecture is identical to that of the Intel HD Graphics 630. We do expect a performance improvement, but as a low-end solution it will probably only display current games smoothly at reduced details - if at all.

Power Consumption

Intel specifies the TDP with 45 watts and therefore the i7 is only suited for big laptops with good cooling solutions. Using cTDP-down, the CPU can also be configured to 35 Watt resulting in a reduced performance.

AMD Ryzen 5 5600H

► remove from comparison AMD R5 5600H

The AMD Ryzen 5 5600H is a processor for big (gaming) laptops based on the Cezanne generation. The R5 5600H has six of the eight cores based on the Zen 3 microarchitecture. They are clocked at 3.3 GHz (guaranteed base clock) to 4.2 GHz (Turbo) and support SMT for a total of 12 threads. The chip is manufactured on the modern 7 nm TSMC process.

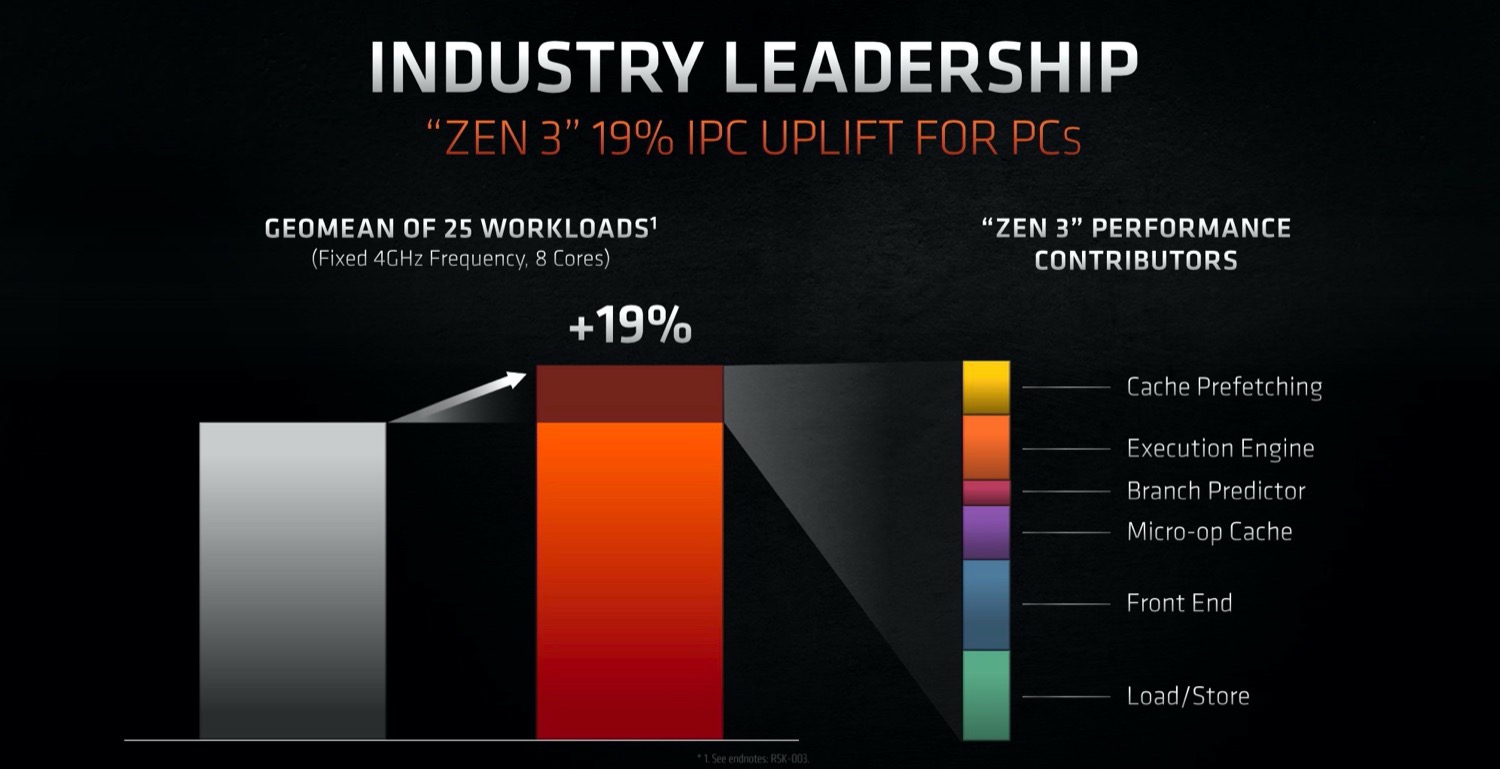
The new Zen 3 microarchitecture offers a significantly higher IPC (instructions per clock) compared to Zen 2. For desktop processors AMD claims 19 percent on average and in applications reviews showed around 12% gains at the same clock speed.

In addition to the six CPU cores, the APU also integrates a Radeon RX Vega 7 integrated graphics processor with 7 CUs running at up to 1800 MHz. The dual channel memory controller supports DDR4-3200 and energy efficient LPDDR4-4266 RAM. Furthermore, 16 MB of L3 cache can be found on the chip.

Performance

The average 5600H in our database is in the same league as the Ryzen 5 6600HS and the Core i7-1260P, as far as multi-thread benchmark scores are concerned.

Thanks to its decent cooling solution and a long-term CPU power limit of 45 W, the Lenovo Legion 5 17 is among the fastest laptops powered by the 5600H that we know of. It can be roughly 30% faster in CPU-bound workloads than the slowest system featuring the same chip in our database, as of August 2023.

Power consumption

This Ryzen 5 series chip has a default TDP (also known as the long-term power limit) of 45 W, a value that laptop makers are allowed to change to anything between 35 W and 54 W with clock speed and performance changing accordingly as a result. A high-performance cooling solution is a must for a CPU like this.

The hexa-core APU is built with the 7 nm TSMC process for decent, as of late 2022, energy efficiency.

ModelIntel Core i7-9850HAMD Ryzen 5 5600H
SeriesIntel Coffee LakeAMD Cezanne (Zen 3, Ryzen 5000)
CodenameCoffee Lake-HCezanne-H (Zen 3)
Series: Cezanne (Zen 3, Ryzen 5000) Cezanne-H (Zen 3)
Intel Core i9-9980HK compare2.4 - 5 GHz8 / 16 cores16 MB L3
Intel Core i9-9880H compare2.3 - 4.8 GHz8 / 16 cores16 MB L3
Intel Core i9-8950HK compare2.9 - 4.8 GHz6 / 12 cores12 MB L3
Intel Xeon E-2186M compare2.9 - 4.8 GHz6 / 12 cores12 MB L3
Intel Xeon E-2276M compare2.8 - 4.7 GHz6 / 12 cores12 MB L3
Intel Core i7-9850H « 2.6 - 4.6 GHz6 / 12 cores12 MB L3
Intel Core i7-9750H compare2.6 - 4.5 GHz6 / 12 cores12 MB L3
Intel Xeon E-2176M compare2.7 - 4.4 GHz6 / 12 cores12 MB L3
Intel Core i7-8850H compare2.6 - 4.3 GHz6 / 12 cores9 MB L3
Intel Core i7-8750H compare2.2 - 4.1 GHz6 / 12 cores9 MB L3
Intel Core i5-9400H compare2.5 - 4.3 GHz4 / 8 cores8 MB L3
Intel Core i5-9300HF compare2.4 - 4.1 GHz4 / 8 cores8 MB L3
Intel Core i5-9300H compare2.4 - 4.1 GHz4 / 8 cores8 MB L3
Intel Core i5-8400H compare2.5 - 4.2 GHz4 / 8 cores8 MB L3
Intel Core i5-8300H compare2.3 - 4 GHz4 / 8 cores8 MB L3
Intel Core i3-8100H compare3 GHz4 / 4 cores8 MB L3
AMD Ryzen 9 5900HX compare3.3 - 4.6 GHz8 / 16 cores16 MB L3
AMD Ryzen 7 5800H compare3.2 - 4.4 GHz8 / 16 cores16 MB L3
AMD Ryzen 5 5600H « 3.3 - 4.2 GHz6 / 12 cores16 MB L3
Clock2600 - 4600 MHz3300 - 4200 MHz
L1 Cache384 KB384 KB
L2 Cache1.5 MB3 MB
L3 Cache12 MB16 MB
Cores / Threads6 / 126 / 12
TDP45 Watt45 Watt
Technology14 nm7 nm
SocketFCBGA1440FP6
FeaturesDual-Channel DDR4 Memory Controller, HyperThreading, AVX, AVX2, Quick Sync, Virtualization, AES-NIDDR4-3200/LPDDR4-4266 RAM, PCIe 3, MMX, SSE, SSE2, SSE3, SSSE3, SSE4A, SSE4.1, SSE4.2, AVX, AVX2, BMI2, ABM, FMA, ADX, SMEP, SMAP, SMT, CPB, AES-NI, RDRAND, RDSEED, SHA, SME
iGPUIntel UHD Graphics 630 (350 - 1150 MHz)AMD Radeon RX Vega 7 ( - 1800 MHz)
Architecturex86x86
Announced
Manufacturerwww.amd.com

Benchmarks

Performance Rating - CB R15 + R20 + 7-Zip + X265 + Blender + 3DM11 CPU - i7-9850H
32.9 pt (46%)
Performance Rating - CB R15 + R20 + 7-Zip + X265 + Blender + 3DM11 CPU - R5 5600H
37 pt (51%)
Cinebench 2024 - Cinebench 2024 CPU Single Core
80 Points (56%)
Cinebench 2024 - Cinebench 2024 CPU Multi Core
439 Points (8%)
Cinebench R23 - Cinebench R23 Multi Core
min: 7945     avg: 9466     median: 9564 (9%)     max: 10416 Points
Cinebench R23 - Cinebench R23 Single Core
min: 1316     avg: 1363     median: 1367 (58%)     max: 1381 Points
Cinebench R20 - Cinebench R20 CPU (Single Core)
min: 425     avg: 439.5     median: 439.5 (49%)     max: 454 Points
min: 527     avg: 533     median: 533 (59%)     max: 538 Points
Cinebench R20 - Cinebench R20 CPU (Multi Core)
min: 1800     avg: 2114     median: 2114 (5%)     max: 2428 Points
min: 3074     avg: 3678     median: 3688.5 (9%)     max: 4059 Points
Cinebench R15 - Cinebench R15 CPU Multi 64 Bit
min: 1114     avg: 1205     median: 1230 (8%)     max: 1272 Points
min: 1319     avg: 1562     median: 1563 (10%)     max: 1723 Points
Cinebench R15 - Cinebench R15 CPU Single 64 Bit
min: 192     avg: 193.8     median: 193 (58%)     max: 196.5 Points
min: 218     avg: 222.2     median: 223 (67%)     max: 225 Points
Cinebench R11.5 - Cinebench R11.5 CPU Multi 64 Bit
12.5 Points (16%)
min: 17.51     avg: 18.7     median: 18.7 (24%)     max: 19.71 Points
Cinebench R11.5 - Cinebench R11.5 CPU Single 64 Bit
2.1 Points (53%)
min: 2.62     avg: 2.6     median: 2.6 (65%)     max: 2.63 Points
Cinebench R10 - Cinebench R10 Rend. Single (32bit)
7169 Points (43%)
min: 5719     avg: 5804     median: 5817 (35%)     max: 5847 Points
Cinebench R10 - Cinebench R10 Rend. Multi (32bit)
31938 Points (23%)
min: 32456     avg: 34272     median: 34229 (25%)     max: 35806 Points
Cinebench R10 - Cinebench R10 Rend. Multi (64bit)
42090 Points (29%)
min: 57574     avg: 60347     median: 59479 (41%)     max: 63144 Points
Cinebench R10 - Cinebench R10 Rend. Single (64bit)
9224 Points (11%)
min: 11082     avg: 11111     median: 11095 (14%)     max: 11201 Points
wPrime 2.10 - wPrime 2.0 1024m *
278 s (3%)
min: 129.204     avg: 201.1     median: 201.1 (2%)     max: 273 s
wPrime 2.10 - wPrime 2.0 32m *
8.3 s (2%)
min: 4.552     avg: 6.6     median: 6.6 (1%)     max: 8.6 s
wPrime 1.55 - wPrime 1.55 1024m *
273 s (1%)
wPrime 1.55 - wPrime 1.55 32m *
8.6 s (5%)
WinRAR - WinRAR 4.0
5621 Points (9%)
7497 Points (12%)
7-Zip 18.03 - 7-Zip 18.03 Multli Thread 4 runs
min: 25786     avg: 29714     median: 31087 (18%)     max: 32268 MIPS
min: 36315     avg: 43438     median: 44558 (26%)     max: 46562 MIPS
7-Zip 18.03 - 7-Zip 18.03 Single Thread 4 runs
min: 5020     avg: 5066     median: 5086 (61%)     max: 5092 MIPS
min: 5213     avg: 5350     median: 5358.5 (64%)     max: 5446 MIPS
X264 HD Benchmark 4.0 - x264 Pass 2
68.3 fps (24%)
95.2 fps (33%)
X264 HD Benchmark 4.0 - x264 Pass 1
201.3 fps (46%)
251.2 fps (58%)
HWBOT x265 Benchmark v2.2 - HWBOT x265 4k Preset
min: 7     avg: 8.4     median: 9 (16%)     max: 9.1 fps
min: 9.92     avg: 12     median: 12.2 (21%)     max: 13.3 fps
TrueCrypt - TrueCrypt Serpent
0.8 GB/s (0%)
min: 0.806     avg: 0.8     median: 0.8 (0%)     max: 0.857 GB/s
TrueCrypt - TrueCrypt Twofish
1.2 GB/s (21%)
min: 1.1     avg: 1.2     median: 1.2 (21%)     max: 1.3 GB/s
TrueCrypt - TrueCrypt AES
7.4 GB/s (19%)
min: 5.3     avg: 7.4     median: 7.4 (19%)     max: 9.4 GB/s
Blender - Blender 3.3 Classroom CPU *
min: 556     avg: 598     median: 584 (7%)     max: 666 Seconds
Blender - Blender 2.79 BMW27 CPU *
min: 411     avg: 459.3     median: 415 (3%)     max: 552 Seconds
min: 299.7     avg: 325.9     median: 324 (2%)     max: 384 Seconds
R Benchmark 2.5 - R Benchmark 2.5 *
min: 0.526     avg: 0.5     median: 0.5 (12%)     max: 0.596 sec
3DMark 06 - CPU - 3DMark 06 - CPU
min: 9137     avg: 10056     median: 10056 (21%)     max: 10975 Points
min: 11446     avg: 12027     median: 11952 (25%)     max: 12757 Points
Super Pi mod 1.5 XS 1M - Super Pi mod 1.5 XS 1M *
8.2 s (2%)
min: 7.2     avg: 7.9     median: 7.9 (2%)     max: 8.672 s
Super Pi mod 1.5 XS 2M - Super Pi mod 1.5 XS 2M *
18.1 s (1%)
min: 15.7     avg: 17.2     median: 17.2 (1%)     max: 18.772 s
Super Pi Mod 1.5 XS 32M - Super Pi mod 1.5 XS 32M *
467.6 s (2%)
min: 366     avg: 406.6     median: 406.6 (2%)     max: 447.224 s
3DMark Vantage - 3DM Vant. Perf. CPU no Physx
min: 26292     avg: 34763     median: 37665 (33%)     max: 40333 Points
min: 52691     avg: 54378     median: 55183 (48%)     max: 55261 Points
3DMark 11 - 3DM11 Performance Physics
min: 9987     avg: 11361     median: 11512 (31%)     max: 12585 Points
min: 8662     avg: 13031     median: 13537 (37%)     max: 15562 Points
3DMark - 3DMark Ice Storm Physics
min: 54664     avg: 57802     median: 56870 (46%)     max: 61872 Points
min: 78452     avg: 81114     median: 80711.5 (66%)     max: 84582 Points
3DMark - 3DMark Ice Storm Extreme Physics
min: 80031     avg: 81646     median: 80543 (65%)     max: 84364 Points
3DMark - 3DMark Ice Storm Unlimited Physics
min: 83587     avg: 84905     median: 85177 (72%)     max: 85952 Points
3DMark - 3DMark Cloud Gate Physics
min: 8390     avg: 9853     median: 9841 (25%)     max: 11328 Points
min: 9129     avg: 12370     median: 12951 (33%)     max: 13650 Points
3DMark - 3DMark Fire Strike Standard Physics
min: 14059     avg: 15802     median: 15330 (27%)     max: 18016 Points
min: 1131     avg: 18287     median: 20724.5 (37%)     max: 21597 Points
3DMark - 3DMark Time Spy CPU
min: 4588     avg: 5605     median: 5953 (25%)     max: 6275 Points
min: 3754     avg: 6442     median: 6796 (29%)     max: 7512 Points
Geekbench 6.2 - Geekbench 6.2 Single-Core
min: 1610     avg: 1729     median: 1728.5 (47%)     max: 1847 Points
Geekbench 6.2 - Geekbench 6.2 Multi-Core
min: 5801     avg: 6856     median: 6855.5 (27%)     max: 7910 Points
Geekbench 5.5 - Geekbench 5.1 - 5.4 64 Bit Single-Core
1150 Points (49%)
min: 1365     avg: 1412     median: 1422.5 (60%)     max: 1445 Points
Geekbench 5.5 - Geekbench 5.1 - 5.4 64 Bit Multi-Core
5270 Points (9%)
min: 4990     avg: 6521     median: 6536 (12%)     max: 7253 Points
Geekbench 5.0 - Geekbench 5.0 64 Bit Single-Core
min: 1135     avg: 1169     median: 1169 (5%)     max: 1203 Points
min: 1341     avg: 1368     median: 1369 (6%)     max: 1393 Points
Geekbench 5.0 - Geekbench 5.0 64 Bit Multi-Core
min: 5353     avg: 5620     median: 5619.5 (18%)     max: 5886 Points
min: 4955     avg: 6222     median: 6483 (20%)     max: 7128 Points
Geekbench 4.4 - Geekbench 4.1 - 4.4 64 Bit Single-Core
min: 5320     avg: 5509     median: 5594 (56%)     max: 5614 Points
min: 5812     avg: 5914     median: 5813 (58%)     max: 6117 Points
Geekbench 4.4 - Geekbench 4.1 - 4.4 64 Bit Multi-Core
min: 18098     avg: 22010     median: 23715 (26%)     max: 24218 Points
min: 27071     avg: 27953     median: 27790 (30%)     max: 28997 Points
Geekbench 4.0 - Geekbench 4.0 64 Bit Single-Core
5376 Points (73%)
Geekbench 4.0 - Geekbench 4.0 64 Bit Multi-Core
20077 Points (49%)
Mozilla Kraken 1.1 - Kraken 1.1 Total Score *
min: 1010     avg: 1018     median: 1015 (1%)     max: 1028 ms
min: 640     avg: 654     median: 652 (1%)     max: 674 ms
Octane V2 - Octane V2 Total Score
min: 38630     avg: 39090     median: 39091 (34%)     max: 39548 Points
min: 64416     avg: 66303     median: 67221 (59%)     max: 67271 Points
WebXPRT 4 - WebXPRT 4 Score
min: 196.4     avg: 200.7     median: 200.2 (58%)     max: 206 Points
WebXPRT 3 - WebXPRT 3 Score
min: 245     avg: 263     median: 267 (56%)     max: 273 Points
CrossMark - CrossMark Overall
min: 1157     avg: 1292     median: 1311 (50%)     max: 1353 Points
Power Consumption - Prime95 Power Consumption - external Monitor *
min: 48.8     avg: 72     median: 69.1 (12%)     max: 104.2 Watt
Power Consumption - Cinebench R15 Multi Power Consumption - external Monitor *
min: 48.2     avg: 75.4     median: 71.7 (13%)     max: 106.2 Watt
Power Consumption - Idle Power Consumption - external Monitor *
min: 5.05     avg: 6.2     median: 6.2 (4%)     max: 7.26 Watt
Power Consumption - Idle Power Consumption 150cd 1min *
min: 5.72     avg: 10.7     median: 11.8 (13%)     max: 17.4 Watt
Power Consumption - Cinebench R15 Multi Power Efficiency - external Monitor
min: 15.8     avg: 21.3     median: 20.9 (16%)     max: 27.4 Points per Watt

Average Benchmarks Intel Core i7-9850H → 100% n=40

Average Benchmarks AMD Ryzen 5 5600H → 121% n=40

- Range of benchmark values for this graphics card
- Average benchmark values for this graphics card
* Smaller numbers mean a higher performance
1 This benchmark is not used for the average calculation

Add one or more devices and compare

In the following list you can select (and also search for) devices that should be added to the comparison. You can select more than one device.

restrict list:

show all (including archived), 2024, 2023
v1.28
log 03. 19:43:03

#0 checking url part for id 11350 +0s ... 0s

#1 checking url part for id 13003 +0s ... 0s

#2 redirected to Ajax server, took 1720028583 +0s ... 0s

#3 did not recreate cache, as it is less than 5 days old! Created at Mon, 01 Jul 2024 05:15:43 +0200 +0s ... 0s

#4 composed specs +0.005s ... 0.005s

#5 did output specs +0s ... 0.005s

#6 getting avg benchmarks for device 11350 +0.002s ... 0.007s

#7 got single benchmarks 11350 +0.001s ... 0.007s

#8 getting avg benchmarks for device 13003 +0.005s ... 0.012s

#9 got single benchmarks 13003 +0.029s ... 0.041s

#10 got avg benchmarks for devices +0s ... 0.041s

#11 min, max, avg, median took s +0.048s ... 0.089s

#12 return log +0.002s ... 0.091s

Please share our article, every link counts!
> Expert Reviews and News on Laptops, Smartphones and Tech Innovations > Benchmarks / Tech > Processor Comparison - Head 2 Head
Redaktion, 2017-09- 8 (Update: 2023-07- 1)