Notebookcheck Logo

Intel Core i7-8706G vs Intel Core i7-1195G7

Intel Core i7-8706G

► remove from comparison Intel i7-8706G

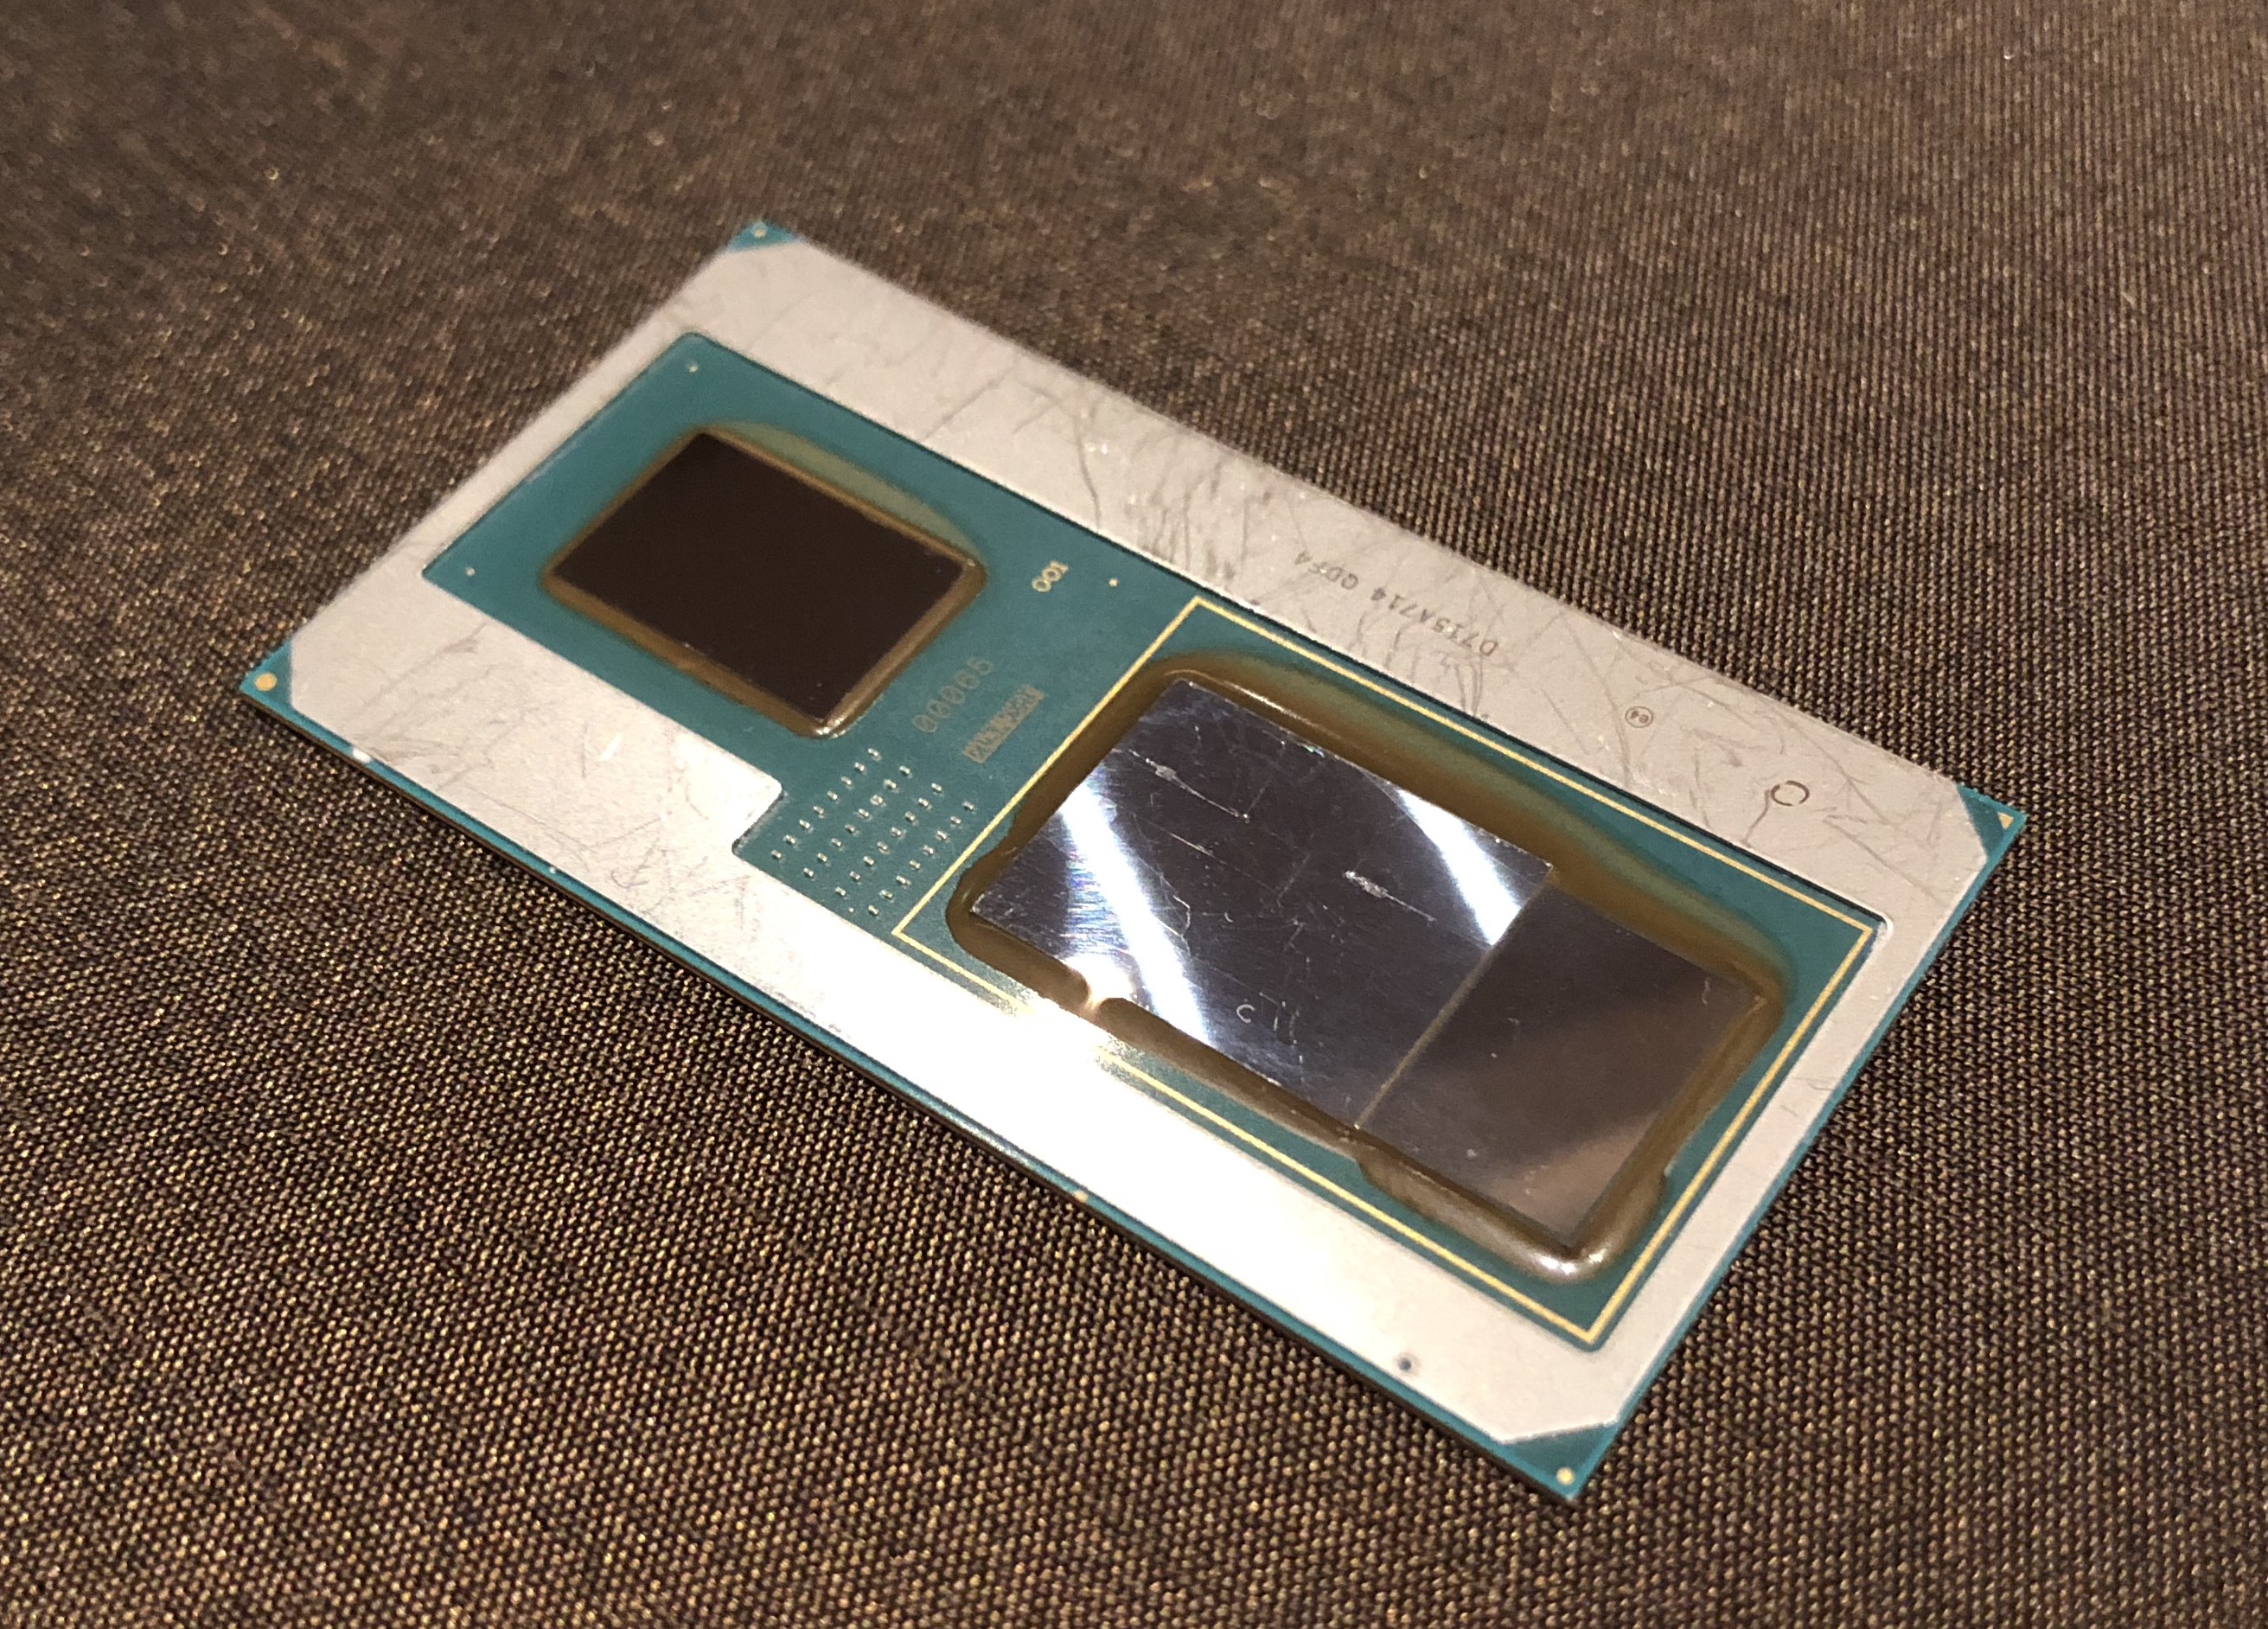
The Intel Core i7-8706G is a fast quad-core processor for notebooks based on the Kaby Lake architecture and was announced in January 2018. similar to the Core i7-7920HQ it integrates four processor cores clocked at 3.1 - 4.1 GHz. As a speciality the package also contains a Vega based graphics card from AMD (with 20 CUs = 1,280 shaders at 1011 MHz) and 4 GB HBM2 graphics memory. The CPU is still produced in 14nm as the i7-7920HQ. Similar to the Core i7-8705G, but with support for vPro (the only Kaby Lake-G CPU with vPro support). Compared to the high-end Kaby Lake-G models, the i7-8706G only features 20 instead of 24 CUs for the Vega GPU and a lower TDP of 65 versus 100 Watt.

Architecture

Intel basically uses the same micro architecture compared to Skylake, so the per-MHz performance does not differ. The manufacturer only reworked the Speed Shift technology for faster dynamic adjustments of voltages and clocks, and the improved 14nm process allows much higher frequencies combined with better efficiency than before.

Performance

Compared to the i7-7920HQ, the i7-8706G should be slightly faster due to the HBM2 memory and the 65 Watt TDP. The performance is therefore sufficient even for very demanding tasks and on par with powerful desktop quad-core processors.

Graphics

In addition to the Intel HD Graphics 630 in the CPU die, the Core i7-8809G also offers an AMD Radeon RX Vega M GL graphics card with 20 CUs and therefore double the amount of the current mobile Ryzen APUs (e.g. Ryzen 7 2700 with 10 CUs) but 4 less than the Vega M GH of the high end models.

Contrary to Skylake, Kaby Lake now supports hardware decoding for H.265/HEVC Main 10 with a 10-bit color depth as well as Google's VP9 codec. The 8809G should also support HDCP 2.2, but for HDMI 2.0, it most likely needs a converter from DisplayPort.

Power Consumption

The CPU chip is manufactured in an improved 14nm process with FinFET transistors. It is rated at a TDP of around 65 Watt and therefore is only suited for laptops with good cooling solutions. Compared to laptops with Core i7-H quad cores and dedicated graphics cards, the i7-8706G based models can be built with smaller chassis.

Intel Core i7-1195G7

► remove from comparison Intel i7-1195G7

The Intel Core i7-1195G7 is a quad-core SoC from the Tiger Lake-UP3 product family designed for thin laptops and Ultrabooks that was introduced in 2021. It integrates four Willow Cove processor cores (8 threads thanks to Hyper-Threading). The base clock (minimum) depends on the configured TDP and can range from 1.3 GHz (12 Watt TDP) up to 2.9 GHz (28 W). The Turbo on one core can reach up to 5 GHz (Turbo Boost 3.0). All cores can reach up to 4.6 GHz. The i7-1195G7 is part of the Tiger Lake UP3 refresh and is the fastest CPU of the Tiger-Lake U line.

Furthermore, Tiger Lake SoCs supports four lanes of PCIe 4, AI hardware acceleration, and the partial integration of Thunderbolt 4/USB 4 and Wi-Fi 6E in the chip.

The 1195G7 integrates the Intel Iris Xe graphics adapter with 96 EUs clocked at 400 - 1400 MHz. The GPU and CPU can together use the 12 MB of L3 cache.

Performance

The average 1195G7 in our database matches the Intel Core i5-10300H in multi-thread performance while, perhaps surprisingly, lagging behind the AMD Ryzen 3 5300U. The makes the i7 a decent lower mid-range chip, as of early 2022. It'll run most apps with virtually no delays or slowdowns which is what the vast majority of users wants.

Thanks to its decent cooling solution and a long-term CPU power limit of slightly more than 30 W, the VAIO SX14 VJS144X0111K is among the fastest laptops built around the 1195G7 that we know of. It can be about 40% faster in CPU-bound workloads than the slowest system featuring the same chip in our database, as of August 2023.

Power consumption

This Core i7 series chip has a default TDP of 12 W to 28 W, the expectation being that laptop makers will go for a higher value in exchange for higher performance. Either way, that's a tad too high to allow for passively cooled designs.

The i7-1195G7 is built with Intel's 3rd generation 10 nm process marketed as SuperFin for below average, as of early 2023, energy efficiency.

ModelIntel Core i7-8706GIntel Core i7-1195G7
SeriesIntel Core i7Intel Tiger Lake
CodenameKaby Lake-GTiger Lake-UP3
Series: Tiger Lake Tiger Lake-UP3
Intel Core i7-8809G compare3.1 - 4.2 GHz4 / 8 cores8 MB L3
Intel Core i7-8709G compare3.1 - 4.1 GHz4 / 8 cores8 MB L3
Intel Core i7-8706G « 3.1 - 4.1 GHz4 / 8 cores8 MB L3
Intel Core i7-8705G compare3.1 - 4.1 GHz4 / 8 cores8 MB L3
Intel Core i7-1195G7 « 2.9 - 5 GHz4 / 8 cores12 MB L3
Intel Core i7-1185G7 compare3 - 4.8 GHz4 / 8 cores12 MB L3
Intel Core i7-1165G7 compare2.8 - 4.7 GHz4 / 8 cores12 MB L3
Intel Core i5-1155G7 compare2.5 - 4.5 GHz4 / 8 cores8 MB L3
Intel Core i5-1145G7 compare2.6 - 4.4 GHz4 / 8 cores8 MB L3
Intel Core i5-1135G7 compare2.4 - 4.2 GHz4 / 8 cores8 MB L3
Intel Core i3-1125G4 compare2 - 3.7 GHz4 / 8 cores8 MB L3
Intel Core i3-1115G4 compare3 - 4.1 GHz2 / 4 cores6 MB L3
Clock3100 - 4100 MHz2900 - 5000 MHz
L1 Cache256 KB320 KB
L2 Cache1 MB5 MB
L3 Cache8 MB12 MB
Cores / Threads4 / 84 / 8
TDP65 Watt28 Watt
Technology14 nm10 nm
SocketBGABGA1449
FeaturesDual-Channel DDR4-2400 Memory Controller, AVX, AVX2, Quick Sync, Virtualization, AES-NI, vProDDR4-3200/LPDDR4x-4266 RAM, PCIe 4, 4 GT/s, DL Boost, GNA, MMX, SSE, SSE2, SSE3, SSSE3, SSE4.1, SSE4.2, AVX, AVX2, AVX-512, BMI2, ABM, FMA, ADX, SMEP, SMAP, EIST, TM1, TM2, HT, Turbo, SST, AES-NI, RDRAND, RDSEED, SHA
iGPUAMD Radeon RX Vega M GL / 870 (931 - 1011 MHz)Intel Iris Xe Graphics G7 96EUs (400 - 1400 MHz)
Architecturex86x86
Announced
max. Temp.100 °C
Manufacturerark.intel.com

Benchmarks

Performance Rating - CB R15 + R20 + 7-Zip + X265 + Blender + 3DM11 CPU - i7-1195G7
34.9 pt (48%)
Cinebench 2024 - Cinebench 2024 CPU Single Core
89 Points (62%)
Cinebench 2024 - Cinebench 2024 CPU Multi Core
307 Points (6%)
Cinebench R23 - Cinebench R23 Multi Core
min: 3142     avg: 5022     median: 5337 (5%)     max: 6806 Points
Cinebench R23 - Cinebench R23 Single Core
min: 1290     avg: 1457     median: 1455 (62%)     max: 1624 Points
Cinebench R20 - Cinebench R20 CPU (Single Core)
min: 498     avg: 563     median: 559 (62%)     max: 620 Points
Cinebench R20 - Cinebench R20 CPU (Multi Core)
min: 1212     avg: 1907     median: 1932 (5%)     max: 2590 Points
Cinebench R15 - Cinebench R15 CPU Multi 64 Bit
781 Points (5%)
min: 574     avg: 853     median: 940 (6%)     max: 999 Points
Cinebench R15 - Cinebench R15 CPU Single 64 Bit
172 Points (52%)
min: 198     avg: 221.4     median: 222 (67%)     max: 238 Points
Cinebench R11.5 - Cinebench R11.5 CPU Multi 64 Bit
8.4 Points (11%)
10.6 Points (14%)
Cinebench R11.5 - Cinebench R11.5 CPU Single 64 Bit
2 Points (50%)
2.7 Points (67%)
Cinebench R10 - Cinebench R10 Rend. Single (32bit)
6549 Points (40%)
Cinebench R10 - Cinebench R10 Rend. Multi (32bit)
24130 Points (17%)
Cinebench R10 - Cinebench R10 Rend. Multi (64bit)
40873 Points (28%)
Cinebench R10 - Cinebench R10 Rend. Single (64bit)
12384 Points (15%)
wPrime 2.10 - wPrime 2.0 1024m *
199.6 s (2%)
281.4 s (3%)
wPrime 2.10 - wPrime 2.0 32m *
6.6 s (1%)
8.2 s (2%)
WinRAR - WinRAR 4.0
5047 Points (8%)
6334 Points (10%)
7-Zip 18.03 - 7-Zip 18.03 Multli Thread 4 runs
min: 17053     avg: 23469     median: 24669 (14%)     max: 26183 MIPS
7-Zip 18.03 - 7-Zip 18.03 Single Thread 4 runs
min: 5059     avg: 5409     median: 5386 (64%)     max: 5890 MIPS
X264 HD Benchmark 4.0 - x264 Pass 2
50 fps (17%)
X264 HD Benchmark 4.0 - x264 Pass 1
182.6 fps (42%)
HWBOT x265 Benchmark v2.2 - HWBOT x265 4k Preset
6.3 fps (11%)
min: 4.23     avg: 6.5     median: 6.6 (12%)     max: 8.8 fps
TrueCrypt - TrueCrypt Serpent
0.4 GB/s (0%)
0.6 GB/s (0%)
TrueCrypt - TrueCrypt Twofish
0.7 GB/s (12%)
1 GB/s (17%)
TrueCrypt - TrueCrypt AES
2.4 GB/s (6%)
6.4 GB/s (17%)
Blender - Blender 3.3 Classroom CPU *
min: 1058     avg: 1105     median: 1105 (14%)     max: 1152 Seconds
Blender - Blender 2.79 BMW27 CPU *
624 Seconds (4%)
min: 473     avg: 691     median: 597.5 (4%)     max: 1211 Seconds
R Benchmark 2.5 - R Benchmark 2.5 *
min: 0.53     avg: 0.6     median: 0.6 (12%)     max: 0.611 sec
3DMark 06 - CPU - 3DMark 06 - CPU
9989 Points (21%)
Super Pi mod 1.5 XS 1M - Super Pi mod 1.5 XS 1M *
9.5 s (2%)
6.7 s (1%)
Super Pi mod 1.5 XS 2M - Super Pi mod 1.5 XS 2M *
20.4 s (1%)
14.7 s (1%)
Super Pi Mod 1.5 XS 32M - Super Pi mod 1.5 XS 32M *
505 s (2%)
354.2 s (2%)
3DMark 11 - 3DM11 Performance Physics
9579 Points (26%)
min: 6684     avg: 10304     median: 10438.5 (28%)     max: 13153 Points
3DMark - 3DMark Ice Storm Physics
38514 Points (31%)
min: 63087     avg: 67596     median: 67595.5 (55%)     max: 72104 Points
3DMark - 3DMark Ice Storm Extreme Physics
min: 64343     avg: 67940     median: 67939.5 (55%)     max: 71536 Points
3DMark - 3DMark Ice Storm Unlimited Physics
min: 65247     avg: 71962     median: 71962 (61%)     max: 78677 Points
3DMark - 3DMark Cloud Gate Physics
7252 Points (18%)
min: 5428     avg: 8477     median: 8745 (22%)     max: 10705 Points
3DMark - 3DMark Fire Strike Standard Physics
10868 Points (19%)
min: 7982     avg: 12497     median: 13225 (24%)     max: 15514 Points
3DMark - 3DMark Time Spy CPU
3789 Points (16%)
min: 2687     avg: 4165     median: 4266 (18%)     max: 5913 Points
Geekbench 6.2 - Geekbench 6.2 Single-Core
min: 1896     avg: 2064     median: 2064 (56%)     max: 2232 Points
Geekbench 6.2 - Geekbench 6.2 Multi-Core
min: 7596     avg: 7644     median: 7644 (30%)     max: 7692 Points
Geekbench 5.5 - Geekbench 5.1 - 5.4 64 Bit Single-Core
min: 1519     avg: 1569     median: 1536 (65%)     max: 1649 Points
Geekbench 5.5 - Geekbench 5.1 - 5.4 64 Bit Multi-Core
min: 4241     avg: 4940     median: 4734 (8%)     max: 6349 Points
Geekbench 5.0 - Geekbench 5.0 64 Bit Single-Core
min: 1575     avg: 1606     median: 1605.5 (7%)     max: 1636 Points
Geekbench 5.0 - Geekbench 5.0 64 Bit Multi-Core
min: 4683     avg: 5066     median: 5066 (16%)     max: 5449 Points
Geekbench 4.4 - Geekbench 4.1 - 4.4 64 Bit Single-Core
5011 Points (50%)
min: 6818     avg: 6894     median: 6894 (69%)     max: 6970 Points
Geekbench 4.4 - Geekbench 4.1 - 4.4 64 Bit Multi-Core
16256 Points (18%)
min: 18904     avg: 20630     median: 20629.5 (23%)     max: 22355 Points
Mozilla Kraken 1.1 - Kraken 1.1 Total Score *
1097 ms (1%)
min: 594     avg: 664     median: 612 (1%)     max: 1047 ms
Sunspider - Sunspider 1.0 Total Score *
118.3 ms (1%)
Octane V2 - Octane V2 Total Score
28486 Points (25%)
69945 Points (61%)
WebXPRT 3 - WebXPRT 3 Score
min: 195     avg: 255     median: 261 (54%)     max: 271 Points
CrossMark - CrossMark Overall
min: 1341     avg: 1412     median: 1435 (55%)     max: 1460 Points
Power Consumption - Prime95 Power Consumption - external Monitor *
min: 15.6     avg: 40.8     median: 36.7 (6%)     max: 65.9 Watt
Power Consumption - Cinebench R15 Multi Power Consumption - external Monitor *
min: 18.4     avg: 46     median: 49.3 (9%)     max: 66 Watt
Power Consumption - Idle Power Consumption 150cd 1min *
min: 3.32     avg: 3.8     median: 3.8 (4%)     max: 4.34 Watt
Power Consumption - Cinebench R15 Multi Power Efficiency - external Monitor
min: 15.1     avg: 21.6     median: 20 (15%)     max: 35.5 Points per Watt

Average Benchmarks Intel Core i7-8706G → 100% n=24

Average Benchmarks Intel Core i7-1195G7 → 131% n=24

- Range of benchmark values for this graphics card
- Average benchmark values for this graphics card
* Smaller numbers mean a higher performance
1 This benchmark is not used for the average calculation

Add one or more devices and compare

In the following list you can select (and also search for) devices that should be added to the comparison. You can select more than one device.

restrict list:

show all (including archived), 2024, 2023
v1.28
log 04. 04:44:28

#0 checking url part for id 9678 +0s ... 0s

#1 checking url part for id 13181 +0s ... 0s

#2 redirected to Ajax server, took 1720061067 +0s ... 0s

#3 did not recreate cache, as it is less than 5 days old! Created at Mon, 01 Jul 2024 05:15:43 +0200 +0s ... 0s

#4 composed specs +0.007s ... 0.008s

#5 did output specs +0s ... 0.008s

#6 getting avg benchmarks for device 9678 +0.001s ... 0.008s

#7 got single benchmarks 9678 +0.004s ... 0.013s

#8 getting avg benchmarks for device 13181 +0.004s ... 0.016s

#9 got single benchmarks 13181 +0.016s ... 0.032s

#10 got avg benchmarks for devices +0s ... 0.032s

#11 min, max, avg, median took s +0.037s ... 0.068s

#12 return log +0.002s ... 0.071s

Please share our article, every link counts!
> Expert Reviews and News on Laptops, Smartphones and Tech Innovations > Benchmarks / Tech > Processor Comparison - Head 2 Head
Redaktion, 2017-09- 8 (Update: 2023-07- 1)