Notebookcheck Logo

Intel Core i7-8500Y vs Apple M3

Intel Core i7-8500Y

► remove from comparison

The Intel Core i7-8500Y is a very efficient dual-core SoC for tablets and passively cooled notebooks based on the Amber Lake generation and will be announced around August 2018. It is the fastest Amber Lake-Y CPU at the time of announcement and consists of two processor cores clocked at 1.5 - 4.2 GHz. Thanks to Hyper Threading, the processor can execute up to four threads simultaneously. The chips also includes the Intel HD Graphics 615 GPU, a dual-channel memory controller (DDR3L/LPDDR3) as well as VP9 and H.265 video de- and encoder. Compared to the Kaby Lake-Y predecessors (e.g. Core i7-7Y75), Amber Lake uses the same architecture produced in the improved 14nm+ FinFET process (no 14nm++) but offers higher clock speeds at an increased TDP rating.

Architecture

Intel basically used the familiar micro architecture from the Skylake / Kaby Lake generation, so the per-MHz performance is identical.

Performance

The performance of the Y series is highly depending on the cooling solution of the laptop / tablet and the TDP settings for sustained load. Therefore, the differences between a Core m3 and a i7 may be rather slim, if the thermals are very limited. The high Turbo clock speeds in Amber Lake should however lead to a very good single thread performance for short bursts.

Graphics

The integrated Intel HD Graphics 615 GPU has 24 Execution Units (EUs) like the old HD Graphics 515 and runs with clocks between 300 and 950 MHz in combination with this processor. The performance heavily depends on the TDP limit as well as the memory configuration; with fast LPDDR3-1866 RAM in dual-channel mode, the GPU should sometimes be able to compete with the HD Graphics 520, but can also be much slower in other scenarios. Modern games from 2016 will, if at all, only run smoothly in the lowest settings.

Contrary to Skylake, Kaby Lake and Amber Lake now also supports hardware decoding for H.265/HEVC Main10 with a 10-bit color depth as well as Google's VP9 codec.

Power Consumption

The chip is manufactured in the second generation 14 nm+ process with FinFET transistors. The typical TDP for the Amber Lake Y-series is specified at 5 Watts (previous generations were 4.5 Watt), and can be adjusted in both directions depending on the usage scenario.

Apple M3

► remove from comparison Apple M3

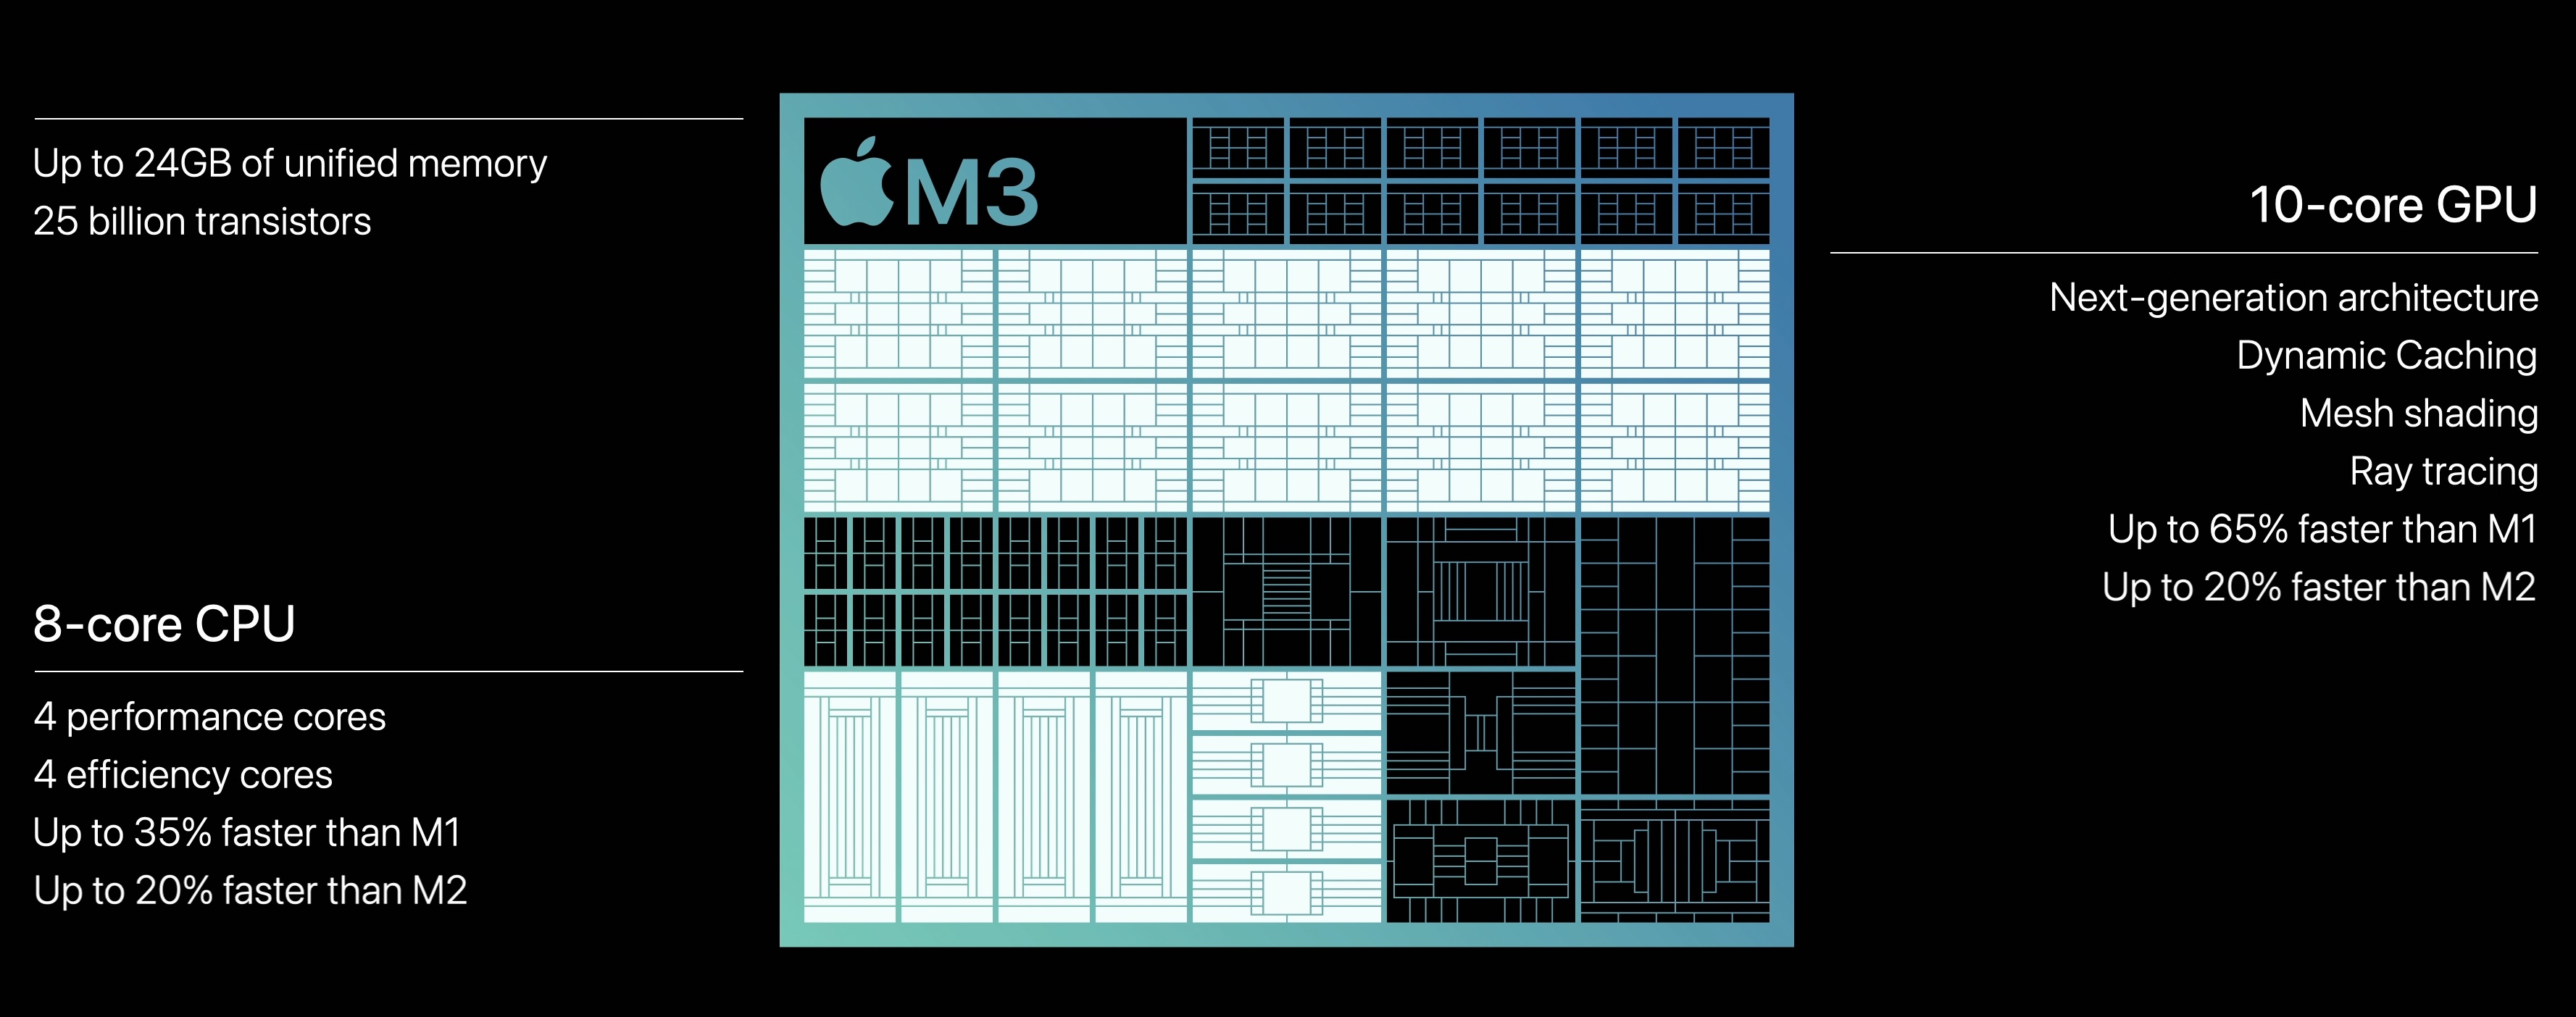
The Apple M3 is a system on a chip (SoC) from Apple for notebooks that was introduced in late 2023. It integrates a new 8-core CPU with 4 performance cores with up to 4.06 GHz and 4 efficiency cores running at up to 2.75 GHz. Apple claims that the CPU is up to 20% faster than in the old Apple M2 (3.5 GHz)

Due to the higher clock speeds and architecture improvements, the processor performance is also significantly better than the M2 in benchmarks (see e.g. Geekbench below) and can keep up with the fastest CPUs in short single-core tests (like the Raptor Lake i9-13950HX).

The M3 also integrates a new graphics adapter with dynamic caching, mesh shading and ray tracing acceleration. According to Apple, it is 20% faster than the GPU in the M2. The chip integrates again 10 GPU cores, but the cheaper variant only offers 8 cores (e.g. in the entry iMac). Furthermore, the GPU only supports 2 displays (an additional 6K60 display to the internal one).

Both GPU and CPU can access the unified memory on the package together. It is still available in 8, 16 and 24 GB variants and offers the same 100 GB/s maximum bandwidth (unlike the Pro models that feature a reduced memory bandwidth). 

The integrated 16-core Neural Engine has also been revised and now offers 18 TOPS peak performance (versus 15.8 TOPS in the M2 but 35 TOPS in the new A17 Pro). The video engine now supports AV1 decoding in hardware. H.264, HEVC and ProRes (RAW) can still be decoded and encoded.

Unfortunately, the integrated wireless network module only supports Wi-Fi 6E (no Wi-Fi 7) and due to the support of only a single external monitor, the chip also has to make do with no Thunderbolt 4 (Thunderbolt 3 / USB 4 support only for up to 40 Gbit/s).

The chip is manufactured on the current 3nm TSMC process (N3B most likely) and contains 25 billion transistors (+25% vs. Apple M2). The 3nm process should also contribute to the excellent efficiency of the chip. Under load, the M3 CPU consumes approximately 20 Watt.

ModelIntel Core i7-8500YApple M3
SeriesIntel Amber LakeApple Apple M3
CodenameAmber Lake-Y
Series: Apple M3
Intel Core i5-10310Y compare1.1 - 4.1 GHz4 / 8 cores6 MB L3
Intel Core i5-10210Y compare1 - 4 GHz4 / 8 cores6 MB L3
Intel Core i7-8500Y « 1.5 - 4.2 GHz2 / 4 cores4 MB L3
Intel Core i3-10110Y compare1 - 4 GHz2 / 4 cores4 MB L3
Intel Core i5-8210Y compare1.6 - 3.6 GHz2 / 4 cores4 MB L3
Intel Core i5-8200Y compare1.3 - 3.9 GHz2 / 4 cores4 MB L3
Intel Core i3-10100Y compare1.3 - 3.9 GHz2 / 4 cores4 MB L3
Intel Core m3-8100Y compare1.1 - 3.4 GHz2 / 4 cores4 MB L3
Intel Pentium Gold 6500Y compare1.1 - 3.4 GHz2 / 4 cores4 MB L3
Apple M3 Max 16-Core compare2.75 - 4.06 GHz16 / 16 cores
Apple M3 Max 14-Core compare2.75 - 4.06 GHz14 / 14 cores
Apple M3 Pro 12-Core compare2.75 - 4.06 GHz12 / 12 cores
Apple M3 Pro 11-Core compare2.75 - 4.06 GHz11 / 11 cores
Apple M3 « 2.75 - 4.06 GHz8 / 8 cores
Clock1500 - 4200 MHz2748 - 4056 MHz
L1 Cache128 KB
L2 Cache512 KB4 MB
L3 Cache4 MB
Cores / Threads2 / 48 / 8
4 x 4.1 GHz Apple M3 P-Core
4 x 2.7 GHz Apple M3 E-Core
TDP5 Watt
Technology14 nm3 nm
max. Temp.100 °C
SocketBGA
FeaturesDual-Channel DDR3L-1600/LPDDR3-1866 Memory Controller, HyperThreading, AVX, AVX2, Quick Sync, Virtualization, AES-NI, vPro, TXTARMv8 Instruction Set
iGPUIntel UHD Graphics 615 (300 - 1000 MHz)Apple M3 10-Core GPU
Architecturex86ARM
Announced
Transistors25000 Million
Manufacturerwww.apple.com

Benchmarks

Performance Rating - CB R15 + R20 + 7-Zip + X265 + Blender + 3DM11 CPU - i7-8500Y
24.6 pt (34%)
Cinebench 2024 - Cinebench 2024 CPU Single Core
100%
1 M3 +
min: 140     avg: 141     median: 141 (98%)     max: 142 Points
Cinebench 2024 - Cinebench 2024 CPU Multi Core
100%
1 M3 +
min: 576     avg: 622     median: 599.5 (11%)     max: 712 Points
Cinebench R23 - Cinebench R23 Multi Core
100%
1 M3 +
min: 10074     avg: 10275     median: 10298 (10%)     max: 10454 Points
Cinebench R23 - Cinebench R23 Single Core
100%
1 M3 +
min: 1900     avg: 1901     median: 1900 (81%)     max: 1904 Points
Cinebench R20 - Cinebench R20 CPU (Single Core)
min: 304     avg: 312     median: 312 (35%)     max: 320 Points
162%
M3 +
504 Points (56%)
Cinebench R20 - Cinebench R20 CPU (Multi Core)
min: 584     avg: 588     median: 587.5 (1%)     max: 591 Points
480%
M3 +
2818 Points (7%)
Cinebench R15 - Cinebench R15 CPU Multi 64 Bit
min: 245     avg: 252.3     median: 246.5 (2%)     max: 271 Points
608%
M3 +
1499 Points (9%)
Cinebench R15 - Cinebench R15 CPU Single 64 Bit
min: 126     avg: 129.8     median: 130.5 (39%)     max: 132 Points
208%
M3 +
271 Points (82%)
Cinebench R11.5 - Cinebench R11.5 CPU Multi 64 Bit
min: 2.45     avg: 2.5     median: 2.5 (3%)     max: 2.53 Points
Cinebench R11.5 - Cinebench R11.5 CPU Single 64 Bit
min: 1.43     avg: 1.5     median: 1.5 (36%)     max: 1.47 Points
Cinebench R10 - Cinebench R10 Rend. Single (32bit)
min: 4898     avg: 5027     median: 5027 (30%)     max: 5156 Points
Cinebench R10 - Cinebench R10 Rend. Multi (32bit)
min: 8493     avg: 8706     median: 8706 (6%)     max: 8919 Points
wPrime 2.10 - wPrime 2.0 1024m *
673 s (8%)
wPrime 2.10 - wPrime 2.0 32m *
15.5 s (3%)
WinRAR - WinRAR 4.0
2483 Points (4%)
7-Zip 18.03 - 7-Zip 18.03 Multli Thread 4 runs
min: 7982     avg: 10709     median: 10709 (6%)     max: 13436 MIPS
7-Zip 18.03 - 7-Zip 18.03 Single Thread 4 runs
min: 3568     avg: 4368     median: 4367.5 (52%)     max: 5167 MIPS
X264 HD Benchmark 4.0 - x264 Pass 2
14.1 fps (5%)
X264 HD Benchmark 4.0 - x264 Pass 1
83.3 fps (19%)
HWBOT x265 Benchmark v2.2 - HWBOT x265 4k Preset
2.1 fps (4%)
TrueCrypt - TrueCrypt Serpent
0.2 GB/s (0%)
TrueCrypt - TrueCrypt Twofish
0.4 GB/s (6%)
TrueCrypt - TrueCrypt AES
2.2 GB/s (6%)
Blender - Blender 3.3 Classroom CPU *
100%
1 M3 +
min: 491     avg: 590     median: 517 (7%)     max: 761 Seconds
Blender - Blender 2.79 BMW27 CPU *
min: 1772     avg: 1966     median: 1965.5 (14%)     max: 2159 Seconds
112%
M3 +
min: 474     avg: 509     median: 494 (3%)     max: 558 Seconds
3DMark 06 - CPU - 3DMark 06 - CPU
min: 3015     avg: 3056     median: 3056 (7%)     max: 3097 Points
Super Pi mod 1.5 XS 1M - Super Pi mod 1.5 XS 1M *
9.3 s (2%)
Super Pi mod 1.5 XS 2M - Super Pi mod 1.5 XS 2M *
22.4 s (1%)
Super Pi Mod 1.5 XS 32M - Super Pi mod 1.5 XS 32M *
657 s (3%)
3DMark Vantage - 3DM Vant. Perf. CPU no Physx
8123 Points (7%)
3DMark 11 - 3DM11 Performance Physics
min: 2942     avg: 3242     median: 3254.5 (9%)     max: 3516 Points
3DMark - 3DMark Ice Storm Physics
min: 25064     avg: 29890     median: 28391 (23%)     max: 36216 Points
3DMark - 3DMark Ice Storm Extreme Physics
min: 26981     avg: 31559     median: 31558.5 (26%)     max: 36136 Points
3DMark - 3DMark Ice Storm Unlimited Physics
min: 35630     avg: 38017     median: 38016.5 (32%)     max: 40403 Points
3DMark - 3DMark Cloud Gate Physics
min: 2260     avg: 2753     median: 2896 (7%)     max: 2959 Points
3DMark - 3DMark Fire Strike Standard Physics
min: 3308     avg: 3993     median: 4201 (7%)     max: 4261 Points
3DMark - 3DMark Time Spy CPU
min: 1204     avg: 1292     median: 1240 (5%)     max: 1431 Points
Geekbench 6.2 - Geekbench 6.2 Single-Core
100%
1 M3 +
min: 3026     avg: 3077     median: 3076 (83%)     max: 3130 Points
Geekbench 6.2 - Geekbench 6.2 Multi-Core
100%
1 M3 +
min: 11863     avg: 11984     median: 11992 (47%)     max: 12066 Points
Geekbench 5.5 - Geekbench 5.1 - 5.4 64 Bit Single-Core
100%
1 M3 +
min: 2256     avg: 2316     median: 2342 (99%)     max: 2350 Points
Geekbench 5.5 - Geekbench 5.1 - 5.4 64 Bit Multi-Core
100%
1 M3 +
min: 10570     avg: 10697     median: 10748 (19%)     max: 10774 Points
Geekbench 5.0 - Geekbench 5.0 64 Bit Single-Core
858 Points (4%)
Geekbench 5.0 - Geekbench 5.0 64 Bit Multi-Core
1504 Points (5%)
Geekbench 4.4 - Geekbench 4.1 - 4.4 64 Bit Single-Core
min: 3910     avg: 4398     median: 4397.5 (44%)     max: 4885 Points
Geekbench 4.4 - Geekbench 4.1 - 4.4 64 Bit Multi-Core
min: 6223     avg: 7224     median: 7224 (8%)     max: 8225 Points
Geekbench 3 - Geekbench 3 32 Bit Multi-Core
5614 Points (10%)
Geekbench 3 - Geekbench 3 32 Bit Single-Core
3245 Points (63%)
Mozilla Kraken 1.1 - Kraken 1.1 Total Score *
min: 1281     avg: 1499     median: 1446 (2%)     max: 1822 ms
101%
M3 +
min: 362.8     avg: 366.4     median: 363.1 (0%)     max: 373.2 ms
Octane V2 - Octane V2 Total Score
min: 22283     avg: 24377     median: 24631.5 (22%)     max: 25962 Points
394%
M3 +
min: 96622     avg: 97216     median: 96933 (85%)     max: 98093 Points
WebXPRT 4 - WebXPRT 4 Score
100%
1 M3 +
min: 313     avg: 314     median: 314 (90%)     max: 315 Points
WebXPRT 3 - WebXPRT 3 Score
100%
1 M3 +
min: 423     avg: 438.7     median: 445 (93%)     max: 448 Points
CrossMark - CrossMark Overall
100%
1 M3 +
min: 1847     avg: 1850     median: 1847 (71%)     max: 1857 Points
Power Consumption - Idle Power Consumption - external Monitor *
100%
1 M3 +
min: 2.63     avg: 2.8     median: 2.8 (2%)     max: 2.87 Watt
Power Consumption - Idle Power Consumption 150cd 1min *
100%
1 M3 +
min: 3.94     avg: 4.4     median: 4.4 (5%)     max: 4.7 Watt

Average Benchmarks Intel Core i7-8500Y → 100% n=7

Average Benchmarks Apple M3 → 295% n=7

- Range of benchmark values for this graphics card
- Average benchmark values for this graphics card
* Smaller numbers mean a higher performance
1 This benchmark is not used for the average calculation

Add one or more devices and compare

In the following list you can select (and also search for) devices that should be added to the comparison. You can select more than one device.

restrict list:

show all (including archived), 2024, 2023
v1.28
log 04. 10:22:31

#0 checking url part for id 10088 +0s ... 0s

#1 checking url part for id 15110 +0s ... 0s

#2 redirected to Ajax server, took 1720081351 +0s ... 0s

#3 did not recreate cache, as it is less than 5 days old! Created at Thu, 04 Jul 2024 05:15:21 +0200 +0s ... 0s

#4 composed specs +0.005s ... 0.005s

#5 did output specs +0s ... 0.005s

#6 getting avg benchmarks for device 10088 +0.002s ... 0.007s

#7 got single benchmarks 10088 +0.004s ... 0.011s

#8 getting avg benchmarks for device 15110 +0.001s ... 0.011s

#9 got single benchmarks 15110 +0.006s ... 0.017s

#10 got avg benchmarks for devices +0s ... 0.017s

#11 min, max, avg, median took s +0.021s ... 0.039s

#12 return log +0.002s ... 0.041s

Please share our article, every link counts!
> Expert Reviews and News on Laptops, Smartphones and Tech Innovations > Benchmarks / Tech > Processor Comparison - Head 2 Head
Redaktion, 2017-09- 8 (Update: 2023-07- 1)