Notebookcheck Logo

Intel Core i7-14700K vs Intel Core i5-7Y54 vs Intel Core i9-14900K

Intel Core i7-14700K

► remove from comparison Intel i7-14700K

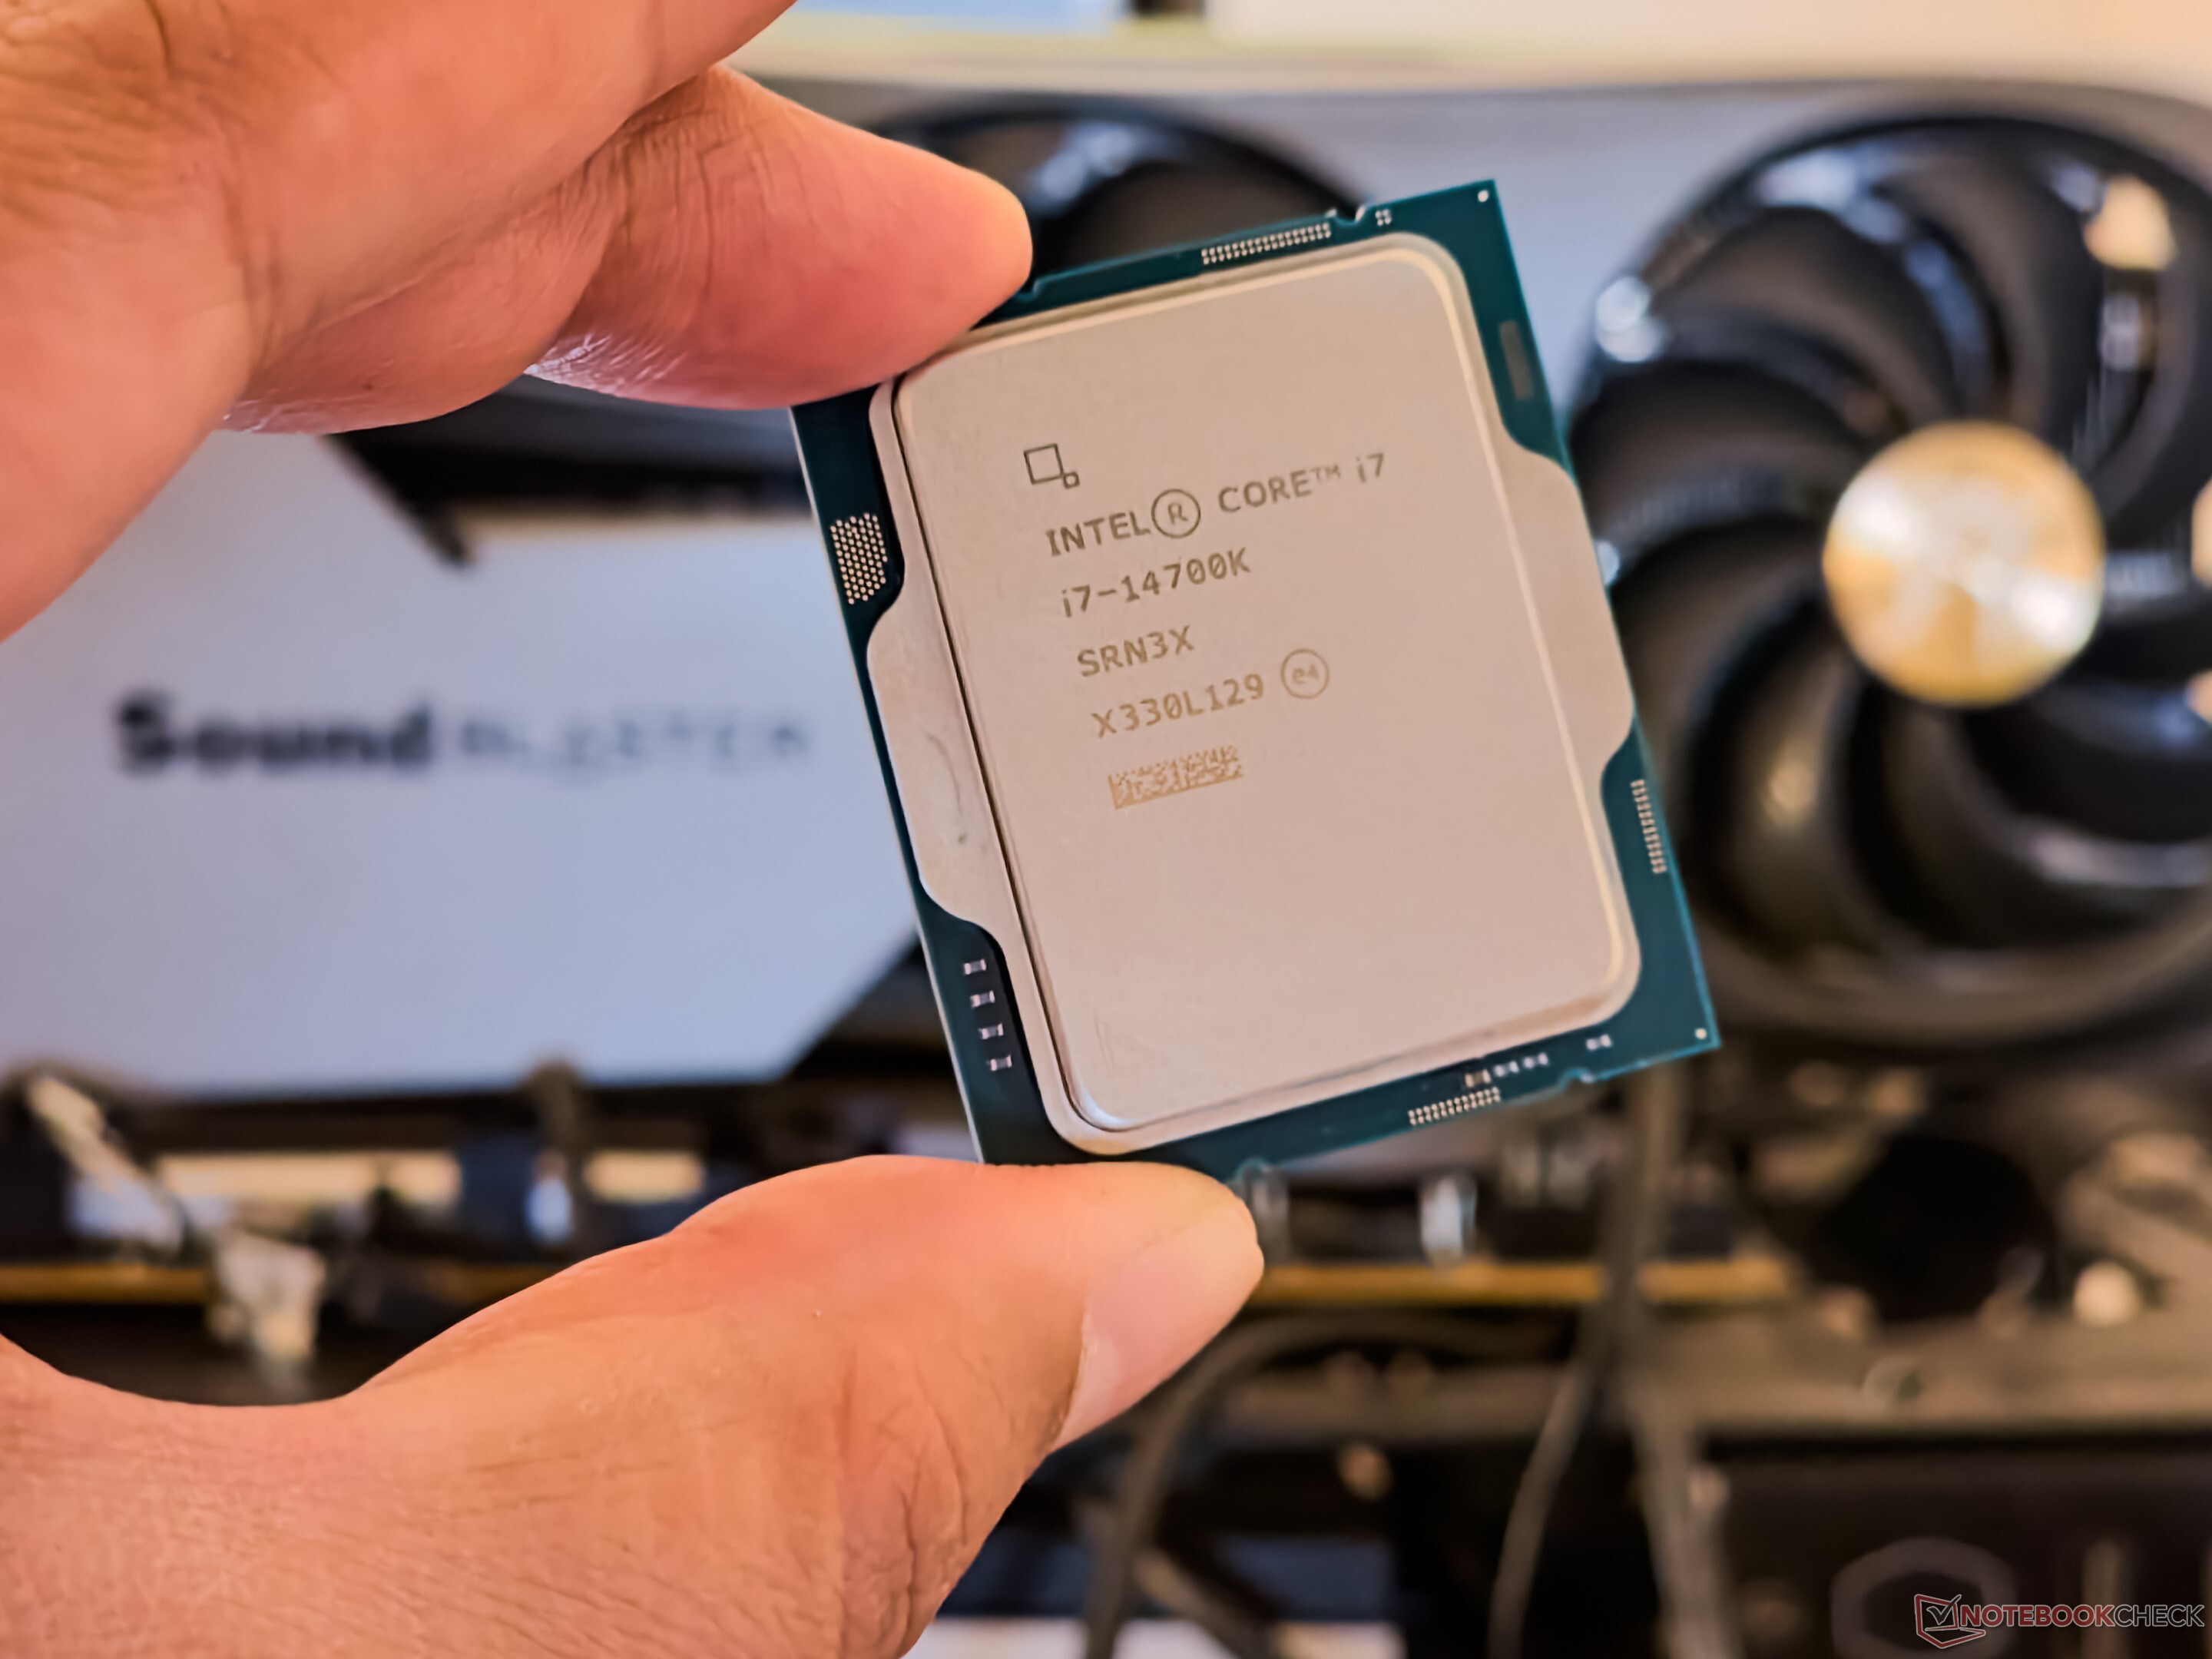
The Intel Core i5-14700K is a desktop processor based on the Raptor Lake architecture, which inherits the 13th generation of Intel Core processors with minor improvements. The processor offers a base clock of 2.5 GHz or 3.4 GHz and reaches up to 5.6 GHz in Turbo. The basic CPU structure remains unchanged. The Intel Core i5-14700K features 8 P-cores and 12 E-cores, allowing up to 28 threads to be processed in parallel. The Intel Core i5-14700K still offers a freely selectable multiplier, which makes overclocking much easier. It is also based on the LGA 1700 socket, which was already introduced with Alder Lake.

Performance

Compared to the Intel Core i5-13700K, the IPC of the new Core i5-14700K has only been increased slightly. This means that the difference in performance is only due to the higher number of efficiency cores (12 vs. 8) and higher clock rates.


Graphics unit

Like the Intel Core i5-13700K, the Intel Core i5-14700K also has an integrated graphics unit. The Intel Iris Xe architecture continues to serve as the basis. In terms of performance, however, nothing has changed with the Intel UHD Graphics 770.

Power consumption

The TDP of the Intel Core i5-14700K is 125 watts, with the option of consuming up to 253 watts in Turbo mode.

Intel Core i5-7Y54

► remove from comparison Intel i5-7Y54

The Intel Core i5-7Y54 is a very efficient dual-core SoC for tablets and passively cooled notebooks based on the Kaby Lake architecture and was announced in the end of August 2016. The CPU consists of two processor cores clocked at 1.2-3.2 GHz (2-core Turbo not specified yet). Thanks to Hyper Threading, the processor can execute up to four threads simultaneously. The chips also includes the Intel HD Graphics 615 GPU, a dual-channel memory controller (DDR3L/LPDDR3) as well as VP9 and H.265 video de- and encoder. It is still produced in a 14 nm process with FinFET transistors. 

Architecture

Intel basically used the familiar micro architecture from the Skylake generation, so the per-MHz performance is identical. Only the Speed-Shift technology for faster dynamic adjustments of the voltages and clocks was improved, and the matured 14 nm process now also enables much higher frequencies and better efficiency than before. 

Performance

Despite the changed designation, the Core i5-7Y54 is the successor to the Core m5-6Y54 (Skylake Y-series), so the chip does not reach the performance level of other Core i processors due to the lower TDP. Thanks to its high Turbo clock, the 7Y54 can sometimes keep up with the 15 Watt models for short peak load and single-thread scenarios, but the clocks will drop significantly under sustained workloads. The CPU is still suitable for many more demanding applications as well as multitasking. 

Graphics

The integrated Intel HD Graphics 615 GPU has 24 Execution Units (EUs) like the old HD Graphics 515 and runs with clocks between 300 and 950 MHz in combination with this processor. The performance heavily depends on the TDP limit as well as the memory configuration; with fast LPDDR3-1866 RAM in dual-channel mode, the GPU should sometimes be able to compete with the HD Graphics 520, but can also be much slower in other scenarios. Modern games from 2016 will, if at all, only run smoothly in the lowest settings.

Contrary to Skylake, Kaby Lake now also supports hardware decoding for H.265/HEVC Main10 with a 10-bit color depth as well as Google's VP9 codec.

Power Consumption

The chip is manufactured in an improved 14 nm process with FinFET transistors, so the power efficiency was once again improved significantly. The typical TDP for the Y-series is specified at 4.5 Watts, and can be adjusted in both directions depending on the usage scenario.

Intel Core i9-14900K

► remove from comparison Intel i9-14900K

The Intel Core i9-14900K is a high-end processor based on the Raptor Lake architecture, similar to the Intel Core i9-13900K last year. The base clock is 3.2 GHz and can reach up to 6 GHz under optimal conditions. The total of 32 threads are still divided into 8 P and 16 E cores. The 8 performance cores (P-cores) also offer hyperthreading, which means that a total of 32 threads can be processed simultaneously in conjunction with the 16 energy-efficient E-cores. As before, the K models continue to offer a freely selectable multiplier, which simplifies overclocking. The Intel Core i9-14900K uses the same CPU socket (LGA 1700) as the Intel Core i9-13900K. This means you don't necessarily need a new motherboard, as the 600 series chipsets support the new processors after a BIOS update. There is also still the option of using DDR4 for the RAM.

Performance

Compared to the Intel Core i9-13900K, the Core i9-14900K still offers 8 P-cores, which are relieved by 16 additional E-cores for demanding applications and thus ensure very high multi-thread performance. In comparison, however, the Intel Core i9-14900K can only gain a slight lead. The e-cores primarily take care of background applications. The hybrid architecture relies on the Intel Thread Director, which is responsible for the correct allocation of tasks. Meanwhile, the IPC could only be increased slightly. As an innovation with the Intel Core i9-14900K, the manufacturer is increasingly relying on AI, which is also used for overclocking. With one click in the Intel Extreme Utility, the tool checks the entire system and makes the necessary settings.

Graphics unit

Like the Intel Core i9-13900K, the Intel Core i9-14900K offers an integrated graphics unit. The Intel Iris Xe architecture continues to serve as the basis. In terms of performance, however, nothing has changed with the Intel UHD Graphics 770.

Power consumption

The Intel Core i9-14900K is specified with a TDP of 125 watts, which corresponds to the PL1 value. In Boost mode, the processor's performance can increase to up to 253 watts (PL2). However, this requires very good cooling. Compared to the Intel Core i9-13900K, the specified power consumption does not increase if the limits are adhered to. The situation is different if the limits are deactivated. As this value depends on the overall system, we cannot make an exact statement on this.

ModelIntel Core i7-14700KIntel Core i5-7Y54Intel Core i9-14900K
SeriesIntel Raptor Lake-RIntel Kaby LakeIntel Raptor Lake-R
CodenameRaptor LakeKaby LakeRaptor Lake
Series: Raptor Lake-R Raptor Lake
Intel Core i9-14900K3.2 - 6 GHz24 / 32 cores36 MB L3
Intel Core i7-14700K « 2.5 - 5.6 GHz20 / 28 cores33 MB L3
Intel Core i5-14600K3.5 - 5.3 GHz14 / 20 cores24 MB L3
Intel Core i7-7700K4.2 - 4.5 GHz4 / 8 cores8 MB L3
Intel Core i7-77003.6 - 4.2 GHz4 / 8 cores8 MB L3
Intel Xeon E3-1535M v63.1 - 4.2 GHz4 / 8 cores8 MB L3
Intel Core i7-7920HQ3.1 - 4.1 GHz4 / 8 cores8 MB L3
Intel Core i7-7700T2.9 - 3.8 GHz4 / 8 cores8 MB L3
Intel Core i5-7600K3.8 - 4.2 GHz4 / 4 cores8 MB L3
Intel Xeon E3-1505M v63 - 4 GHz4 / 8 cores8 MB L3
Intel Core i7-7820HQ2.9 - 3.9 GHz4 / 8 cores8 MB L3
Intel Core i7-7820HK2.9 - 3.9 GHz4 / 8 cores8 MB L3
Intel Core i7-7700HQ2.8 - 3.8 GHz4 / 8 cores6 MB L3
Intel Core i5-75003.4 - 3.8 GHz4 / 4 cores6 MB L3
Intel Core i5-7440HQ2.8 - 3.8 GHz4 / 4 cores6 MB L3
Intel Core i7-7567U3.5 - 4 GHz2 / 4 cores4 MB L3
Intel Core i7-7660U2.5 - 4 GHz2 / 4 cores4 MB L3
Intel Core i7-7600U2.8 - 3.9 GHz2 / 4 cores4 MB L3
Intel Core i5-7300HQ2.5 - 3.5 GHz4 / 4 cores6 MB L3
Intel Core i5-7500T2.7 - 3.3 GHz4 / 4 cores6 MB L3
Intel Core i5-7287U3.3 - 3.7 GHz2 / 4 cores4 MB L3
Intel Core i7-7560U2.4 - 3.8 GHz2 / 4 cores4 MB L3
Intel Core i5-7267U3.1 - 3.5 GHz2 / 4 cores4 MB L3
Intel Core i5-7360U2.3 - 3.6 GHz2 / 4 cores4 MB L3
Intel Core i7-7500U2.7 - 3.5 GHz2 / 4 cores4 MB L3
Intel Core i5-7300U2.6 - 3.5 GHz2 / 4 cores3 MB L3
Intel Core i5-7260U2.2 - 3.4 GHz2 / 4 cores4 MB L3
Intel Core i5-7200U2.5 - 3.1 GHz2 / 4 cores3 MB L3
Intel Core i3-7100H3 GHz2 / 4 cores3 MB L3
Intel Core i3-7167U2.8 GHz2 / 4 cores3 MB L3
Intel Core i7-7Y751.3 - 3.6 GHz2 / 4 cores4 MB L3
Intel Core i5-7Y571.2 - 3.3 GHz2 / 4 cores4 MB L3
Intel Core i5-7Y54 « 1.2 - 3.2 GHz2 / 4 cores4 MB L3
Intel Core i3-7100U2.4 GHz2 / 4 cores3 MB L3
Intel Core m3-7Y321 - 3 GHz2 / 4 cores4 MB L3
Intel Pentium Gold 4415U2.3 GHz2 / 4 cores2 MB L3
Intel Core m3-7Y301 - 2.6 GHz2 / 4 cores4 MB L3
Intel Celeron 3965U2.2 GHz2 / 2 cores2 MB L3
Intel Core i3-7020U2.3 GHz2 / 4 cores3 MB L3
Intel Celeron 3867U1.8 GHz2 / 2 cores2 MB L3
Intel Celeron 3865U1.8 GHz2 / 2 cores2 MB L3
Intel Pentium Gold 4425Y1.7 GHz2 / 4 cores2 MB L3
Intel Pentium Gold 4415Y1.6 GHz2 / 4 cores2 MB L3
Intel Pentium Gold 4410Y1.5 GHz2 / 4 cores2 MB L3
Intel Celeron 3965Y1.5 GHz2 / 2 cores2 MB L3
Intel Core i9-14900K « 3.2 - 6 GHz24 / 32 cores36 MB L3
Intel Core i7-14700K2.5 - 5.6 GHz20 / 28 cores33 MB L3
Intel Core i5-14600K3.5 - 5.3 GHz14 / 20 cores24 MB L3
Clock2500 - 5600 MHz1200 - 3200 MHz3200 - 6000 MHz
L2 Cache28 MB512 KB32 MB
L3 Cache33 MB4 MB36 MB
Cores / Threads20 / 28
8 x 5.6 GHz Intel Raptor Cove P-Core
12 x 3.4 GHz Intel Gracemont E-Core
2 / 424 / 32
8 x 6.0 GHz Intel Raptor Cove P-Core
16 x 4.4 GHz Intel Gracemont E-Core
TDP125 Watt4.5 Watt125 Watt
Technology10 nm14 nm10 nm
max. Temp.100 °C100 °C100 °C
SocketLGA 1700BGALGA 1700
FeaturesIntel UHD Graphics 770, DDR5 5600 MT/s, DDR4 3200 MT/sDual-Channel DDR3L-1600/LPDDR3-1866 Memory Controller, HyperThreading, AVX, AVX2, Quick Sync, Virtualization, AES-NI, TXTIntel UHD Graphics 770, DDR5 5600 MT/s, DDR4 3200 MT/s
iGPUIntel UHD Graphics 770 (300 - 1600 MHz)Intel HD Graphics 615 (300 - 950 MHz)Intel UHD Graphics 770 (300 - 1650 MHz)
Architecturex86x86x86
$319 U.S.$281 U.S.$589 U.S.
Announced
Manufacturerark.intel.comark.intel.comark.intel.com
L1 Cache128 KB
Die Size257 mm2

Benchmarks

Performance Rating - CB R15 + R20 + 7-Zip + X265 + Blender + 3DM11 CPU - i7-14700K
57.8 pt (80%)
Performance Rating - CB R15 + R20 + 7-Zip + X265 + Blender + 3DM11 CPU - i9-14900K
61.7 pt (86%)
Cinebench 2024 - Cinebench 2024 CPU Single Core
127.9 Points (89%)
min: 134     avg: 136.5     median: 137 (95%)     max: 138 Points
Cinebench 2024 - Cinebench 2024 CPU Multi Core
1982 Points (37%)
min: 2112     avg: 2189     median: 2146.5 (40%)     max: 2352 Points
Cinebench R23 - Cinebench R23 Multi Core
35892 Points (33%)
41193 Points (38%)
Cinebench R23 - Cinebench R23 Single Core
2153 Points (92%)
2351 Points (100%)
Cinebench R20 - Cinebench R20 CPU (Single Core)
832 Points (92%)
900 Points (100%)
Cinebench R20 - Cinebench R20 CPU (Multi Core)
13672 Points (33%)
15466 Points (38%)
Cinebench R15 - Cinebench R15 CPU Multi 64 Bit
5459 Points (34%)
6282 Points (40%)
Cinebench R15 - Cinebench R15 CPU Single 64 Bit
314 Points (95%)
332 Points (100%)
Cinebench R11.5 - Cinebench R11.5 CPU Multi 64 Bit
61.4 Points (80%)
min: 2.27     avg: 2.4     median: 2.4 (3%)     max: 2.57 Points
72.2 Points (94%)
Cinebench R11.5 - Cinebench R11.5 CPU Single 64 Bit
3.7 Points (92%)
min: 1.27     avg: 1.3     median: 1.3 (32%)     max: 1.41 Points
4 Points (100%)
Cinebench R10 - Cinebench R10 Rend. Single (32bit)
12027 Points (73%)
min: 3830     avg: 4353     median: 4392 (27%)     max: 4838 Points
12643 Points (76%)
Cinebench R10 - Cinebench R10 Rend. Multi (32bit)
91081 Points (66%)
min: 6854     avg: 7784     median: 7551 (5%)     max: 8946 Points
94801 Points (69%)
Cinebench R10 - Cinebench R10 Rend. Multi (64bit)
136062 Points (94%)
min: 8756     avg: 9646     median: 9681 (7%)     max: 10501 Points
144156 Points (100%)
Cinebench R10 - Cinebench R10 Rend. Single (64bit)
17458 Points (21%)
min: 5545     avg: 5813     median: 5646 (7%)     max: 6248 Points
18511 Points (23%)
wPrime 2.10 - wPrime 2.0 1024m *
109.8 s (1%)
761 s (9%)
74.5 s (1%)
wPrime 2.10 - wPrime 2.0 32m *
2.1 s (0%)
16.8 s (3%)
2.1 s (0%)
wPrime 1.55 - wPrime 1.55 1024m *
100%
1 i5-7Y54 +
747 s (3%)
wPrime 1.55 - wPrime 1.55 32m *
100%
1 i5-7Y54 +
22 s (12%)
WinRAR - WinRAR 4.0
12800 Points (20%)
min: 1708     avg: 1881     median: 1881 (3%)     max: 2054 Points
16108 Points (26%)
7-Zip 18.03 - 7-Zip 18.03 Multli Thread 4 runs
135648 MIPS (78%)
min: 145144     avg: 146282     median: 145207 (83%)     max: 149570 MIPS
7-Zip 18.03 - 7-Zip 18.03 Single Thread 4 runs
7351 MIPS (88%)
min: 7772     avg: 7893     median: 7932 (95%)     max: 7934 MIPS
X264 HD Benchmark 4.0 - x264 Pass 2
261 fps (91%)
13 fps (5%)
min: 75.9     avg: 181.2     median: 181.2 (63%)     max: 286.5 fps
X264 HD Benchmark 4.0 - x264 Pass 1
419 fps (97%)
73 fps (17%)
min: 257.5     avg: 345.5     median: 345.5 (80%)     max: 433.5 fps
HWBOT x265 Benchmark v2.2 - HWBOT x265 4k Preset
36.8 fps (65%)
min: 40.8     avg: 41.4     median: 41.1 (72%)     max: 42.8 fps
TrueCrypt - TrueCrypt Serpent
2.6 GB/s (0%)
0.1 GB/s (0%)
2.8 GB/s (0%)
TrueCrypt - TrueCrypt Twofish
4.6 GB/s (79%)
0.2 GB/s (4%)
5.8 GB/s (100%)
TrueCrypt - TrueCrypt AES
25.6 GB/s (67%)
1.4 GB/s (4%)
26.7 GB/s (70%)
Blender - Blender 3.3 Classroom CPU *
155 Seconds (2%)
min: 135     avg: 143     median: 144.5 (2%)     max: 147 Seconds
Blender - Blender 2.79 BMW27 CPU *
91 Seconds (1%)
min: 80     avg: 84.6     median: 85 (1%)     max: 87 Seconds
R Benchmark 2.5 - R Benchmark 2.5 *
0.4 sec (8%)
min: 0.3425     avg: 0.3     median: 0.3 (7%)     max: 0.3504 sec
3DMark 06 - CPU - 3DMark 06 - CPU
20665 Points (44%)
min: 2868     avg: 2905     median: 2904.5 (6%)     max: 2941 Points
min: 20532     avg: 22302     median: 22772.5 (48%)     max: 22928 Points
Super Pi mod 1.5 XS 1M - Super Pi mod 1.5 XS 1M *
6 s (1%)
5.5 s (1%)
Super Pi mod 1.5 XS 2M - Super Pi mod 1.5 XS 2M *
12.8 s (1%)
min: 26     avg: 27     median: 27 (1%)     max: 28 s
12 s (1%)
Super Pi Mod 1.5 XS 32M - Super Pi mod 1.5 XS 32M *
305.9 s (1%)
min: 669     avg: 681     median: 681 (3%)     max: 693 s
280.3 s (1%)
3DMark Vantage - 3DM Vant. Perf. CPU no Physx
100%
1 i5-7Y54 +
min: 7827     avg: 7866     median: 7866 (7%)     max: 7905 Points
1425%
1 i9-14900K +
min: 11403     avg: 96701     median: 112087 (98%)     max: 114209 Points
3DMark 11 - 3DM11 Performance Physics
32336 Points (87%)
min: 28587     avg: 31256     median: 31397 (85%)     max: 32853 Points
3DMark - 3DMark Ice Storm Physics
100%
1 i5-7Y54 +
min: 23771     avg: 26824     median: 25440 (21%)     max: 31261 Points
min: 89084     avg: 105234     median: 106096 (86%)     max: 111347 Points
3DMark - 3DMark Ice Storm Extreme Physics
100%
1 i5-7Y54 +
25640 Points (21%)
min: 88682     avg: 105311     median: 105851 (86%)     max: 110989 Points
3DMark - 3DMark Ice Storm Unlimited Physics
100%
1 i5-7Y54 +
min: 25981     avg: 32030     median: 33418 (28%)     max: 36691 Points
min: 90865     avg: 107009     median: 108898 (92%)     max: 110670 Points
3DMark - 3DMark Cloud Gate Physics
100%
1 i5-7Y54 +
min: 2118     avg: 2380     median: 2325 (6%)     max: 2665 Points
1270%
1 i9-14900K +
min: 27678     avg: 29391     median: 29524 (75%)     max: 30462 Points
3DMark - 3DMark Fire Strike Standard Physics
49142 Points (88%)
min: 3088     avg: 3550     median: 3624 (6%)     max: 3864 Points
min: 48193     avg: 53897     median: 54404 (97%)     max: 56087 Points
3DMark - 3DMark Time Spy CPU
21541 Points (91%)
min: 1112     avg: 1233     median: 1232.5 (5%)     max: 1353 Points
min: 19418     avg: 22177     median: 22451 (95%)     max: 23721 Points
Geekbench 6.2 - Geekbench 6.2 Single-Core
2902 Points (78%)
min: 3108     avg: 3214     median: 3243 (87%)     max: 3294 Points
Geekbench 6.2 - Geekbench 6.2 Multi-Core
19790 Points (78%)
min: 20435     avg: 21326     median: 21397 (84%)     max: 21790 Points
Geekbench 5.5 - Geekbench 5.1 - 5.4 64 Bit Single-Core
2121 Points (89%)
min: 2243     avg: 2347     median: 2369 (100%)     max: 2370 Points
Geekbench 5.5 - Geekbench 5.1 - 5.4 64 Bit Multi-Core
23159 Points (41%)
min: 24552     avg: 25148     median: 25199 (45%)     max: 25867 Points
Geekbench 5.0 - Geekbench 5.0 64 Bit Single-Core
2045 Points (9%)
min: 2177     avg: 2237     median: 2247 (10%)     max: 2280 Points
Geekbench 5.0 - Geekbench 5.0 64 Bit Multi-Core
22756 Points (72%)
min: 23151     avg: 24582     median: 24467 (77%)     max: 25496 Points
Geekbench 4.4 - Geekbench 4.1 - 4.4 64 Bit Single-Core
9304 Points (93%)
3745 Points (37%)
min: 9620     avg: 9873     median: 9872.5 (99%)     max: 10009 Points
Geekbench 4.4 - Geekbench 4.1 - 4.4 64 Bit Multi-Core
79501 Points (87%)
6921 Points (8%)
min: 82660     avg: 87853     median: 88108.5 (97%)     max: 91119 Points
Geekbench 4.0 - Geekbench 4.0 64 Bit Single-Core
100%
1 i5-7Y54 +
min: 3571     avg: 3652     median: 3652 (50%)     max: 3733 Points
Geekbench 4.0 - Geekbench 4.0 64 Bit Multi-Core
100%
1 i5-7Y54 +
min: 5578     avg: 6103     median: 6102.5 (15%)     max: 6627 Points
Geekbench 3 - Geekbench 3 32 Bit Multi-Core
100%
1 i5-7Y54 +
min: 5060     avg: 5619     median: 5619 (10%)     max: 6178 Points
Geekbench 3 - Geekbench 3 32 Bit Single-Core
100%
1 i5-7Y54 +
min: 2953     avg: 3057     median: 3056.5 (60%)     max: 3160 Points
Geekbench 3 - Geekbench 3 64 Bit Multi-Core
100%
1 i5-7Y54 +
5293 Points (8%)
Geekbench 3 - Geekbench 3 64 Bit Single-Core
100%
1 i5-7Y54 +
2953 Points (44%)
Mozilla Kraken 1.1 - Kraken 1.1 Total Score *
439 ms (1%)
min: 1132     avg: 1232     median: 1255 (1%)     max: 1309 ms
min: 413     avg: 415     median: 414 (0%)     max: 418 ms
Octane V2 - Octane V2 Total Score
100%
1 i5-7Y54 +
min: 25796     avg: 27945     median: 27627 (24%)     max: 30411 Points
WebXPRT 4 - WebXPRT 4 Score
314 Points (90%)
min: 332     avg: 334.7     median: 334 (96%)     max: 338 Points
WebXPRT 3 - WebXPRT 3 Score
339 Points (71%)
min: 371     avg: 388.3     median: 386 (80%)     max: 410 Points
CrossMark - CrossMark Overall
2288 Points (88%)
min: 2490     avg: 2566     median: 2584 (99%)     max: 2611 Points
Power Consumption - Prime95 Power Consumption - external Monitor *
400 Watt (69%)
537 Watt (93%)
Power Consumption - Cinebench R15 Multi Power Consumption - external Monitor *
428 Watt (78%)
548 Watt (100%)
Power Consumption - Idle Power Consumption - external Monitor *
104.8 Watt (69%)
min: 67.4     avg: 83.6     median: 77.9 (51%)     max: 151.2 Watt
Power Consumption - Cinebench R15 Multi Power Efficiency - external Monitor
12.8 Points per Watt (10%)

Average Benchmarks Intel Core i7-14700K → 100% n=26

Average Benchmarks Intel Core i5-7Y54 → 34% n=26

Average Benchmarks Intel Core i9-14900K → 105% n=26

- Range of benchmark values for this graphics card
- Average benchmark values for this graphics card
* Smaller numbers mean a higher performance
1 This benchmark is not used for the average calculation

v1.28
log 04. 20:16:30

#0 checking url part for id 16391 +0s ... 0s

#1 checking url part for id 8162 +0s ... 0s

#2 checking url part for id 15092 +0s ... 0s

#3 redirected to Ajax server, took 1720116990 +0s ... 0s

#4 did not recreate cache, as it is less than 5 days old! Created at Thu, 04 Jul 2024 05:15:21 +0200 +0s ... 0s

#5 composed specs +0.006s ... 0.006s

#6 did output specs +0s ... 0.006s

#7 getting avg benchmarks for device 16391 +0.004s ... 0.011s

#8 got single benchmarks 16391 +0.005s ... 0.015s

#9 getting avg benchmarks for device 8162 +0s ... 0.016s

#10 got single benchmarks 8162 +0.001s ... 0.017s

#11 getting avg benchmarks for device 15092 +0.004s ... 0.02s

#12 got single benchmarks 15092 +0.032s ... 0.053s

#13 got avg benchmarks for devices +0s ... 0.053s

#14 min, max, avg, median took s +0.079s ... 0.132s

#15 return log +0s ... 0.132s

Please share our article, every link counts!
> Expert Reviews and News on Laptops, Smartphones and Tech Innovations > Benchmarks / Tech > Processor Comparison - Head 2 Head
Redaktion, 2017-09- 8 (Update: 2023-07- 1)