Notebookcheck Logo

Intel Core i7-14700K vs Intel Core i5-7300U vs Intel Core i5-14600K

Intel Core i7-14700K

► remove from comparison Intel i7-14700K

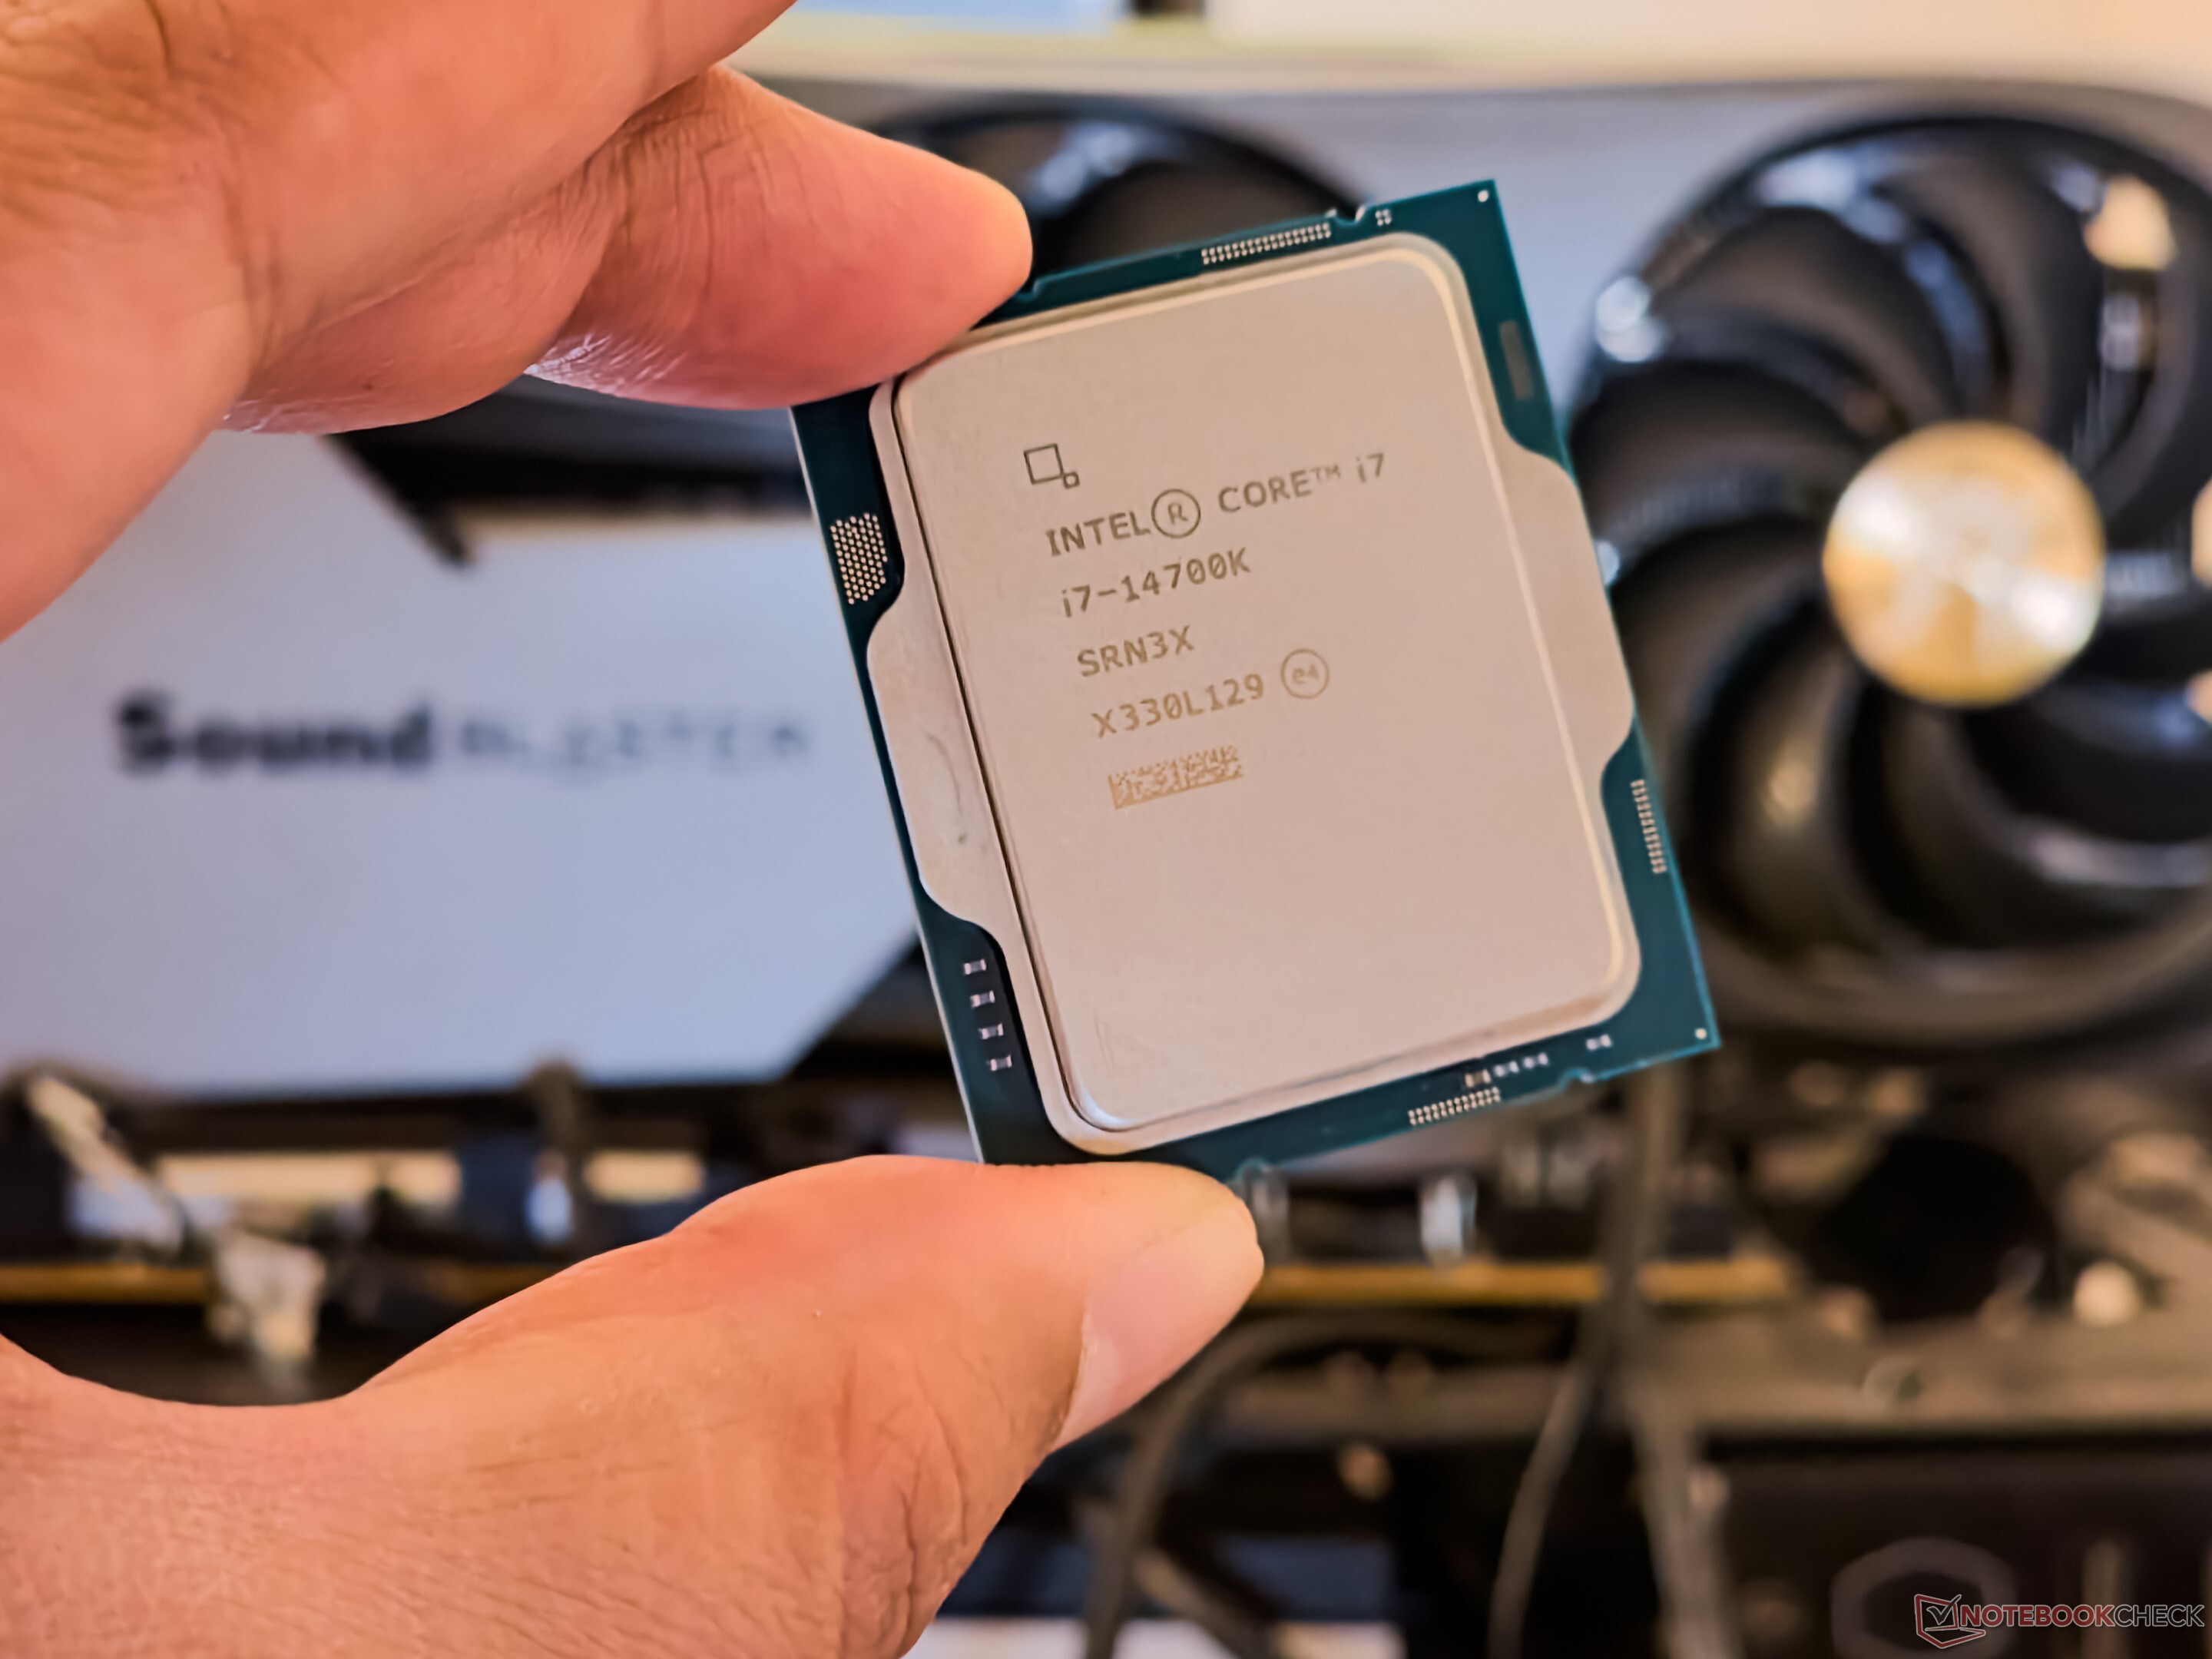
The Intel Core i5-14700K is a desktop processor based on the Raptor Lake architecture, which inherits the 13th generation of Intel Core processors with minor improvements. The processor offers a base clock of 2.5 GHz or 3.4 GHz and reaches up to 5.6 GHz in Turbo. The basic CPU structure remains unchanged. The Intel Core i5-14700K features 8 P-cores and 12 E-cores, allowing up to 28 threads to be processed in parallel. The Intel Core i5-14700K still offers a freely selectable multiplier, which makes overclocking much easier. It is also based on the LGA 1700 socket, which was already introduced with Alder Lake.

Performance

Compared to the Intel Core i5-13700K, the IPC of the new Core i5-14700K has only been increased slightly. This means that the difference in performance is only due to the higher number of efficiency cores (12 vs. 8) and higher clock rates.


Graphics unit

Like the Intel Core i5-13700K, the Intel Core i5-14700K also has an integrated graphics unit. The Intel Iris Xe architecture continues to serve as the basis. In terms of performance, however, nothing has changed with the Intel UHD Graphics 770.

Power consumption

The TDP of the Intel Core i5-14700K is 125 watts, with the option of consuming up to 253 watts in Turbo mode.

Intel Core i5-7300U

► remove from comparison Intel i5-7300U

The Intel Core i5-7300U is a fast dual-core processor for notebooks based on the Kaby Lake architecture and was announced in January 2017. It integrates 2 CPU cores with Hyper-Threading support clocked at 2.6 - 3.5 GHz (2 core Turbo also 3.5 GHz). Besides two cores, the processor is also equipped with the HD Graphics 620 GPU as well as a dual-channel memory controller (DDR3L-1600/DDR4-2400). It is manufactured in a 14nm process with FinFET transistors.

Architecture

Intel basically uses the same micro architecture compared to Skylake, so the per-MHz performance does not differ. The manufacturer only reworked the Speed Shift technology for faster dynamic adjustments of voltages and clocks, and the improved 14nm process allows much higher frequencies combined with better efficiency than before.

Performance

With 2.5 to 3.5 GHz, the Core i5-7300U clocks significantly higher than the old Core i5-7200U (2.5 - 3.1) and Core i5-6200U (2.3 - 2.8 GHz). Thanks to the fast Turbo frequency, the performance should be slightly below to the Core i7-7500U (2.7 - 3.5 GHz, but 4 MB L3 cache). Therfore, the performance is sufficient for demanding tasks.

Graphics

The integrated Intel HD Graphics 620 has 24 Execution Units (similar to previous HD Graphics 520) running at 300 - 1100 MHz. The performance depends a lot on the memory configuration; it should be comparable to a dedicated Nvidia GeForce 920M in combination with fast DDR4-2133 dual-channel memory.

Contrary to Skylake, Kaby Lake now supports hardware decoding for H.265/HEVC Main 10 with a 10-bit color depth as well as Google's VP9 codec. The dual-core Kaby Lake processors, which were announced in January, should also support HDCP 2.2.

Power Consumption

The chip is manufactured in an improved 14nm process with FinFET transistors, which improves the efficiency even further. Intel still specifies the TDP with 15 Watts, but it can also be reduced to 7.5 Watts by the notebook manufacturers (cTDP down). This will obviously affect the performance, because the Turbo Boost cannot be maintained for longer periods.

Intel Core i5-14600K

► remove from comparison Intel i5-14600K

The Intel Core i5-14600K is a modern desktop processor based on the Raptor Lake architecture, which inherits the 13th generation of Intel Core processors with minor improvements. The processor offers a base clock of 3.5 GHz and reaches up to 5.3 GHz in Turbo. The basic CPU structure remains unchanged. This means that the Intel Core i5-14600K also has 6 P-cores and 8 E-cores, which means that up to 20 threads can be processed in parallel. The Intel Core i5-14600K still offers a freely selectable multiplier, which makes overclocking much easier. The LGA 1700 socket, which was already introduced with Alder-Lake, is also used as the basis.

Performance

Compared to the Intel Core i5-13600K , the IPC of the new Core i5-14600K has only been increased slightly. This means that the difference in performance is also only slight. The hybrid architecture relies on the Intel Thread Director, which is responsible for the correct allocation of tasks. As a further innovation, the manufacturer is increasingly relying on AI, which is also used for overclocking. With one click in the Intel Extreme Utility, the tool checks the entire system and makes the necessary settings.

Graphics unit

Like the Intel Core i5-13600K, the Intel Core i5-14600K also has an integrated graphics unit. The Intel Iris Xe architecture continues to serve as the basis. In terms of performance, however, nothing has changed with the Intel UHD Graphics 770.

Power consumption

The TDP of the Intel Core i5-14600K is 125 watts, with the option of consuming up to 181 watts in Turbo mode. If all limits are removed, the energy requirement rises to up to 240 watts. For cooling, we recommend a powerful air cooler or a 240 AiO.

ModelIntel Core i7-14700KIntel Core i5-7300UIntel Core i5-14600K
SeriesIntel Raptor Lake-RIntel Kaby LakeIntel Raptor Lake-R
CodenameRaptor LakeKaby LakeRaptor Lake
Series: Raptor Lake-R Raptor Lake
Intel Core i9-14900K3.2 - 6 GHz24 / 32 cores36 MB L3
Intel Core i7-14700K « 2.5 - 5.6 GHz20 / 28 cores33 MB L3
Intel Core i5-14600K3.5 - 5.3 GHz14 / 20 cores24 MB L3
Intel Core i7-7700K4.2 - 4.5 GHz4 / 8 cores8 MB L3
Intel Core i7-77003.6 - 4.2 GHz4 / 8 cores8 MB L3
Intel Xeon E3-1535M v63.1 - 4.2 GHz4 / 8 cores8 MB L3
Intel Core i7-7920HQ3.1 - 4.1 GHz4 / 8 cores8 MB L3
Intel Core i7-7700T2.9 - 3.8 GHz4 / 8 cores8 MB L3
Intel Core i5-7600K3.8 - 4.2 GHz4 / 4 cores8 MB L3
Intel Xeon E3-1505M v63 - 4 GHz4 / 8 cores8 MB L3
Intel Core i7-7820HQ2.9 - 3.9 GHz4 / 8 cores8 MB L3
Intel Core i7-7820HK2.9 - 3.9 GHz4 / 8 cores8 MB L3
Intel Core i7-7700HQ2.8 - 3.8 GHz4 / 8 cores6 MB L3
Intel Core i5-75003.4 - 3.8 GHz4 / 4 cores6 MB L3
Intel Core i5-7440HQ2.8 - 3.8 GHz4 / 4 cores6 MB L3
Intel Core i7-7567U3.5 - 4 GHz2 / 4 cores4 MB L3
Intel Core i7-7660U2.5 - 4 GHz2 / 4 cores4 MB L3
Intel Core i7-7600U2.8 - 3.9 GHz2 / 4 cores4 MB L3
Intel Core i5-7300HQ2.5 - 3.5 GHz4 / 4 cores6 MB L3
Intel Core i5-7500T2.7 - 3.3 GHz4 / 4 cores6 MB L3
Intel Core i5-7287U3.3 - 3.7 GHz2 / 4 cores4 MB L3
Intel Core i7-7560U2.4 - 3.8 GHz2 / 4 cores4 MB L3
Intel Core i5-7267U3.1 - 3.5 GHz2 / 4 cores4 MB L3
Intel Core i5-7360U2.3 - 3.6 GHz2 / 4 cores4 MB L3
Intel Core i7-7500U2.7 - 3.5 GHz2 / 4 cores4 MB L3
Intel Core i5-7300U « 2.6 - 3.5 GHz2 / 4 cores3 MB L3
Intel Core i5-7260U2.2 - 3.4 GHz2 / 4 cores4 MB L3
Intel Core i5-7200U2.5 - 3.1 GHz2 / 4 cores3 MB L3
Intel Core i3-7100H3 GHz2 / 4 cores3 MB L3
Intel Core i3-7167U2.8 GHz2 / 4 cores3 MB L3
Intel Core i7-7Y751.3 - 3.6 GHz2 / 4 cores4 MB L3
Intel Core i5-7Y571.2 - 3.3 GHz2 / 4 cores4 MB L3
Intel Core i5-7Y541.2 - 3.2 GHz2 / 4 cores4 MB L3
Intel Core i3-7100U2.4 GHz2 / 4 cores3 MB L3
Intel Core m3-7Y321 - 3 GHz2 / 4 cores4 MB L3
Intel Pentium Gold 4415U2.3 GHz2 / 4 cores2 MB L3
Intel Core m3-7Y301 - 2.6 GHz2 / 4 cores4 MB L3
Intel Celeron 3965U2.2 GHz2 / 2 cores2 MB L3
Intel Core i3-7020U2.3 GHz2 / 4 cores3 MB L3
Intel Celeron 3867U1.8 GHz2 / 2 cores2 MB L3
Intel Celeron 3865U1.8 GHz2 / 2 cores2 MB L3
Intel Pentium Gold 4425Y1.7 GHz2 / 4 cores2 MB L3
Intel Pentium Gold 4415Y1.6 GHz2 / 4 cores2 MB L3
Intel Pentium Gold 4410Y1.5 GHz2 / 4 cores2 MB L3
Intel Celeron 3965Y1.5 GHz2 / 2 cores2 MB L3
Intel Core i9-14900K3.2 - 6 GHz24 / 32 cores36 MB L3
Intel Core i7-14700K2.5 - 5.6 GHz20 / 28 cores33 MB L3
Intel Core i5-14600K « 3.5 - 5.3 GHz14 / 20 cores24 MB L3
Clock2500 - 5600 MHz2600 - 3500 MHz3500 - 5300 MHz
L2 Cache28 MB512 KB20 MB
L3 Cache33 MB3 MB24 MB
Cores / Threads20 / 28
8 x 5.6 GHz Intel Raptor Cove P-Core
12 x 3.4 GHz Intel Gracemont E-Core
2 / 414 / 20
6 x 5.3 GHz Intel Raptor Cove P-Core
8 x 3.5 GHz Intel Gracemont E-Core
TDP125 Watt15 Watt125 Watt
Technology10 nm14 nm10 nm
max. Temp.100 °C100 °C100 °C
SocketLGA 1700BGA1356LGA 1700
FeaturesIntel UHD Graphics 770, DDR5 5600 MT/s, DDR4 3200 MT/sDual-Channel DDR4 Memory Controller, HyperThreading, AVX, AVX2, Quick Sync, Virtualization, AES-NIIntel UHD Graphics 770, DDR5 5600 MT/s, DDR4 3200 MT/s
iGPUIntel UHD Graphics 770 (300 - 1600 MHz)Intel HD Graphics 620 (300 - 1100 MHz)Intel UHD Graphics 770 (300 - 1550 MHz)
Architecturex86x86x86
$319 U.S.$281 U.S.$319 U.S.
Announced
Manufacturerark.intel.comwww.intel.com
L1 Cache128 KB

Benchmarks

Performance Rating - CB R15 + R20 + 7-Zip + X265 + Blender + 3DM11 CPU - i7-14700K
57.8 pt (80%)
Performance Rating - CB R15 + R20 + 7-Zip + X265 + Blender + 3DM11 CPU - i5-14600K
51 pt (71%)
Cinebench 2024 - Cinebench 2024 CPU Single Core
127.9 Points (89%)
122 Points (85%)
Cinebench 2024 - Cinebench 2024 CPU Multi Core
1982 Points (37%)
1392 Points (26%)
Cinebench R23 - Cinebench R23 Multi Core
35892 Points (33%)
24491 Points (23%)
Cinebench R23 - Cinebench R23 Single Core
2153 Points (92%)
2064 Points (88%)
Cinebench R20 - Cinebench R20 CPU (Single Core)
832 Points (92%)
790 Points (88%)
Cinebench R20 - Cinebench R20 CPU (Multi Core)
13672 Points (33%)
9371 Points (23%)
Cinebench R15 - Cinebench R15 CPU Multi 64 Bit
5459 Points (34%)
3640 Points (23%)
Cinebench R15 - Cinebench R15 CPU Single 64 Bit
314 Points (95%)
297 Points (89%)
Cinebench R11.5 - Cinebench R11.5 CPU Multi 64 Bit
61.4 Points (80%)
min: 3.57     avg: 3.9     median: 3.9 (5%)     max: 4.13 Points
41 Points (53%)
Cinebench R11.5 - Cinebench R11.5 CPU Single 64 Bit
3.7 Points (92%)
min: 1.59     avg: 1.6     median: 1.6 (40%)     max: 1.64 Points
3.6 Points (89%)
Cinebench R10 - Cinebench R10 Rend. Single (32bit)
12027 Points (73%)
min: 5524     avg: 5529     median: 5529 (33%)     max: 5534 Points
11396 Points (69%)
Cinebench R10 - Cinebench R10 Rend. Multi (32bit)
91081 Points (66%)
min: 12072     avg: 12298     median: 12298 (9%)     max: 12524 Points
75358 Points (55%)
Cinebench R10 - Cinebench R10 Rend. Multi (64bit)
136062 Points (94%)
14213 Points (10%)
115171 Points (80%)
Cinebench R10 - Cinebench R10 Rend. Single (64bit)
17458 Points (21%)
7185 Points (9%)
16643 Points (20%)
wPrime 2.10 - wPrime 2.0 1024m *
109.8 s (1%)
min: 446.9     avg: 467.8     median: 467.8 (6%)     max: 488.6 s
158.8 s (2%)
wPrime 2.10 - wPrime 2.0 32m *
2.1 s (0%)
min: 13.8     avg: 14.6     median: 14.6 (3%)     max: 15.38 s
2.4 s (0%)
WinRAR - WinRAR 4.0
12800 Points (20%)
2696 Points (4%)
11491 Points (18%)
7-Zip 18.03 - 7-Zip 18.03 Multli Thread 4 runs
135648 MIPS (78%)
93235 MIPS (54%)
7-Zip 18.03 - 7-Zip 18.03 Single Thread 4 runs
7351 MIPS (88%)
6910 MIPS (83%)
X264 HD Benchmark 4.0 - x264 Pass 2
261 fps (91%)
min: 24     avg: 24     median: 24 (8%)     max: 24.08 fps
209 fps (73%)
X264 HD Benchmark 4.0 - x264 Pass 1
419 fps (97%)
min: 128     avg: 128.2     median: 128.2 (30%)     max: 128.3 fps
411 fps (95%)
HWBOT x265 Benchmark v2.2 - HWBOT x265 4k Preset
36.8 fps (65%)
28.6 fps (50%)
TrueCrypt - TrueCrypt Serpent
2.6 GB/s (0%)
0.2 GB/s (0%)
1.8 GB/s (0%)
TrueCrypt - TrueCrypt Twofish
4.6 GB/s (79%)
0.4 GB/s (6%)
3.4 GB/s (59%)
TrueCrypt - TrueCrypt AES
25.6 GB/s (67%)
2.1 GB/s (5%)
19.5 GB/s (51%)
Blender - Blender 3.3 Classroom CPU *
155 Seconds (2%)
223 Seconds (3%)
Blender - Blender 2.79 BMW27 CPU *
91 Seconds (1%)
134 Seconds (1%)
R Benchmark 2.5 - R Benchmark 2.5 *
0.4 sec (8%)
0.4 sec (9%)
3DMark 06 - CPU - 3DMark 06 - CPU
20665 Points (44%)
min: 4126     avg: 4492     median: 4491.5 (10%)     max: 4857 Points
18096 Points (39%)
Super Pi mod 1.5 XS 1M - Super Pi mod 1.5 XS 1M *
6 s (1%)
min: 11.03     avg: 12     median: 12 (3%)     max: 13 s
6.2 s (1%)
Super Pi mod 1.5 XS 2M - Super Pi mod 1.5 XS 2M *
12.8 s (1%)
min: 25     avg: 25     median: 25 (1%)     max: 25.03 s
13.7 s (1%)
Super Pi Mod 1.5 XS 32M - Super Pi mod 1.5 XS 32M *
305.9 s (1%)
min: 560     avg: 564     median: 564 (3%)     max: 568 s
316.7 s (1%)
3DMark Vantage - 3DM Vant. Perf. CPU no Physx
10915 Points (10%)
96263 Points (84%)
3DMark 11 - 3DM11 Performance Physics
32336 Points (87%)
min: 3873     avg: 4393     median: 4364.5 (12%)     max: 4823 Points
31641 Points (86%)
3DMark - 3DMark Ice Storm Physics
min: 40272     avg: 43335     median: 44182 (36%)     max: 45552 Points
123069 Points (100%)
3DMark - 3DMark Ice Storm Extreme Physics
min: 36277     avg: 40889     median: 40888.5 (33%)     max: 45500 Points
123244 Points (100%)
3DMark - 3DMark Ice Storm Unlimited Physics
min: 47197     avg: 47678     median: 47678 (40%)     max: 48159 Points
109954 Points (93%)
3DMark - 3DMark Cloud Gate Physics
min: 2870     avg: 3520     median: 3396 (9%)     max: 4053 Points
27407 Points (69%)
3DMark - 3DMark Fire Strike Standard Physics
49142 Points (88%)
min: 4062     avg: 5086     median: 4947 (9%)     max: 5757 Points
40164 Points (72%)
3DMark - 3DMark Time Spy CPU
21541 Points (91%)
1657 Points (7%)
18768 Points (79%)
Geekbench 6.2 - Geekbench 6.2 Single-Core
2902 Points (78%)
2879 Points (77%)
Geekbench 6.2 - Geekbench 6.2 Multi-Core
19790 Points (78%)
17409 Points (69%)
Geekbench 5.5 - Geekbench 5.1 - 5.4 64 Bit Single-Core
2121 Points (89%)
2017 Points (85%)
Geekbench 5.5 - Geekbench 5.1 - 5.4 64 Bit Multi-Core
23159 Points (41%)
17516 Points (31%)
Geekbench 5.0 - Geekbench 5.0 64 Bit Single-Core
2045 Points (9%)
2004 Points (9%)
Geekbench 5.0 - Geekbench 5.0 64 Bit Multi-Core
22756 Points (72%)
17374 Points (55%)
Geekbench 4.4 - Geekbench 4.1 - 4.4 64 Bit Single-Core
9304 Points (93%)
4219 Points (42%)
8904 Points (89%)
Geekbench 4.4 - Geekbench 4.1 - 4.4 64 Bit Multi-Core
79501 Points (87%)
8266 Points (9%)
64035 Points (70%)
Geekbench 4.0 - Geekbench 4.0 64 Bit Single-Core
4096 Points (56%)
Geekbench 4.0 - Geekbench 4.0 64 Bit Multi-Core
7915 Points (19%)
Geekbench 3 - Geekbench 3 32 Bit Multi-Core
7603 Points (13%)
Geekbench 3 - Geekbench 3 32 Bit Single-Core
3487 Points (68%)
Mozilla Kraken 1.1 - Kraken 1.1 Total Score *
439 ms (1%)
min: 1044     avg: 1119     median: 1075.5 (1%)     max: 1279 ms
450 ms (1%)
Octane V2 - Octane V2 Total Score
min: 32474     avg: 34055     median: 33734 (30%)     max: 36276 Points
WebXPRT 4 - WebXPRT 4 Score
314 Points (90%)
301 Points (86%)
WebXPRT 3 - WebXPRT 3 Score
339 Points (71%)
354 Points (74%)
CrossMark - CrossMark Overall
2288 Points (88%)
2310 Points (88%)
Power Consumption - Prime95 Power Consumption - external Monitor *
400 Watt (69%)
370 Watt (64%)
Power Consumption - Cinebench R15 Multi Power Consumption - external Monitor *
428 Watt (78%)
329 Watt (60%)
Power Consumption - Idle Power Consumption - external Monitor *
104.8 Watt (69%)
110.4 Watt (73%)
Power Consumption - Cinebench R15 Multi Power Efficiency - external Monitor
12.8 Points per Watt (10%)
11.1 Points per Watt (8%)

Average Benchmarks Intel Core i7-14700K → 100% n=26

Average Benchmarks Intel Core i5-7300U → 38% n=26

Average Benchmarks Intel Core i5-14600K → 88% n=26

- Range of benchmark values for this graphics card
- Average benchmark values for this graphics card
* Smaller numbers mean a higher performance
1 This benchmark is not used for the average calculation

v1.28
log 04. 18:44:45

#0 checking url part for id 16391 +0s ... 0s

#1 checking url part for id 8411 +0s ... 0s

#2 checking url part for id 15093 +0s ... 0s

#3 redirected to Ajax server, took 1720111485 +0s ... 0s

#4 did not recreate cache, as it is less than 5 days old! Created at Thu, 04 Jul 2024 05:15:21 +0200 +0s ... 0s

#5 composed specs +0.005s ... 0.005s

#6 did output specs +0s ... 0.005s

#7 getting avg benchmarks for device 16391 +0.001s ... 0.007s

#8 got single benchmarks 16391 +0s ... 0.007s

#9 getting avg benchmarks for device 8411 +0s ... 0.007s

#10 got single benchmarks 8411 +0.001s ... 0.009s

#11 getting avg benchmarks for device 15093 +0.004s ... 0.012s

#12 got single benchmarks 15093 +0.005s ... 0.017s

#13 got avg benchmarks for devices +0s ... 0.017s

#14 min, max, avg, median took s +0.049s ... 0.066s

#15 return log +0s ... 0.066s

Please share our article, every link counts!
> Expert Reviews and News on Laptops, Smartphones and Tech Innovations > Benchmarks / Tech > Processor Comparison - Head 2 Head
Redaktion, 2017-09- 8 (Update: 2023-07- 1)