Notebookcheck Logo

Intel Core i7-14700K vs Intel Core i5-7267U

Intel Core i7-14700K

► remove from comparison Intel i7-14700K

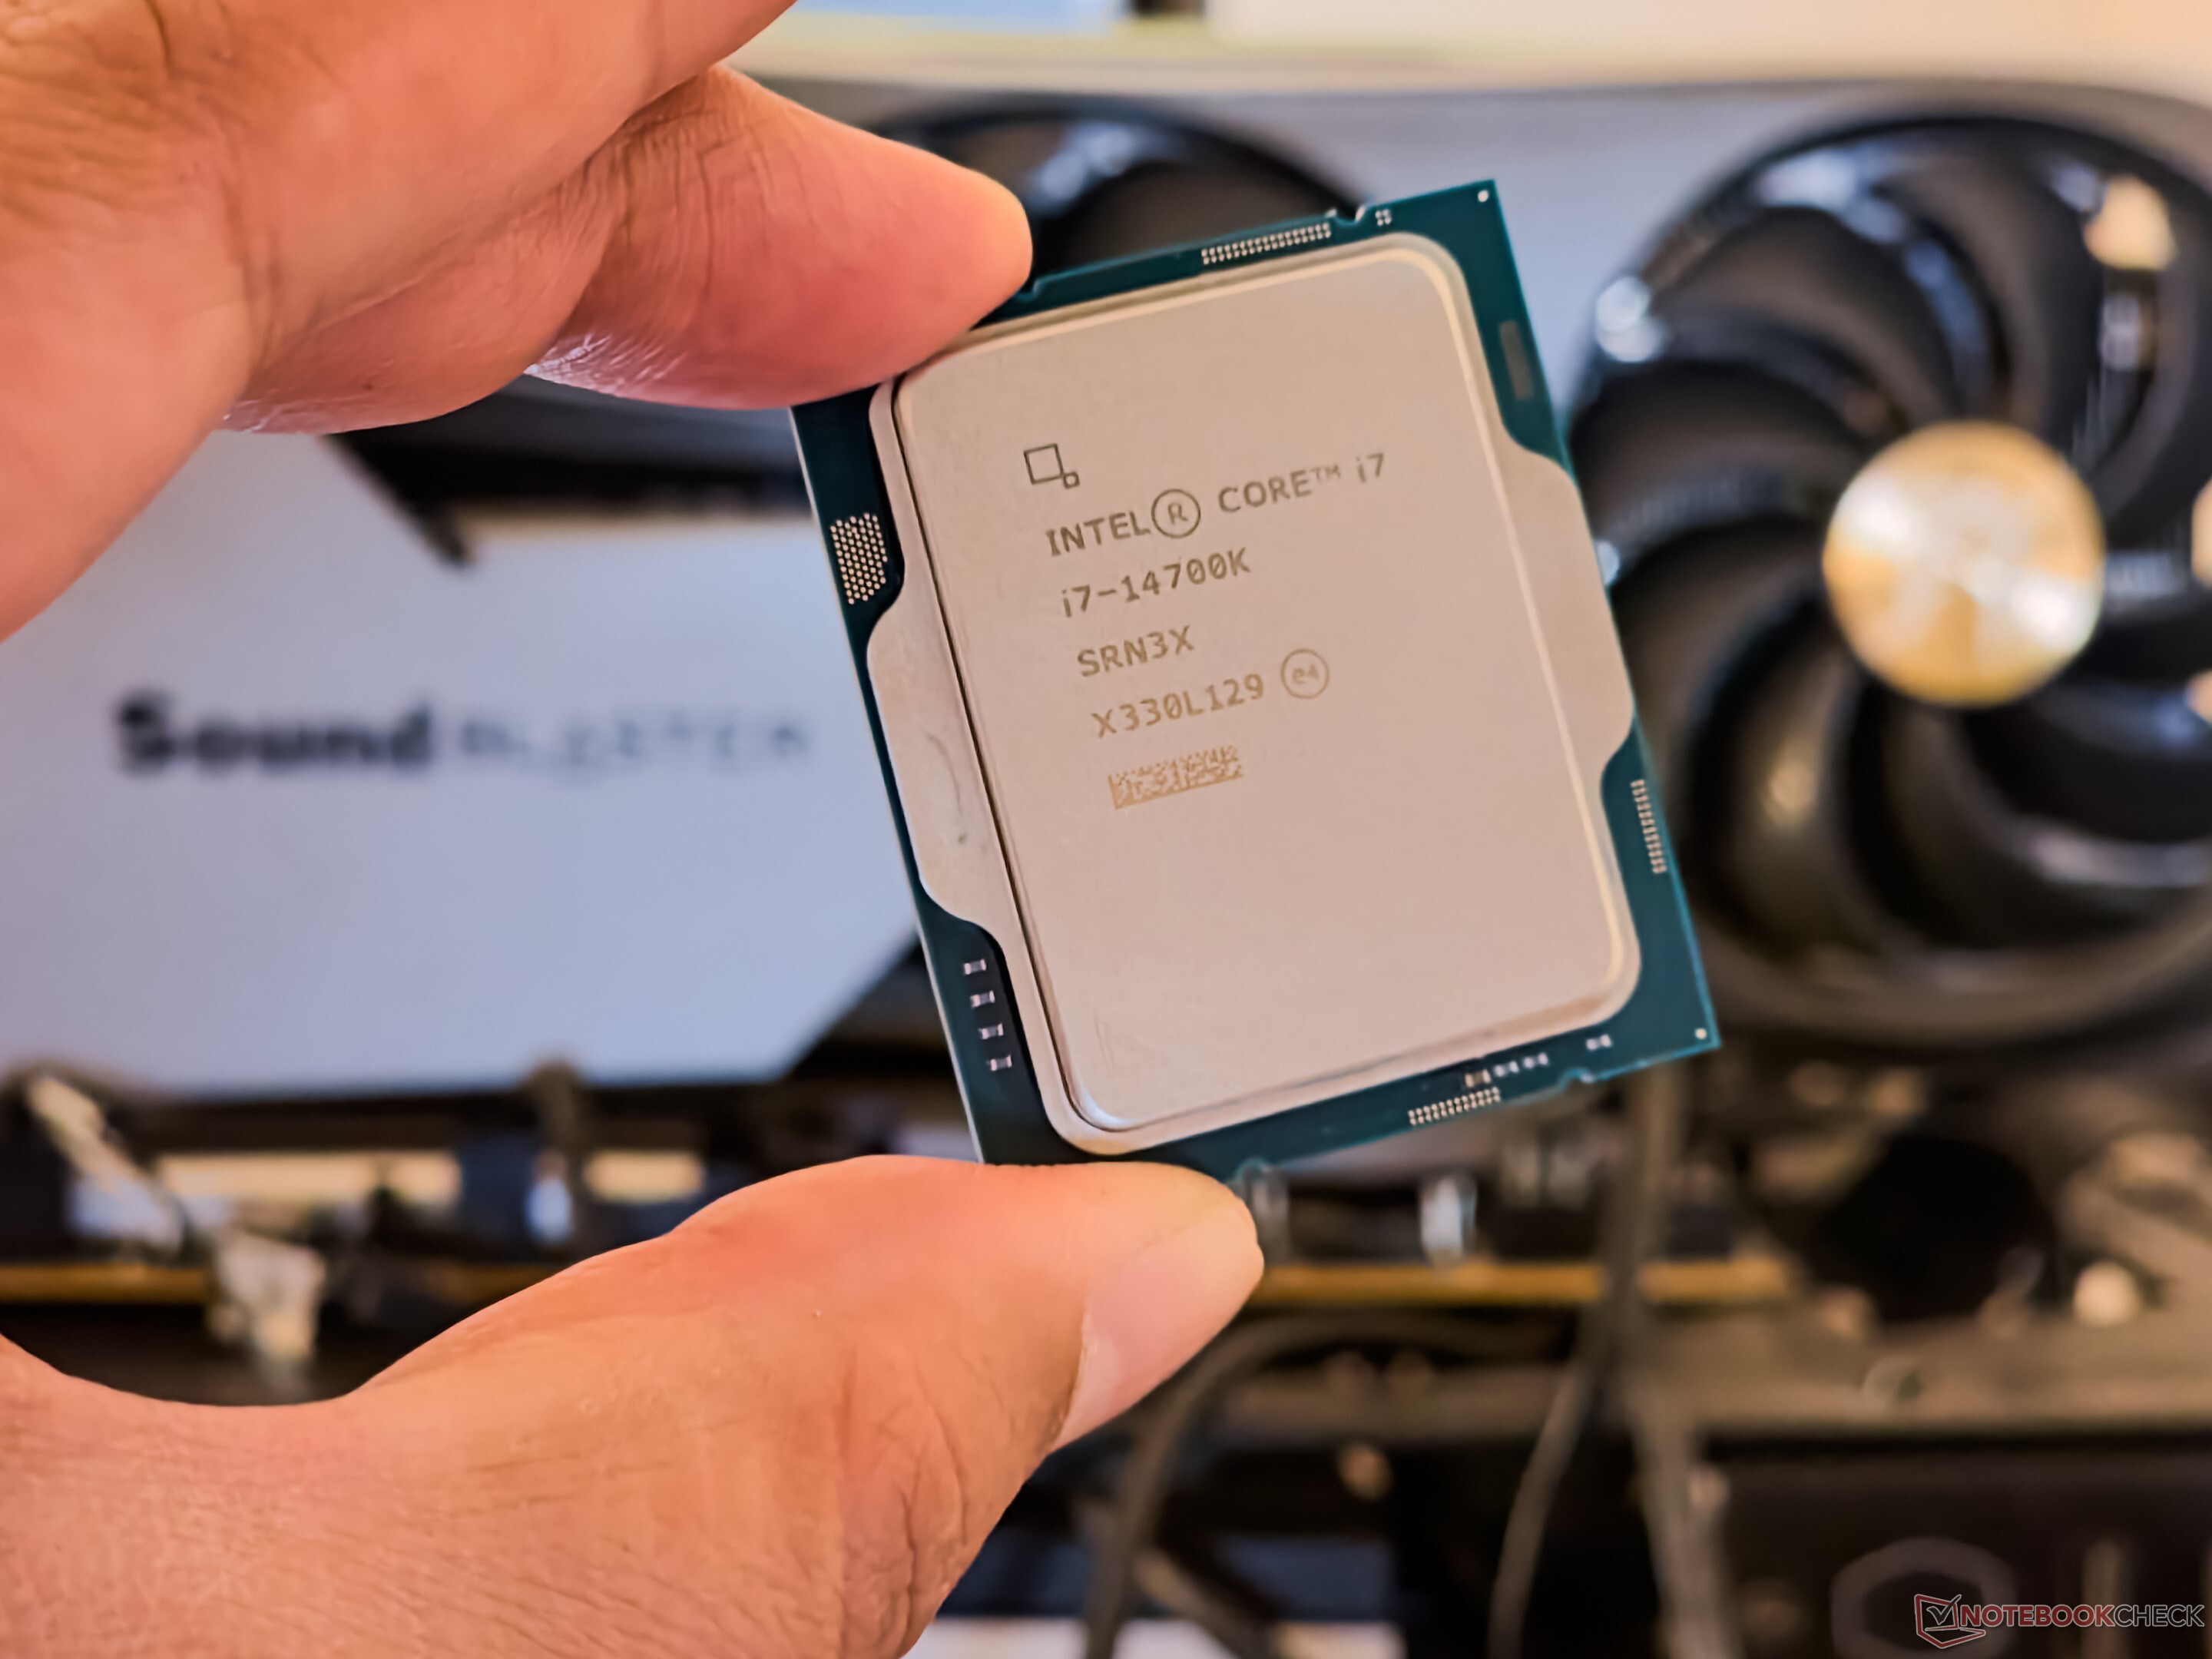
The Intel Core i5-14700K is a desktop processor based on the Raptor Lake architecture, which inherits the 13th generation of Intel Core processors with minor improvements. The processor offers a base clock of 2.5 GHz or 3.4 GHz and reaches up to 5.6 GHz in Turbo. The basic CPU structure remains unchanged. The Intel Core i5-14700K features 8 P-cores and 12 E-cores, allowing up to 28 threads to be processed in parallel. The Intel Core i5-14700K still offers a freely selectable multiplier, which makes overclocking much easier. It is also based on the LGA 1700 socket, which was already introduced with Alder Lake.

Performance

Compared to the Intel Core i5-13700K, the IPC of the new Core i5-14700K has only been increased slightly. This means that the difference in performance is only due to the higher number of efficiency cores (12 vs. 8) and higher clock rates.


Graphics unit

Like the Intel Core i5-13700K, the Intel Core i5-14700K also has an integrated graphics unit. The Intel Iris Xe architecture continues to serve as the basis. In terms of performance, however, nothing has changed with the Intel UHD Graphics 770.

Power consumption

The TDP of the Intel Core i5-14700K is 125 watts, with the option of consuming up to 253 watts in Turbo mode.

Intel Core i5-7267U

► remove from comparison

The Intel Core i5-7267U is a fast dual-core SoC for notebooks based on the Kaby Lake architecture and was announced in January 2017. The CPU has two processor cores clocked at 3.1-3.5 GHz (two cores also up to 3.5 GHz). The processor can execute up to four threads simultaneously thanks to Hyper Threading. It is also equipped with an Intel Iris Plus Graphics 650 GPU with 64 MB eDRAM, a dual-channel memory controller (DDR4) as well as VP9 and H.265 video decoding as well as encoding. The chip is still manufactured in a 14nm process with FinFET transistors.

Architecture

Intel basically uses the same micro architecture compared to Skylake, so the per-MHz performance does not differ. The manufacturer only reworked the Speed Shift technology for faster dynamic adjustments of voltages and clocks, and the improved 14nm process allows much higher frequencies combined with better efficiency than before.

Performance

The performance of the 28-Watt CPU should be on par with the Core i7-7500U (2.7-3.5 GHz, no eDRAM, 15 Watts), but it should be a bit slower on practice due to the missing level 4 eDRAM and the lower TDP. This means the i5 is still one of the faster dual-core processors and should be sufficient for most scenarios. Some games might still require a real quad-core processor and therefore nit run perfectly on the dual-core processor, despite Hyper Threading.

Graphics

The integrated Intel Iris Plus 650 Graphics is the GT3e model of the Kaby Lake GPU (Intel Gen. 9.5). It has 48 Execution Units running at 300-1050 MHz and the performance is comparable to a GeForce 920MX thanks to fast eDRAM cache. However, there aren't any significant improvements compared to the old Iris Pro 550, so modern games can often not be played smoothly or only at the lowest or medium settings, respectively.

Contrary to Skylake, Kaby lake now also supports H.265/HEVC Main 10 with a 10-bit color depth as well as Google's VP9 codec. The dual-core Kaby Lake processors announced in January should also support HDCP 2.2.

Power Consumption

The chip is manufactured in an improved 14nm process with FinFET transistors, which improves the efficiency even further. Intel specifies the TDP with 28 Watts, which can be reduced to 23 Watts (cTDP Down) depending on the usage scenario. The TDP is pretty high compared to the common 15-Watt TDP for dual-core processors, but allows a better utilization of CPU and GPU Turbo.

ModelIntel Core i7-14700KIntel Core i5-7267U
SeriesIntel Raptor Lake-RIntel Kaby Lake
CodenameRaptor LakeKaby Lake
Series: Kaby Lake Kaby Lake
Intel Core i9-14900K compare3.2 - 6 GHz24 / 32 cores36 MB L3
Intel Core i7-14700K « 2.5 - 5.6 GHz20 / 28 cores33 MB L3
Intel Core i5-14600K compare3.5 - 5.3 GHz14 / 20 cores24 MB L3
Intel Core i7-7700K compare4.2 - 4.5 GHz4 / 8 cores8 MB L3
Intel Core i7-7700 compare3.6 - 4.2 GHz4 / 8 cores8 MB L3
Intel Xeon E3-1535M v6 compare3.1 - 4.2 GHz4 / 8 cores8 MB L3
Intel Core i7-7920HQ compare3.1 - 4.1 GHz4 / 8 cores8 MB L3
Intel Core i7-7700T compare2.9 - 3.8 GHz4 / 8 cores8 MB L3
Intel Core i5-7600K compare3.8 - 4.2 GHz4 / 4 cores8 MB L3
Intel Xeon E3-1505M v6 compare3 - 4 GHz4 / 8 cores8 MB L3
Intel Core i7-7820HQ compare2.9 - 3.9 GHz4 / 8 cores8 MB L3
Intel Core i7-7820HK compare2.9 - 3.9 GHz4 / 8 cores8 MB L3
Intel Core i7-7700HQ compare2.8 - 3.8 GHz4 / 8 cores6 MB L3
Intel Core i5-7500 compare3.4 - 3.8 GHz4 / 4 cores6 MB L3
Intel Core i5-7440HQ compare2.8 - 3.8 GHz4 / 4 cores6 MB L3
Intel Core i7-7567U compare3.5 - 4 GHz2 / 4 cores4 MB L3
Intel Core i7-7660U compare2.5 - 4 GHz2 / 4 cores4 MB L3
Intel Core i7-7600U compare2.8 - 3.9 GHz2 / 4 cores4 MB L3
Intel Core i5-7300HQ compare2.5 - 3.5 GHz4 / 4 cores6 MB L3
Intel Core i5-7500T compare2.7 - 3.3 GHz4 / 4 cores6 MB L3
Intel Core i5-7287U compare3.3 - 3.7 GHz2 / 4 cores4 MB L3
Intel Core i7-7560U compare2.4 - 3.8 GHz2 / 4 cores4 MB L3
Intel Core i5-7267U « 3.1 - 3.5 GHz2 / 4 cores4 MB L3
Intel Core i5-7360U compare2.3 - 3.6 GHz2 / 4 cores4 MB L3
Intel Core i7-7500U compare2.7 - 3.5 GHz2 / 4 cores4 MB L3
Intel Core i5-7300U compare2.6 - 3.5 GHz2 / 4 cores3 MB L3
Intel Core i5-7260U compare2.2 - 3.4 GHz2 / 4 cores4 MB L3
Intel Core i5-7200U compare2.5 - 3.1 GHz2 / 4 cores3 MB L3
Intel Core i3-7100H compare3 GHz2 / 4 cores3 MB L3
Intel Core i3-7167U compare2.8 GHz2 / 4 cores3 MB L3
Intel Core i7-7Y75 compare1.3 - 3.6 GHz2 / 4 cores4 MB L3
Intel Core i5-7Y57 compare1.2 - 3.3 GHz2 / 4 cores4 MB L3
Intel Core i5-7Y54 compare1.2 - 3.2 GHz2 / 4 cores4 MB L3
Intel Core i3-7100U compare2.4 GHz2 / 4 cores3 MB L3
Intel Core m3-7Y32 compare1 - 3 GHz2 / 4 cores4 MB L3
Intel Pentium Gold 4415U compare2.3 GHz2 / 4 cores2 MB L3
Intel Core m3-7Y30 compare1 - 2.6 GHz2 / 4 cores4 MB L3
Intel Celeron 3965U compare2.2 GHz2 / 2 cores2 MB L3
Intel Core i3-7020U compare2.3 GHz2 / 4 cores3 MB L3
Intel Celeron 3867U compare1.8 GHz2 / 2 cores2 MB L3
Intel Celeron 3865U compare1.8 GHz2 / 2 cores2 MB L3
Intel Pentium Gold 4425Y compare1.7 GHz2 / 4 cores2 MB L3
Intel Pentium Gold 4415Y compare1.6 GHz2 / 4 cores2 MB L3
Intel Pentium Gold 4410Y compare1.5 GHz2 / 4 cores2 MB L3
Intel Celeron 3965Y compare1.5 GHz2 / 2 cores2 MB L3
Clock2500 - 5600 MHz3100 - 3500 MHz
L2 Cache28 MB512 KB
L3 Cache33 MB4 MB
Cores / Threads20 / 28
8 x 5.6 GHz Intel Raptor Cove P-Core
12 x 3.4 GHz Intel Gracemont E-Core
2 / 4
TDP125 Watt28 Watt
Technology10 nm14 nm
max. Temp.100 °C100 °C
SocketLGA 1700BGA1356
FeaturesIntel UHD Graphics 770, DDR5 5600 MT/s, DDR4 3200 MT/sDual-Channel DDR4 Memory Controller, HyperThreading, AVX, AVX2, Quick Sync, Virtualization, AES-NI
iGPUIntel UHD Graphics 770 (300 - 1600 MHz)Intel Iris Plus Graphics 650 (300 - 1050 MHz)
Architecturex86x86
$319 U.S.$304 U.S.
Announced
Manufacturerark.intel.comark.intel.com
L1 Cache128 KB

Benchmarks

Performance Rating - CB R15 + R20 + 7-Zip + X265 + Blender + 3DM11 CPU - i7-14700K
57.8 pt (80%)
Cinebench 2024 - Cinebench 2024 CPU Single Core
127.9 Points (89%)
Cinebench 2024 - Cinebench 2024 CPU Multi Core
1982 Points (37%)
Cinebench R23 - Cinebench R23 Multi Core
35892 Points (33%)
Cinebench R23 - Cinebench R23 Single Core
2153 Points (92%)
Cinebench R20 - Cinebench R20 CPU (Single Core)
832 Points (92%)
Cinebench R20 - Cinebench R20 CPU (Multi Core)
13672 Points (33%)
Cinebench R15 - Cinebench R15 CPU Multi 64 Bit
5459 Points (34%)
Cinebench R15 - Cinebench R15 CPU Single 64 Bit
314 Points (95%)
141 Points (42%)
Cinebench R11.5 - Cinebench R11.5 CPU Multi 64 Bit
61.4 Points (80%)
Cinebench R11.5 - Cinebench R11.5 CPU Single 64 Bit
3.7 Points (92%)
1.5 Points (38%)
Cinebench R10 - Cinebench R10 Rend. Single (32bit)
12027 Points (73%)
5010 Points (30%)
Cinebench R10 - Cinebench R10 Rend. Multi (32bit)
91081 Points (66%)
11403 Points (8%)
Cinebench R10 - Cinebench R10 Rend. Multi (64bit)
136062 Points (94%)
Cinebench R10 - Cinebench R10 Rend. Single (64bit)
17458 Points (21%)
wPrime 2.10 - wPrime 2.0 1024m *
109.8 s (1%)
wPrime 2.10 - wPrime 2.0 32m *
2.1 s (0%)
WinRAR - WinRAR 4.0
12800 Points (20%)
7-Zip 18.03 - 7-Zip 18.03 Multli Thread 4 runs
135648 MIPS (78%)
7-Zip 18.03 - 7-Zip 18.03 Single Thread 4 runs
7351 MIPS (88%)
X264 HD Benchmark 4.0 - x264 Pass 2
261 fps (91%)
X264 HD Benchmark 4.0 - x264 Pass 1
419 fps (97%)
HWBOT x265 Benchmark v2.2 - HWBOT x265 4k Preset
36.8 fps (65%)
TrueCrypt - TrueCrypt Serpent
2.6 GB/s (0%)
TrueCrypt - TrueCrypt Twofish
4.6 GB/s (79%)
TrueCrypt - TrueCrypt AES
25.6 GB/s (67%)
Blender - Blender 3.3 Classroom CPU *
155 Seconds (2%)
Blender - Blender 2.79 BMW27 CPU *
91 Seconds (1%)
R Benchmark 2.5 - R Benchmark 2.5 *
0.4 sec (8%)
3DMark 06 - CPU - 3DMark 06 - CPU
20665 Points (44%)
Super Pi mod 1.5 XS 1M - Super Pi mod 1.5 XS 1M *
6 s (1%)
Super Pi mod 1.5 XS 2M - Super Pi mod 1.5 XS 2M *
12.8 s (1%)
Super Pi Mod 1.5 XS 32M - Super Pi mod 1.5 XS 32M *
305.9 s (1%)
3DMark 11 - 3DM11 Performance Physics
32336 Points (87%)
3DMark - 3DMark Ice Storm Unlimited Physics
44493 Points (37%)
3DMark - 3DMark Cloud Gate Physics
3712 Points (9%)
3DMark - 3DMark Fire Strike Standard Physics
49142 Points (88%)
3DMark - 3DMark Time Spy CPU
21541 Points (91%)
Geekbench 6.2 - Geekbench 6.2 Single-Core
2902 Points (78%)
Geekbench 6.2 - Geekbench 6.2 Multi-Core
19790 Points (78%)
Geekbench 5.5 - Geekbench 5.1 - 5.4 64 Bit Single-Core
2121 Points (89%)
Geekbench 5.5 - Geekbench 5.1 - 5.4 64 Bit Multi-Core
23159 Points (41%)
Geekbench 5.0 - Geekbench 5.0 64 Bit Single-Core
2045 Points (9%)
Geekbench 5.0 - Geekbench 5.0 64 Bit Multi-Core
22756 Points (72%)
Geekbench 4.4 - Geekbench 4.1 - 4.4 64 Bit Single-Core
9304 Points (93%)
min: 3972     avg: 4182     median: 4181.5 (42%)     max: 4391 Points
Geekbench 4.4 - Geekbench 4.1 - 4.4 64 Bit Multi-Core
79501 Points (87%)
min: 8084     avg: 8706     median: 8706 (10%)     max: 9328 Points
Mozilla Kraken 1.1 - Kraken 1.1 Total Score *
439 ms (1%)
820 ms (1%)
Sunspider - Sunspider 1.0 Total Score *
110.3 ms (1%)
Octane V2 - Octane V2 Total Score
38960 Points (34%)
WebXPRT 4 - WebXPRT 4 Score
314 Points (90%)
WebXPRT 3 - WebXPRT 3 Score
339 Points (71%)
CrossMark - CrossMark Overall
2288 Points (88%)
Power Consumption - Prime95 Power Consumption - external Monitor *
400 Watt (69%)
Power Consumption - Cinebench R15 Multi Power Consumption - external Monitor *
428 Watt (78%)
29.5 Watt (5%)
Power Consumption - Idle Power Consumption - external Monitor *
104.8 Watt (69%)
Power Consumption - Cinebench R15 Multi Power Efficiency - external Monitor
12.8 Points per Watt (10%)
13 Points per Watt (10%)

Average Benchmarks Intel Core i7-14700K → 100% n=24

Average Benchmarks Intel Core i5-7267U → 39% n=24

- Range of benchmark values for this graphics card
- Average benchmark values for this graphics card
* Smaller numbers mean a higher performance
1 This benchmark is not used for the average calculation

Add one or more devices and compare

In the following list you can select (and also search for) devices that should be added to the comparison. You can select more than one device.

restrict list:

show all (including archived), 2024, 2023
v1.28
log 02. 17:00:13

#0 checking url part for id 16391 +0s ... 0s

#1 checking url part for id 8454 +0s ... 0s

#2 redirected to Ajax server, took 1719932413 +0s ... 0s

#3 did not recreate cache, as it is less than 5 days old! Created at Mon, 01 Jul 2024 05:15:43 +0200 +0s ... 0s

#4 composed specs +0.004s ... 0.004s

#5 did output specs +0s ... 0.004s

#6 getting avg benchmarks for device 16391 +0.004s ... 0.008s

#7 got single benchmarks 16391 +0.004s ... 0.013s

#8 getting avg benchmarks for device 8454 +0.001s ... 0.013s

#9 got single benchmarks 8454 +0.004s ... 0.017s

#10 got avg benchmarks for devices +0s ... 0.017s

#11 min, max, avg, median took s +0.04s ... 0.057s

#12 return log +0.002s ... 0.06s

Please share our article, every link counts!
> Expert Reviews and News on Laptops, Smartphones and Tech Innovations > Benchmarks / Tech > Processor Comparison - Head 2 Head
Redaktion, 2017-09- 8 (Update: 2023-07- 1)