Intel Core i7-13700H vs Apple M3
Intel Core i7-13700H ► remove from comparison
The Intel Core i7-13700H is a high-end mobile CPU for laptops based on the Raptor Lake-H series (Alder Lake architecture). It was announced in early 2023 and offers 6 performance cores (P-cores, Golden Cove architecture) and 8 efficient cores (E-cores, Gracemont architecture). The P-cores support Hyper-Threading leading to 20 supported threads when combined with the E-cores. The clock rate ranges from 2.4 to 5 GHz (single core turbo, all-core 4.7 GHz) on the performance cluster and 1.8 to 3.7 GHz on the efficiency cluster. The performance of the E-cores should be similar to old Skylake cores (compare with the Core i7-6920HQ ). All cores can use up to 24 MB L3 cache.
Performance
The average 13700H in our database delivers multi-thread benchmark scores that are most similar to those of the Ryzen 9 PRO 7940HS , Core i7-12700H , Core i9-12900H . This is a very, very fast CPU, as of mid 2023, even if it does not quite manage to demolish its direct predecessor (the 12700H).
Thanks to its powerful cooling solution and a long-term CPU power limit of 90 W, the MSI Pulse 17 B13VGK is among the fastest systems built around the i7-13700H that we know of. It can be 60% faster in CPU-bound workloads than the slowest system in our database powered by the same chip, as of August 2023.
Features
The integrated memory controller supports various memory types up to DDR5-5200 (up from 4800 MHz for the 12th gen). The Thread Director (in hardware) can support the operating system to decide which thread to use on the performance or efficient cores for the best performance. For AI tasks, the CPU also integrates GNA 3.0 and DL Boost (via AVX2). Quick Sync in version 8 is the same as in the Rocket Lake CPUs and supports MPEG-2, AVC, VC-1 decode, JPEG, VP8 decode, VP9, HEVC, and AV1 decode in hardware. The CPU now supports PCIe 5.0 x8 for a GPU and two PCIe 4.0 x4 for SSDs.
The integrated graphics card is based on the Xe-architecture and offers 96 EUs (Execution Units) clocked at up to 1.5 GHz.
The CPU is rated at 45 W base power (115 W PL2) but most laptops will use a PL1 of around 60 Watt. The SoC is manufactured in a 10nm process at Intel, which is known as Intel 7 (improved over the 12th Gen).
Apple M3 ► remove from comparison
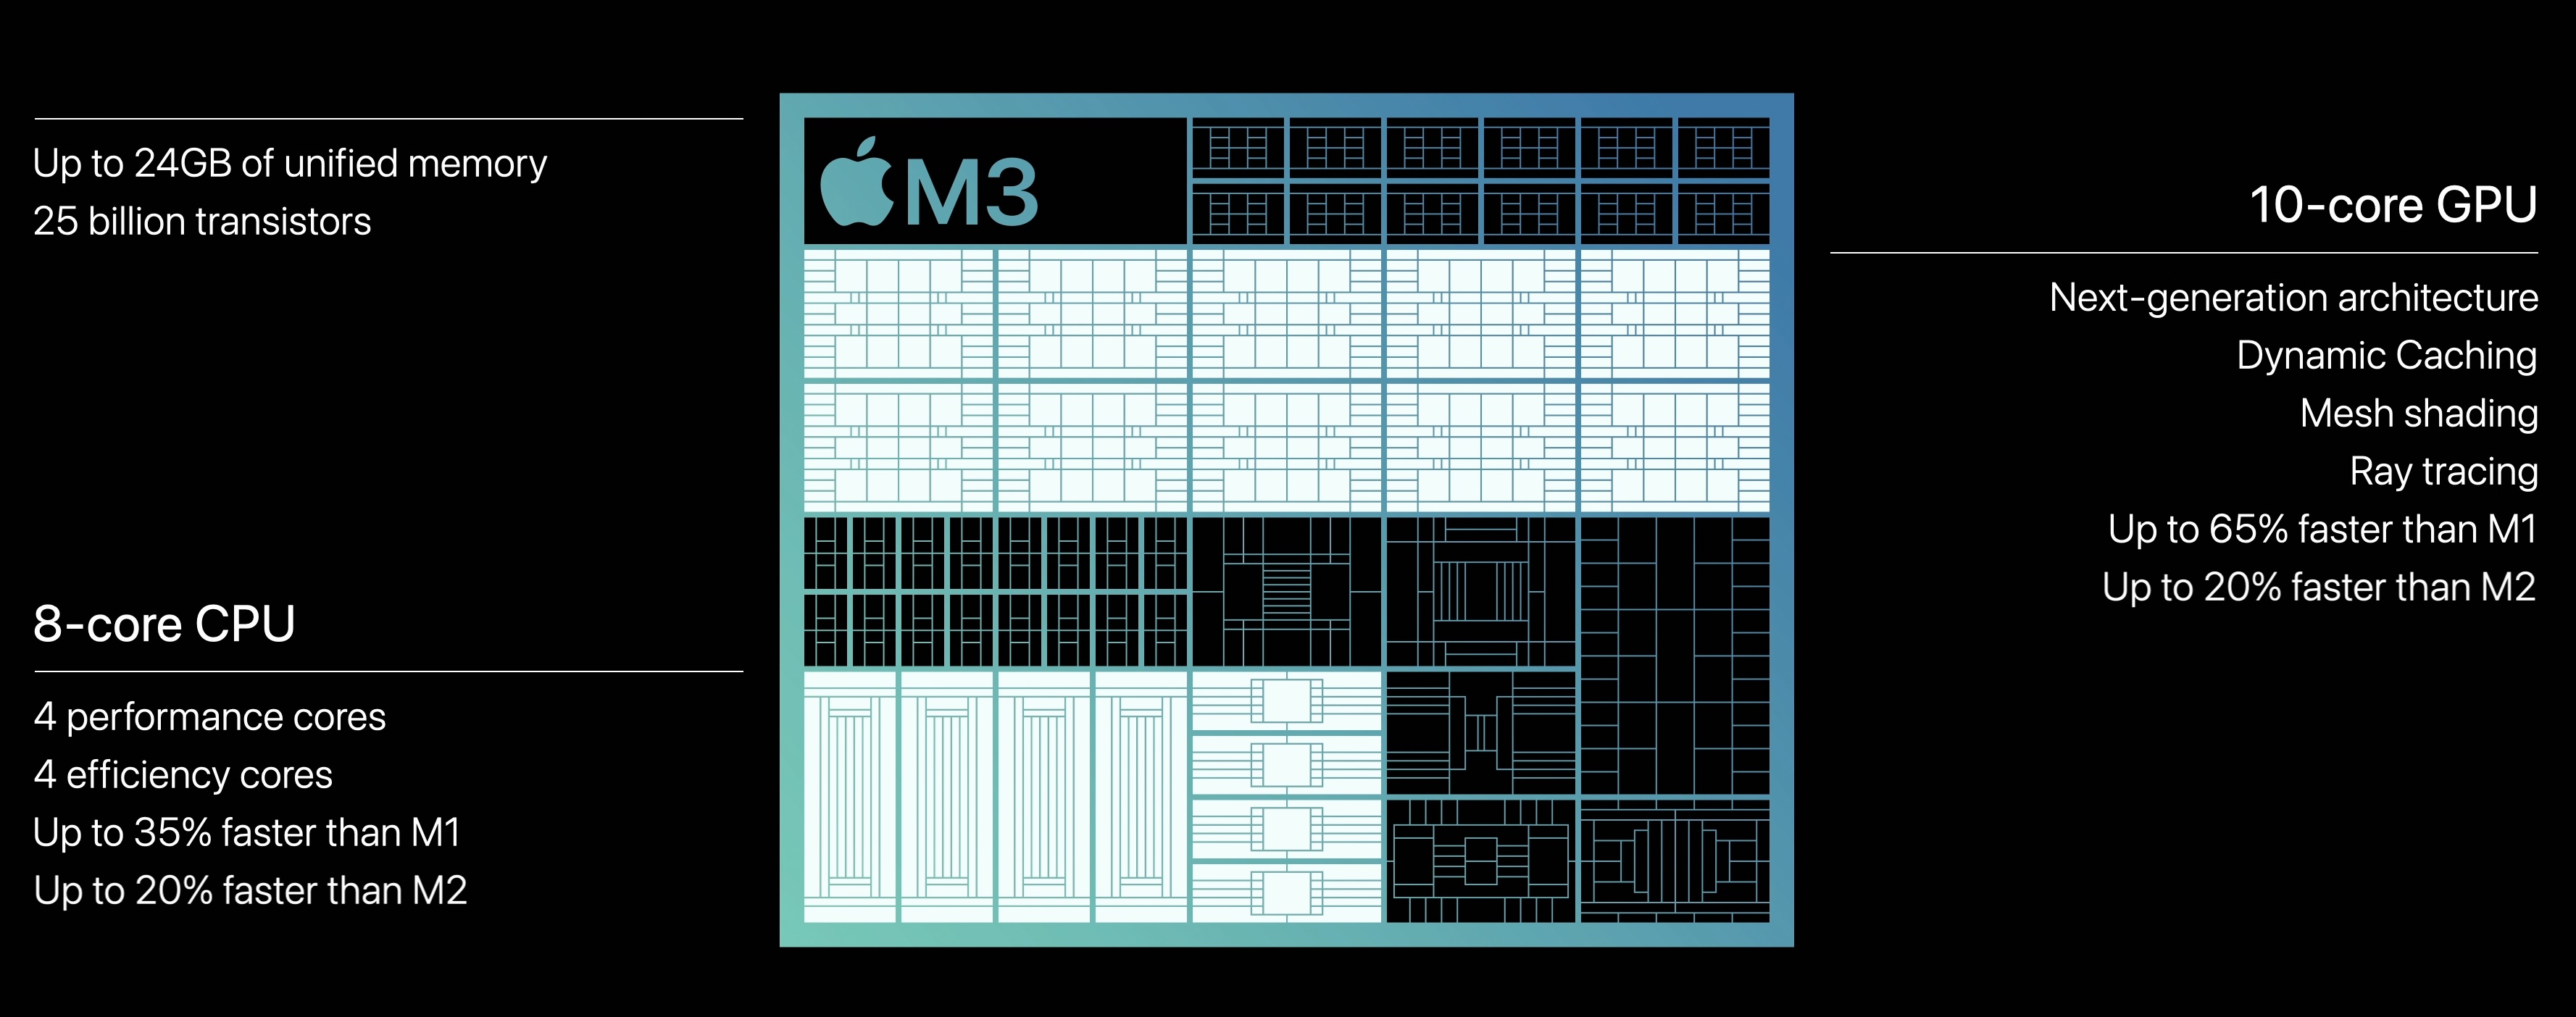
The Apple M3 is a system on a chip (SoC) from Apple for notebooks that was introduced in late 2023. It integrates a new 8-core CPU with 4 performance cores with up to 4.06 GHz and 4 efficiency cores running at up to 2.75 GHz. Apple claims that the CPU is up to 20% faster than in the old Apple M2 (3.5 GHz) .
Due to the higher clock speeds and architecture improvements, the processor performance is also significantly better than the M2 in benchmarks (see e.g. Geekbench below) and can keep up with the fastest CPUs in short single-core tests (like the Raptor Lake i9-13950HX ).
The M3 also integrates a new graphics adapter with dynamic caching, mesh shading and ray tracing acceleration. According to Apple, it is 20% faster than the GPU in the M2 . The chip integrates again 10 GPU cores, but the cheaper variant only offers 8 cores (e.g. in the entry iMac). Furthermore, the GPU only supports 2 displays (an additional 6K60 display to the internal one).
Both GPU and CPU can access the unified memory on the package together. It is still available in 8, 16 and 24 GB variants and offers the same 100 GB/s maximum bandwidth (unlike the Pro models that feature a reduced memory bandwidth).
The integrated 16-core Neural Engine has also been revised and now offers 18 TOPS peak performance (versus 15.8 TOPS in the M2 but 35 TOPS in the new A17 Pro). The video engine now supports AV1 decoding in hardware. H.264, HEVC and ProRes (RAW) can still be decoded and encoded.
Unfortunately, the integrated wireless network module only supports Wi-Fi 6E (no Wi-Fi 7) and due to the support of only a single external monitor, the chip also has to make do with no Thunderbolt 4 (Thunderbolt 3 / USB 4 support only for up to 40 Gbit/s).
The chip is manufactured on the current 3nm TSMC process (N3B most likely) and contains 25 billion transistors (+25% vs. Apple M2). The 3nm process should also contribute to the excellent efficiency of the chip. Under load, the M3 CPU consumes approximately 20 Watt.
Model Intel Core i7-13700H Apple M3 Series Intel Raptor Lake-H Apple Apple M3 Codename Raptor Lake-H Series: Apple M3 Clock 1800 - 5000 MHz 2748 - 4056 MHz L1 Cache 1.2 MB L2 Cache 11.5 MB 4 MB L3 Cache 24 MB Cores / Threads 14 / 20 8 / 8 TDP 45 Watt Technology 10 nm 3 nm max. Temp. 100 °C Socket BGA1744 Features DDR4-3200/LPDDR4x-4266/DDR5-5200/LPDDR5-6400/LPDDR5x-6400 RAM, PCIe 5, Thr. Dir., DL Boost, GNA, MMX, SSE, SSE2, SSE3, SSSE3, SSE4.1, SSE4.2, AVX, AVX2, BMI2, ABM, FMA, ADX, SMEP, SMAP, EIST, TM1, TM2, HT, Turbo, SST, AES-NI, RDRAND, RDSEED, SHA ARMv8 Instruction Set iGPU Intel Iris Xe Graphics G7 96EUs ( - 1500 MHz)Apple M3 10-Core GPU Architecture x86 ARM Announced Manufacturer ark.intel.com www.apple.com Transistors 25000 Million
Benchmarks Performance Rating - CB R15 + R20 + 7-Zip + X265 + Blender + 3DM11 CPU - i7-13700H
44.2 pt (61%)
...
...
max:
Cinebench 2024 - Cinebench 2024 CPU Single Core
111 Points (77%)
min: 140 avg: 141 median: 141 (98%) max: 142 Points
CPU TDP ? TDP 10 W TDP 12 W TDP 20 W TDP 95 W 99% 99% 100% 99% 78%
Cinebench 2024 - Cinebench 2024 CPU Multi Core
818 Points (15%)
min: 576 avg: 622 median: 599.5 (11%) max: 712 Points
CPU TDP ? TDP 10 W TDP 12 W TDP 20 W TDP 95 W 73% 70% 73% 87% 100%
Cinebench R23 - Cinebench R23 Multi Core
min: 5890 avg: 15266 median: 15541.5 (14%) max: 20034 Points
CPU TDP ? TDP 15 W TDP 30 W TDP 40 W TDP 44 W TDP 45 W TDP 50 W TDP 53 W TDP 55 W TDP 60 W TDP 65 W TDP 70 W TDP 80 W TDP 85 W TDP 90 W TDP 95 W TDP 110 W TDP 115 W 68% 29% 58% 75% 72% 72% 80% 87% 85% 72% 70% 79% 94% 86% 91% 91% 86% 100%
min: 10074 avg: 10275 median: 10298 (10%) max: 10454 Points
CPU TDP ? TDP 10 W TDP 12 W TDP 15 W TDP 20 W TDP 30 W TDP 40 W TDP 44 W TDP 45 W TDP 50 W TDP 53 W TDP 55 W TDP 60 W TDP 65 W TDP 70 W TDP 80 W TDP 85 W TDP 90 W TDP 95 W TDP 110 W TDP 115 W 68% 50% 51% 29% 52% 58% 75% 72% 72% 80% 87% 85% 72% 70% 79% 94% 86% 91% 91% 86% 100%
Cinebench R23 - Cinebench R23 Single Core
min: 1323 avg: 1797 median: 1863 (79%) max: 1914 Points
CPU TDP ? TDP 15 W TDP 30 W TDP 40 W TDP 44 W TDP 45 W TDP 50 W TDP 53 W TDP 55 W TDP 60 W TDP 65 W TDP 70 W TDP 80 W TDP 85 W TDP 90 W TDP 95 W TDP 110 W TDP 115 W 99% 77% 69% 98% 100% 94% 98% 99% 99% 94% 99% 98% 81% 85% 89% 100% 97% 97%
min: 1900 avg: 1901 median: 1900 (81%) max: 1904 Points
CPU TDP ? TDP 10 W TDP 12 W TDP 15 W TDP 20 W TDP 30 W TDP 40 W TDP 44 W TDP 45 W TDP 50 W TDP 53 W TDP 55 W TDP 60 W TDP 65 W TDP 70 W TDP 80 W TDP 85 W TDP 90 W TDP 95 W TDP 110 W TDP 115 W 99% 100% 100% 77% 100% 69% 98% 100% 94% 98% 99% 99% 94% 99% 98% 81% 85% 89% 100% 97% 97%
Cinebench R20 - Cinebench R20 CPU (Single Core)
min: 508 avg: 693 median: 719 (80%) max: 741 Points
CPU TDP ? TDP 15 W TDP 30 W TDP 40 W TDP 44 W TDP 45 W TDP 50 W TDP 53 W TDP 55 W TDP 60 W TDP 65 W TDP 70 W TDP 80 W TDP 85 W TDP 90 W TDP 95 W TDP 110 W TDP 115 W 99% 77% 69% 99% 99% 94% 99% 100% 99% 95% 98% 99% 81% 88% 91% 100% 98% 98%
504 Points (56%)
CPU TDP ? TDP 15 W TDP 20 W TDP 30 W TDP 40 W TDP 44 W TDP 45 W TDP 50 W TDP 53 W TDP 55 W TDP 60 W TDP 65 W TDP 70 W TDP 80 W TDP 85 W TDP 90 W TDP 95 W TDP 110 W TDP 115 W 99% 77% 69% 69% 99% 99% 94% 99% 100% 99% 95% 98% 99% 81% 88% 91% 100% 98% 98%
Cinebench R20 - Cinebench R20 CPU (Multi Core)
min: 2322 avg: 5945 median: 6018.5 (15%) max: 7674 Points
CPU TDP ? TDP 15 W TDP 30 W TDP 40 W TDP 44 W TDP 45 W TDP 50 W TDP 53 W TDP 55 W TDP 60 W TDP 65 W TDP 70 W TDP 80 W TDP 85 W TDP 90 W TDP 95 W TDP 110 W TDP 115 W 70% 30% 58% 75% 76% 72% 80% 86% 85% 85% 69% 79% 92% 86% 94% 91% 86% 100%
2818 Points (7%)
CPU TDP ? TDP 15 W TDP 20 W TDP 30 W TDP 40 W TDP 44 W TDP 45 W TDP 50 W TDP 53 W TDP 55 W TDP 60 W TDP 65 W TDP 70 W TDP 80 W TDP 85 W TDP 90 W TDP 95 W TDP 110 W TDP 115 W 70% 30% 37% 58% 75% 76% 72% 80% 86% 85% 85% 69% 79% 92% 86% 94% 91% 86% 100%
Cinebench R15 - Cinebench R15 CPU Multi 64 Bit
min: 905 avg: 2455 median: 2505.5 (16%) max: 2982 Points
CPU TDP ? TDP 15 W TDP 30 W TDP 40 W TDP 44 W TDP 45 W TDP 50 W TDP 53 W TDP 55 W TDP 60 W TDP 65 W TDP 70 W TDP 80 W TDP 85 W TDP 90 W TDP 95 W TDP 110 W TDP 115 W 76% 31% 78% 86% 77% 77% 90% 90% 95% 90% 81% 90% 100% 95% 99% 95% 96% 99%
1499 Points (9%)
CPU TDP ? TDP 15 W TDP 20 W TDP 30 W TDP 40 W TDP 44 W TDP 45 W TDP 50 W TDP 53 W TDP 55 W TDP 60 W TDP 65 W TDP 70 W TDP 80 W TDP 85 W TDP 90 W TDP 95 W TDP 110 W TDP 115 W 76% 31% 52% 78% 86% 77% 77% 90% 90% 95% 90% 81% 90% 100% 95% 99% 95% 96% 99%
Cinebench R15 - Cinebench R15 CPU Single 64 Bit
min: 213 avg: 260.4 median: 269 (81%) max: 278 Points
CPU TDP ? TDP 15 W TDP 30 W TDP 40 W TDP 44 W TDP 45 W TDP 50 W TDP 53 W TDP 55 W TDP 60 W TDP 65 W TDP 70 W TDP 80 W TDP 85 W TDP 90 W TDP 95 W TDP 110 W TDP 115 W 98% 78% 77% 97% 94% 93% 97% 98% 98% 93% 94% 98% 80% 87% 90% 100% 97% 98%
271 Points (82%)
CPU TDP ? TDP 15 W TDP 20 W TDP 30 W TDP 40 W TDP 44 W TDP 45 W TDP 50 W TDP 53 W TDP 55 W TDP 60 W TDP 65 W TDP 70 W TDP 80 W TDP 85 W TDP 90 W TDP 95 W TDP 110 W TDP 115 W 98% 78% 97% 77% 97% 94% 93% 97% 98% 98% 93% 94% 98% 80% 87% 90% 100% 97% 98%
Cinebench R11.5 - Cinebench R11.5 CPU Multi 64 Bit
33.8 Points (44%)
Cinebench R11.5 - Cinebench R11.5 CPU Single 64 Bit
3.3 Points (82%)
Cinebench R10 - Cinebench R10 Rend. Single (32bit)
10487 Points (63%)
Cinebench R10 - Cinebench R10 Rend. Multi (32bit)
65623 Points (48%)
Cinebench R10 - Cinebench R10 Rend. Multi (64bit)
100409 Points (70%)
Cinebench R10 - Cinebench R10 Rend. Single (64bit)
15266 Points (19%)
wPrime 2.10 - wPrime 2.0 1024m *
208.8 s (2%)
wPrime 2.10 - wPrime 2.0 32m *
2.9 s (1%)
7559 Points (12%)
7-Zip 18.03 - 7-Zip 18.03 Multli Thread 4 runs
min: 27322 avg: 61025 median: 61381.5 (35%) max: 76344 MIPS
CPU TDP ? TDP 15 W TDP 30 W TDP 40 W TDP 44 W TDP 45 W TDP 50 W TDP 53 W TDP 55 W TDP 60 W TDP 65 W TDP 70 W TDP 80 W TDP 85 W TDP 90 W TDP 95 W TDP 110 W TDP 115 W 74% 36% 65% 75% 72% 78% 83% 92% 93% 88% 72% 79% 93% 92% 98% 69% 89% 100%
7-Zip 18.03 - 7-Zip 18.03 Single Thread 4 runs
min: 4825 avg: 5858 median: 6034 (72%) max: 6238 MIPS
CPU TDP ? TDP 15 W TDP 30 W TDP 40 W TDP 44 W TDP 45 W TDP 50 W TDP 53 W TDP 55 W TDP 60 W TDP 65 W TDP 70 W TDP 80 W TDP 85 W TDP 90 W TDP 95 W TDP 110 W TDP 115 W 100% 86% 78% 99% 98% 95% 97% 97% 99% 94% 100% 99% 80% 87% 89% 99% 97% 99%
X264 HD Benchmark 4.0 - x264 Pass 2
167.5 fps (58%)
X264 HD Benchmark 4.0 - x264 Pass 1
340.5 fps (79%)
HWBOT x265 Benchmark v2.2 - HWBOT x265 4k Preset
min: 6.72 avg: 16.7 median: 16.9 (30%) max: 21.2 fps
CPU TDP ? TDP 15 W TDP 30 W TDP 40 W TDP 44 W TDP 45 W TDP 50 W TDP 53 W TDP 55 W TDP 60 W TDP 65 W TDP 70 W TDP 80 W TDP 85 W TDP 90 W TDP 95 W TDP 110 W TDP 115 W 74% 32% 62% 68% 83% 75% 79% 89% 90% 87% 74% 81% 94% 85% 100% 85% 93% 93%
TrueCrypt - TrueCrypt Serpent
1.5 GB/s (0%)
TrueCrypt - TrueCrypt Twofish
2.9 GB/s (50%)
TrueCrypt - TrueCrypt AES
16.1 GB/s (42%)
Blender - Blender 3.3 Classroom CPU *
min: 295 avg: 404.1 median: 385 (5%) max: 907 Seconds
CPU TDP ? TDP 15 W TDP 30 W TDP 40 W TDP 44 W TDP 45 W TDP 50 W TDP 53 W TDP 55 W TDP 60 W TDP 65 W TDP 70 W TDP 80 W TDP 85 W TDP 90 W TDP 95 W TDP 110 W TDP 115 W 107% 100% 106% 106% 107% 107% 108% 108% 108% 108% 107% 107% 108% 108% 109% 109% 108% 109%
min: 491 avg: 590 median: 517 (7%) max: 761 Seconds
CPU TDP ? TDP 10 W TDP 12 W TDP 15 W TDP 20 W TDP 30 W TDP 40 W TDP 44 W TDP 45 W TDP 50 W TDP 53 W TDP 55 W TDP 60 W TDP 65 W TDP 70 W TDP 80 W TDP 85 W TDP 90 W TDP 95 W TDP 110 W TDP 115 W 107% 106% 106% 100% 102% 106% 106% 107% 107% 108% 108% 108% 108% 107% 107% 108% 108% 109% 109% 108% 109%
Blender - Blender 2.79 BMW27 CPU *
min: 169 avg: 229.4 median: 217 (2%) max: 555 Seconds
CPU TDP ? TDP 15 W TDP 30 W TDP 40 W TDP 44 W TDP 45 W TDP 50 W TDP 53 W TDP 55 W TDP 60 W TDP 65 W TDP 70 W TDP 80 W TDP 85 W TDP 90 W TDP 95 W TDP 110 W TDP 115 W 102% 100% 102% 102% 102% 102% 102% 103% 103% 103% 102% 102% 103% 103% 103% 103% 103% 103%
min: 474 avg: 509 median: 494 (3%) max: 558 Seconds
CPU TDP ? TDP 10 W TDP 12 W TDP 15 W TDP 20 W TDP 30 W TDP 40 W TDP 44 W TDP 45 W TDP 50 W TDP 53 W TDP 55 W TDP 60 W TDP 65 W TDP 70 W TDP 80 W TDP 85 W TDP 90 W TDP 95 W TDP 110 W TDP 115 W 102% 100% 100% 100% 101% 102% 102% 103% 102% 102% 103% 103% 103% 102% 102% 103% 103% 103% 103% 103% 103%
R Benchmark 2.5 - R Benchmark 2.5 *
min: 0.4308 avg: 0.5 median: 0.4 (10%) max: 0.607 sec
CPU TDP ? TDP 15 W TDP 30 W TDP 40 W TDP 44 W TDP 45 W TDP 50 W TDP 53 W TDP 55 W TDP 60 W TDP 65 W TDP 70 W TDP 80 W TDP 85 W TDP 90 W TDP 95 W TDP 110 W TDP 115 W 104% 102% 100% 104% 104% 103% 104% 104% 104% 104% 104% 104% 102% 103% 103% 104% 104% 104%
3DMark 06 - CPU - 3DMark 06 - CPU
min: 13025 avg: 15916 median: 15415 (33%) max: 19810 Points
CPU TDP 45 W TDP 50 W TDP 60 W TDP 70 W 66% 100% 78% 78%
Super Pi mod 1.5 XS 1M - Super Pi mod 1.5 XS 1M *
6.8 s (1%)
Super Pi mod 1.5 XS 2M - Super Pi mod 1.5 XS 2M *
14.8 s (1%)
Super Pi Mod 1.5 XS 32M - Super Pi mod 1.5 XS 32M *
371.9 s (2%)
3DMark Vantage - 3DM Vant. Perf. CPU no Physx
79797 Points (70%)
3DMark 11 - 3DM11 Performance Physics
min: 7388 avg: 19959 median: 20503.5 (55%) max: 25179 Points
CPU TDP ? TDP 15 W TDP 30 W TDP 40 W TDP 44 W TDP 45 W TDP 50 W TDP 53 W TDP 55 W TDP 60 W TDP 65 W TDP 70 W TDP 80 W TDP 85 W TDP 90 W TDP 95 W TDP 110 W TDP 115 W 83% 29% 71% 72% 65% 75% 82% 93% 94% 88% 67% 84% 92% 79% 98% 65% 87% 100%
3DMark - 3DMark Ice Storm Physics
min: 81147 avg: 91751 median: 92897 (75%) max: 100286 Points
CPU TDP 40 W TDP 45 W TDP 60 W TDP 65 W TDP 115 W 93% 96% 88% 81% 100%
3DMark - 3DMark Ice Storm Extreme Physics
min: 88650 avg: 97627 median: 99436 (81%) max: 104795 Points
CPU TDP ? TDP 60 W TDP 115 W 100% 85% 95%
3DMark - 3DMark Ice Storm Unlimited Physics
min: 89385 avg: 96005 median: 98040 (83%) max: 100591 Points
CPU TDP ? TDP 60 W TDP 115 W 100% 89% 97%
3DMark - 3DMark Cloud Gate Physics
min: 7531 avg: 17293 median: 17753 (45%) max: 22289 Points
CPU TDP ? TDP 15 W TDP 30 W TDP 40 W TDP 45 W TDP 50 W TDP 60 W TDP 65 W TDP 70 W TDP 80 W TDP 85 W TDP 90 W TDP 95 W TDP 110 W TDP 115 W 91% 34% 58% 74% 78% 72% 86% 63% 79% 87% 69% 100% 85% 84% 91%
3DMark - 3DMark Fire Strike Standard Physics
min: 4242 avg: 24628 median: 26188 (47%) max: 30010 Points
CPU TDP ? TDP 15 W TDP 30 W TDP 40 W TDP 44 W TDP 45 W TDP 50 W TDP 53 W TDP 55 W TDP 60 W TDP 65 W TDP 70 W TDP 80 W TDP 85 W TDP 90 W TDP 95 W TDP 110 W TDP 115 W 70% 36% 69% 79% 86% 84% 88% 96% 90% 93% 68% 92% 94% 73% 98% 100% 92% 98%
3DMark - 3DMark Time Spy CPU
min: 4312 avg: 10479 median: 11075 (47%) max: 13904 Points
CPU TDP ? TDP 15 W TDP 30 W TDP 40 W TDP 44 W TDP 45 W TDP 50 W TDP 53 W TDP 55 W TDP 60 W TDP 65 W TDP 70 W TDP 80 W TDP 85 W TDP 90 W TDP 95 W TDP 110 W TDP 115 W 71% 31% 57% 61% 66% 72% 83% 95% 91% 96% 72% 83% 100% 72% 100% 67% 92% 87%
Geekbench 6.2 - Geekbench 6.2 Single-Core
min: 2316 avg: 2551 median: 2605 (70%) max: 2639 Points
CPU TDP ? TDP 44 W TDP 45 W TDP 50 W TDP 60 W TDP 70 W TDP 90 W TDP 95 W 100% 99% 95% 100% 94% 100% 88% 97%
min: 3026 avg: 3077 median: 3076 (83%) max: 3130 Points
CPU TDP ? TDP 10 W TDP 12 W TDP 20 W TDP 44 W TDP 45 W TDP 50 W TDP 60 W TDP 70 W TDP 90 W TDP 95 W 91% 97% 100% 99% 83% 80% 84% 79% 84% 74% 82%
Geekbench 6.2 - Geekbench 6.2 Multi-Core
min: 8415 avg: 11887 median: 11872.5 (47%) max: 13832 Points
CPU TDP ? TDP 44 W TDP 45 W TDP 50 W TDP 60 W TDP 70 W TDP 90 W TDP 95 W 85% 77% 81% 100% 95% 100% 96% 62%
min: 11863 avg: 11984 median: 11992 (47%) max: 12066 Points
CPU TDP ? TDP 10 W TDP 12 W TDP 20 W TDP 44 W TDP 45 W TDP 50 W TDP 60 W TDP 70 W TDP 90 W TDP 95 W 87% 89% 89% 89% 77% 81% 100% 95% 100% 96% 62%
Geekbench 5.5 - Geekbench 5.1 - 5.4 64 Bit Single-Core
min: 1362 avg: 1792 median: 1828.5 (77%) max: 1919 Points
CPU TDP ? TDP 15 W TDP 30 W TDP 40 W TDP 44 W TDP 45 W TDP 50 W TDP 53 W TDP 55 W TDP 60 W TDP 65 W TDP 70 W TDP 80 W TDP 85 W TDP 90 W TDP 95 W TDP 110 W TDP 115 W 98% 88% 72% 98% 97% 93% 98% 99% 96% 93% 98% 100% 80% 90% 90% 94% 96% 96%
min: 2256 avg: 2316 median: 2342 (99%) max: 2350 Points
CPU TDP ? TDP 10 W TDP 12 W TDP 15 W TDP 20 W TDP 30 W TDP 40 W TDP 44 W TDP 45 W TDP 50 W TDP 53 W TDP 55 W TDP 60 W TDP 65 W TDP 70 W TDP 80 W TDP 85 W TDP 90 W TDP 95 W TDP 110 W TDP 115 W 79% 96% 100% 71% 100% 58% 79% 78% 75% 80% 80% 78% 75% 79% 81% 65% 73% 73% 76% 78% 78%
Geekbench 5.5 - Geekbench 5.1 - 5.4 64 Bit Multi-Core
min: 6165 avg: 11777 median: 12127 (22%) max: 14215 Points
CPU TDP ? TDP 15 W TDP 30 W TDP 40 W TDP 44 W TDP 45 W TDP 50 W TDP 53 W TDP 55 W TDP 60 W TDP 65 W TDP 70 W TDP 80 W TDP 85 W TDP 90 W TDP 95 W TDP 110 W TDP 115 W 83% 45% 73% 82% 75% 80% 92% 96% 100% 93% 86% 94% 95% 94% 96% 65% 93% 96%
min: 10570 avg: 10697 median: 10748 (19%) max: 10774 Points
CPU TDP ? TDP 10 W TDP 12 W TDP 15 W TDP 20 W TDP 30 W TDP 40 W TDP 44 W TDP 45 W TDP 50 W TDP 53 W TDP 55 W TDP 60 W TDP 65 W TDP 70 W TDP 80 W TDP 85 W TDP 90 W TDP 95 W TDP 110 W TDP 115 W 83% 78% 77% 45% 78% 73% 82% 75% 80% 92% 96% 100% 93% 86% 94% 95% 94% 96% 65% 93% 96%
Geekbench 5.0 - Geekbench 5.0 64 Bit Single-Core
min: 1761 avg: 1810 median: 1815 (8%) max: 1854 Points
CPU TDP ? TDP 55 W TDP 115 W 100% 95% 98%
Geekbench 5.0 - Geekbench 5.0 64 Bit Multi-Core
min: 12854 avg: 13227 median: 13200 (42%) max: 13628 Points
CPU TDP ? TDP 55 W TDP 115 W 94% 100% 97%
Geekbench 4.4 - Geekbench 4.1 - 4.4 64 Bit Single-Core
8083 Points (81%)
Geekbench 4.4 - Geekbench 4.1 - 4.4 64 Bit Multi-Core
50819 Points (56%)
Mozilla Kraken 1.1 - Kraken 1.1 Total Score *
min: 490 avg: 513 median: 499.5 (1%) max: 570 ms
CPU TDP ? TDP 40 W TDP 44 W TDP 45 W TDP 50 W TDP 53 W TDP 55 W TDP 60 W TDP 65 W TDP 70 W TDP 80 W TDP 85 W TDP 90 W TDP 95 W TDP 115 W 100% 100% 100% 100% 100% 100% 100% 100% 100% 100% 100% 100% 100% 100% 100%
min: 362.8 avg: 366.4 median: 363.1 (0%) max: 373.2 ms
CPU TDP ? TDP 10 W TDP 12 W TDP 20 W TDP 40 W TDP 44 W TDP 45 W TDP 50 W TDP 53 W TDP 55 W TDP 60 W TDP 65 W TDP 70 W TDP 80 W TDP 85 W TDP 90 W TDP 95 W TDP 115 W 100% 100% 100% 100% 100% 100% 100% 100% 100% 100% 100% 100% 100% 100% 100% 100% 100% 100%
Octane V2 - Octane V2 Total Score
min: 78885 avg: 90890 median: 92987 (82%) max: 96738 Points
CPU TDP ? TDP 40 W TDP 45 W TDP 50 W TDP 53 W TDP 60 W TDP 70 W TDP 80 W TDP 85 W 100% 97% 94% 98% 100% 86% 93% 82% 95%
min: 96622 avg: 97216 median: 96933 (85%) max: 98093 Points
CPU TDP ? TDP 10 W TDP 12 W TDP 20 W TDP 40 W TDP 45 W TDP 50 W TDP 53 W TDP 60 W TDP 70 W TDP 80 W TDP 85 W 97% 99% 100% 99% 95% 92% 96% 98% 85% 91% 80% 93%
WebXPRT 4 - WebXPRT 4 Score
min: 208 avg: 262.7 median: 270 (78%) max: 325 Points
CPU TDP ? TDP 40 W TDP 45 W TDP 50 W TDP 53 W TDP 55 W TDP 60 W TDP 65 W TDP 70 W TDP 80 W TDP 85 W TDP 90 W TDP 95 W TDP 115 W 100% 92% 84% 93% 92% 93% 89% 93% 95% 78% 83% 81% 94% 92%
min: 313 avg: 314 median: 314 (90%) max: 315 Points
CPU TDP ? TDP 10 W TDP 12 W TDP 40 W TDP 45 W TDP 50 W TDP 53 W TDP 55 W TDP 60 W TDP 65 W TDP 70 W TDP 80 W TDP 85 W TDP 90 W TDP 95 W TDP 115 W 92% 99% 100% 85% 77% 86% 85% 86% 82% 86% 88% 72% 77% 75% 87% 85%
WebXPRT 3 - WebXPRT 3 Score
min: 215 avg: 289.3 median: 297 (62%) max: 321 Points
CPU TDP ? TDP 40 W TDP 45 W TDP 50 W TDP 53 W TDP 55 W TDP 60 W TDP 65 W TDP 70 W TDP 80 W TDP 85 W TDP 90 W TDP 95 W TDP 115 W 98% 96% 88% 99% 98% 100% 89% 97% 100% 69% 89% 84% 95% 95%
min: 423 avg: 438.7 median: 445 (93%) max: 448 Points
CPU TDP ? TDP 10 W TDP 12 W TDP 20 W TDP 40 W TDP 45 W TDP 50 W TDP 53 W TDP 55 W TDP 60 W TDP 65 W TDP 70 W TDP 80 W TDP 85 W TDP 90 W TDP 95 W TDP 115 W 68% 99% 100% 94% 66% 61% 69% 68% 69% 62% 68% 69% 48% 62% 58% 66% 66%
CrossMark - CrossMark Overall
min: 1205 avg: 1757 median: 1768 (68%) max: 2073 Points
CPU TDP ? TDP 30 W TDP 40 W TDP 44 W TDP 45 W TDP 50 W TDP 53 W TDP 55 W TDP 60 W TDP 65 W TDP 70 W TDP 80 W TDP 85 W TDP 90 W TDP 95 W TDP 115 W 86% 63% 99% 90% 90% 97% 94% 93% 95% 98% 100% 86% 91% 100% 90% 94%
min: 1847 avg: 1850 median: 1847 (71%) max: 1857 Points
CPU TDP ? TDP 10 W TDP 12 W TDP 20 W TDP 30 W TDP 40 W TDP 44 W TDP 45 W TDP 50 W TDP 53 W TDP 55 W TDP 60 W TDP 65 W TDP 70 W TDP 80 W TDP 85 W TDP 90 W TDP 95 W TDP 115 W 86% 97% 98% 97% 63% 99% 90% 90% 97% 94% 93% 95% 98% 100% 86% 91% 100% 90% 94%
Power Consumption - Prime95 Power Consumption - external Monitor *
min: 37.8 avg: 89.4 median: 83.3 (14%) max: 148 Watt
CPU TDP ? TDP 40 W TDP 44 W TDP 45 W TDP 50 W TDP 53 W TDP 55 W TDP 60 W TDP 65 W TDP 70 W TDP 80 W TDP 85 W TDP 90 W TDP 95 W TDP 115 W 117% 117% 115% 119% 116% 112% 110% 112% 121% 114% 101% 113% 102% 108% 100%
Power Consumption - Cinebench R15 Multi Power Consumption - external Monitor *
min: 67.7 avg: 114.5 median: 116.2 (21%) max: 166 Watt
CPU TDP ? TDP 40 W TDP 44 W TDP 45 W TDP 50 W TDP 53 W TDP 55 W TDP 60 W TDP 65 W TDP 80 W TDP 85 W TDP 90 W TDP 95 W TDP 115 W 122% 120% 111% 122% 112% 114% 109% 119% 124% 101% 108% 102% 105% 100%
Power Consumption - Idle Power Consumption - external Monitor *
min: 4.1 avg: 13.3 median: 14.9 (10%) max: 24.4 Watt
CPU TDP ? TDP 40 W TDP 44 W TDP 45 W TDP 50 W TDP 53 W TDP 55 W TDP 60 W TDP 65 W TDP 70 W TDP 80 W TDP 85 W TDP 90 W TDP 95 W TDP 115 W 111% 108% 114% 111% 112% 113% 106% 104% 116% 100% 105% 105% 105% 104% 104%
min: 2.63 avg: 2.8 median: 2.8 (2%) max: 2.87 Watt
CPU TDP ? TDP 10 W TDP 12 W TDP 20 W TDP 40 W TDP 44 W TDP 45 W TDP 50 W TDP 53 W TDP 55 W TDP 60 W TDP 65 W TDP 70 W TDP 80 W TDP 85 W TDP 90 W TDP 95 W TDP 115 W 111% 117% 117% 117% 108% 114% 111% 112% 113% 106% 104% 116% 100% 105% 105% 105% 104% 104%
Power Consumption - Idle Power Consumption 150cd 1min *
min: 5.21 avg: 11.6 median: 11.9 (13%) max: 20.1 Watt
CPU TDP ? TDP 40 W TDP 45 W TDP 50 W TDP 53 W TDP 55 W TDP 60 W TDP 65 W TDP 70 W TDP 80 W TDP 85 W TDP 90 W TDP 95 W TDP 115 W 107% 110% 108% 107% 108% 100% 104% 115% 106% 104% 106% 110% 103% 102%
min: 3.94 avg: 4.4 median: 4.4 (5%) max: 4.7 Watt
CPU TDP ? TDP 10 W TDP 12 W TDP 20 W TDP 40 W TDP 45 W TDP 50 W TDP 53 W TDP 55 W TDP 60 W TDP 65 W TDP 70 W TDP 80 W TDP 85 W TDP 90 W TDP 95 W TDP 115 W 107% 117% 116% 117% 110% 108% 107% 108% 100% 104% 115% 106% 104% 106% 110% 103% 102%
Power Consumption - Cinebench R15 Multi Power Efficiency - external Monitor
min: 17.9 avg: 23.5 median: 23.3 (17%) max: 29.6 Points per Watt
CPU TDP ? TDP 40 W TDP 44 W TDP 45 W TDP 50 W TDP 53 W TDP 55 W TDP 60 W TDP 85 W TDP 95 W 93% 100% 60% 92% 71% 79% 70% 80% 68% 64%
Average Benchmarks Intel Core i7-13700H → 100% n=19 Average Benchmarks Apple M3 → 98% n=19
- Range of benchmark values for this graphics card
- Average benchmark values for this graphics card
* Smaller numbers mean a higher performance
1 This benchmark is not used for the average calculation
v1.28
log 02. 05:35:55
#0 checking url part for id 14721 +0s ... 0s
#1 checking url part for id 15110 +0s ... 0s
#2 redirected to Ajax server, took 1719891354 +0s ... 0s
#3 did not recreate cache, as it is less than 5 days old! Created at Mon, 01 Jul 2024 05:15:43 +0200 +0s ... 0s
#4 composed specs +0.007s ... 0.008s
#5 did output specs +0s ... 0.008s
#6 getting avg benchmarks for device 14721 +0.005s ... 0.012s
#7 got single benchmarks 14721 +0.042s ... 0.054s
#8 getting avg benchmarks for device 15110 +0.001s ... 0.055s
#9 got single benchmarks 15110 +0.007s ... 0.062s
#10 got avg benchmarks for devices +0s ... 0.062s
#11 min, max, avg, median took s +0.053s ... 0.115s
#12 return log +0.002s ... 0.117s
Please share our article, every link counts!
Redaktion, 2017-09- 8 (Update: 2023-07- 1)
 Deutsch
 English
 Español
 Français
 Italiano
 Nederlands
 Polski
 Português
 Русский
 Türkçe
 Svenska
 Chinese
 Magyar