Notebookcheck Logo

Intel Core i7-1365U vs Apple M2 vs Apple M2 Pro 10-Core

Intel Core i7-1365U

► remove from comparison Intel i7-1365U

The Intel Core i7-1365U is a high-end mobile CPU for thin and light laptops based on the Alder Lake architecture (Raptor Lake-U / RPL-U series). It was announced in early 2023 and offers 2  performance cores (P-cores, Golden Cove architecture) and 8 efficient cores (E-cores, Gracemont architecture). The P-cores support Hyper-Threading leading to 12 supported threads when combined with the E-cores. The clock rate ranges from 1.8 to 5.2 GHz on the performance cluster and 1.3 to 3.9 GHz on the efficient cluster. The performance of the E-cores should be similar to old Skylake cores (compare to the Core i7-6700HQ). All cores can use up to 12 MB L3 cache. The CPU supports all "Enterprise" vPro management features. Compared to the P-series (28W) or H-series (45W), the 15W TDP may limit the sustained performance.

Performance

Thanks to the high clock speed, the Core i7-1365U should perform slightly better than the older core i7-1265U (up to 4.8 GHz).

Architecture

The integrated memory controller supports various memory types up to LPDDR5-6400. The Thread Director (in hardware) can support the operating system to decide which thread to use on the performance or efficient cores for the best performance. For AI tasks, the CPU also integrates GNA 3.0 and DL Boost (via AVX2). Quick Sync in version 8 is the same as in the Rocket Lake CPUs and supports MPEG-2, AVC, VC-1 decode, JPEG, VP8 decode, VP9, HEVC, and AV1 decode in hardware. The CPU still only supports PCIe 4.0 x8 for a GPU and two PCIe 4.0 x4 for SSDs.

The integrated graphics card is based on the Xe-architecture and offers all 96 EUs (Execution Units) operating at up to 1.3 GHz.

Power consumption

This Core i7 CPU is rated at a TDP of 15W (base power, PL1) and a maximum turbo power of 55W (PL2). The RPL-U processors are built in a further improved Intel 7 process (10nm SuperFin) that allows higher clock rates.

Apple M2

► remove from comparison Apple M2

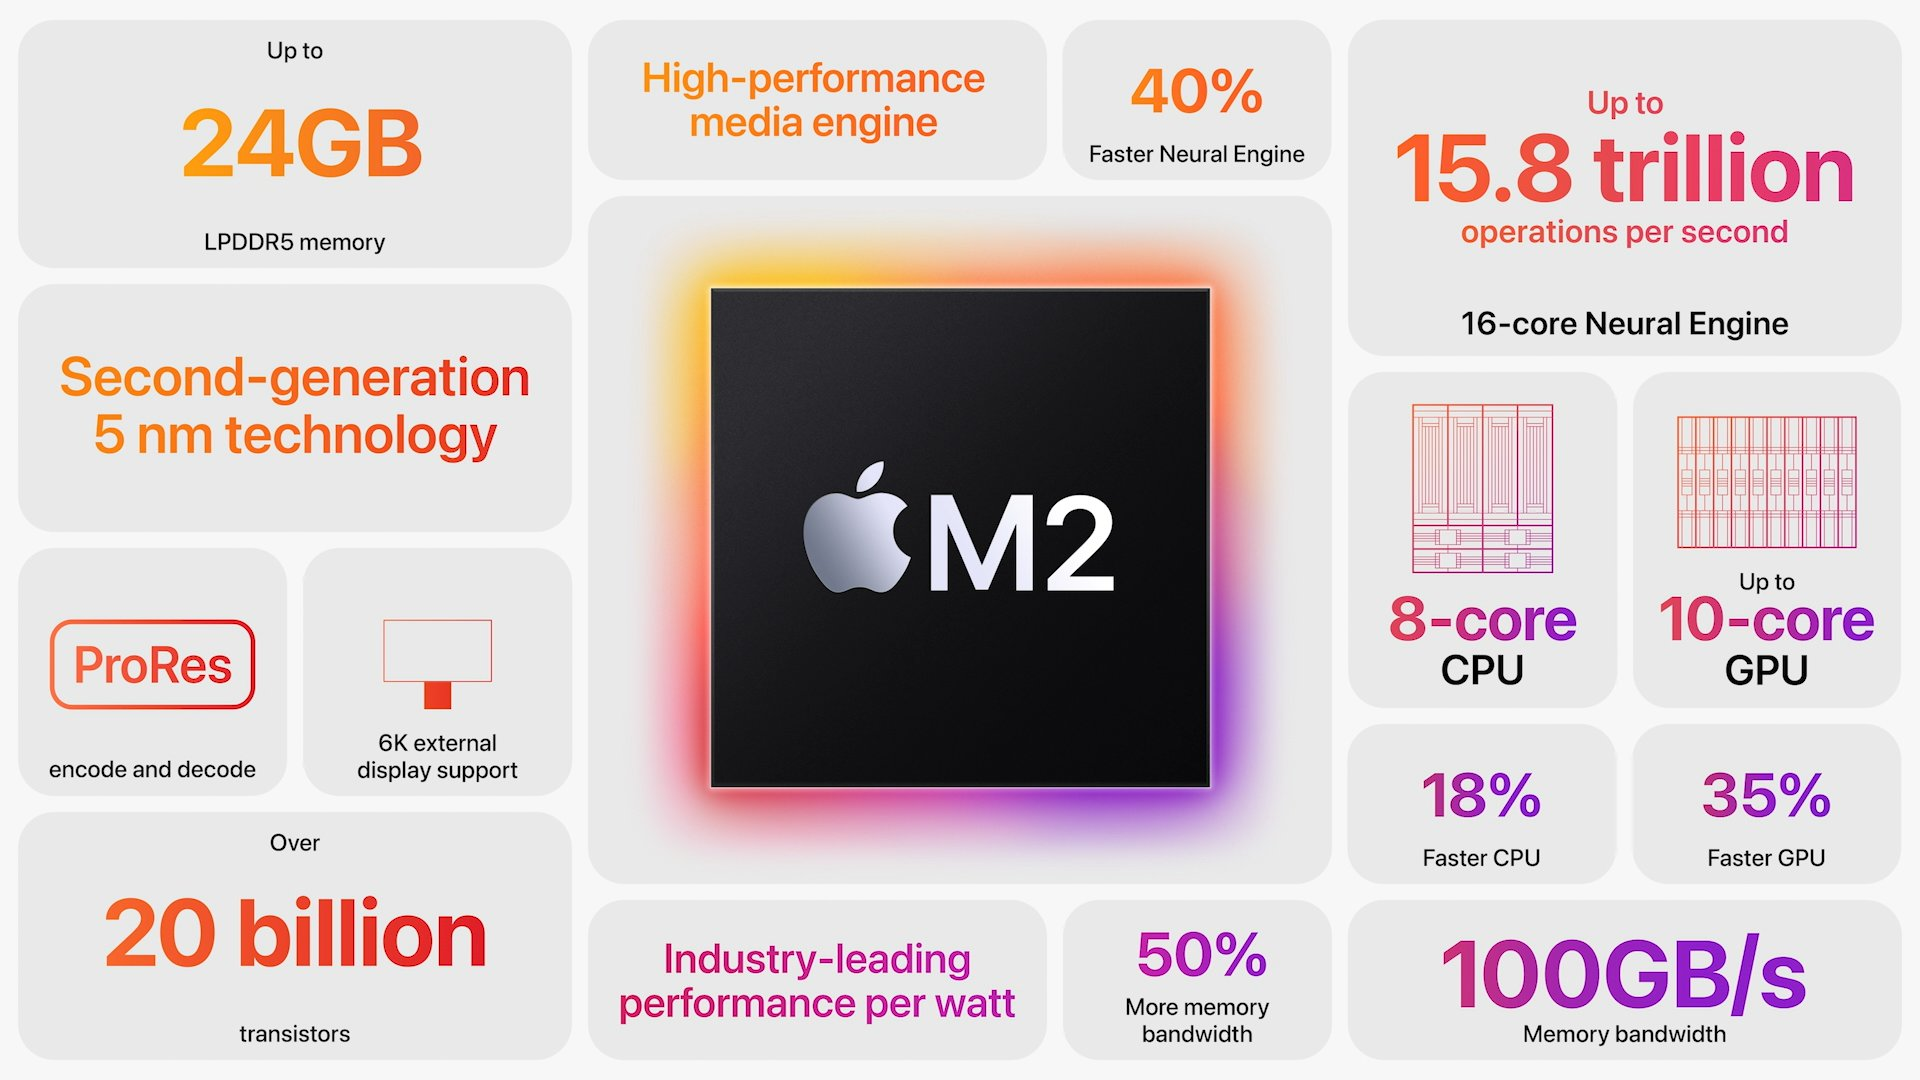
The Apple M2 is a System on a Chip (SoC) from Apple that is found in the late 2022 MacBook Air and, MacBook Pro 13. It offers 8 cores divided in four performance cores and four power-efficiency cores. The big cores offer 192 KB instruction cache, 128 KB data cache, and 16 MB shared L2 cache (up from 12 MB). The four efficiency cores are a lot smaller and offer only 128 KB instruction cache, 64 KB data cache, and 4 MB shared cache. The efficiency cores (E cluster) clock with  up to 2,4 GHz, the performance cores (P cluster) with up to 3,5 GHz and therefore higher than the M1 cores. The architecture should be similar to the A15 (iPhone 13) with Avalanche and Blizzard cores.

The chip features a unified memory architecture for the CPU and GPU cores and supports up to 24 GB LPDDR5-6400 for a bandwidth of up to 100GB/s.

According to Apple, the M2 offers a 18% higher CPU performance at the same power consumption level compared to the Apple M1. In our tests, the MacBook Pro 13 with active cooling was able to reach the 18% in Geekbench Multi. In other benchmarks we measured 12 to 15% gains compared to the M1. Therefore, the performance is now near the M1 Pro with 8 cores. The passively cooled MacBook Air may however suffer from throttling in longer load scenarios.

The integrated graphics card in the M2 offers 8 or 10 cores and a peak performance of 3.6 TFLOPs.

Furthermore, the SoC integrates a fast 16 core neural engine with a peak performance of 16 TOPS (for AI hardware acceleration), a secure enclave (e.g., for encryption), Thunderbolt / USB 4 controller, an ISP, and media de- and encoders.

The Apple M2 includes 20 billion transistors (up from the 16 billion of the M1) and is manufactured in the second generation 5nm process at TSMC (most likely N5P). The power consumption is rated at 20W what we also measured under CPU load.

Apple M2 Pro 10-Core

► remove from comparison Apple M2 Pro 10-Core

The Apple M2 Pro 10-Core is a System on a Chip (SoC) from Apple that is found in the early 2023 MacBook Pro 14 and Mac Mini entry level models. It offers 10 of the 12 cores available in the chip divided in six performance cores (P-cores) and four power-efficiency cores (E-cores). The E-cores clock with up to 3.4 GHz, the P-Cores up to 3.7 GHz (mostly 3.3 GHz in multi-threaded workloads and 3.4 GHz in single threaded).

The big cores (codename Avalanche) offer 192 KB instruction cache, 128 KB data cache, and 36 MB shared L2 cache (up from 24 MB in the M1 Pro). The four efficiency cores (codename Blizzard) are a lot smaller and offer only 128 KB instruction cache, 64 KB data cache, and 4 MB shared cache. CPU and GPU can both use the 24 MB SLC (System Level Cache). 

The unified memory (16 or 32 GB LPDDR5-6400) next to the chip is connected by a 256 Bit memory controller (200 GB/s bandwidth) and can be used by the GPU and CPU.

The performance of the M2 Pro 10-Core should be similar to the old M1 Pro with all 10 cores. The multi-threaded performance should be slower, as the M2 10-core has two p-cores less (and 2 e-cores more) but the single-threaded performance should be better due to the faster clock speed and architectural improvements. The old M1 Pro 8-core should be noticeably slower.

The integrated graphics card in the M1 Pro 10-core offers all 16 of the 19 cores.

Furthermore, the SoC integrates a fast 16 core neural engine (faster than M1 Pro), a secure enclave (e.g., for encryption), a unified memory architecture, Thunderbolt 4 controller, an ISP, and media de- and encoders (including ProRes).

The M2 Pro is manufactured in 5 nm at TSMC (second generation) and integrates 40 billion transistors. 

ModelIntel Core i7-1365UApple M2Apple M2 Pro 10-Core
SeriesIntel Raptor Lake-UApple Apple M2Apple Apple M2
CodenameRaptor Lake-U
Series: Apple M2
Intel Core i7-1365U « 1.3 - 5.2 GHz10 / 12 cores12 MB L3
Intel Core i7-1355U1.2 - 5 GHz10 / 12 cores12 MB L3
Intel Core i5-1345U1.2 - 4.7 GHz10 / 12 cores12 MB L3
Intel Core i5-1335U0.9 - 4.6 GHz10 / 12 cores12 MB L3
Intel Core i5-1334U0.9 - 4.6 GHz10 / 12 cores12 MB L3
Intel Core i3-1315U0.9 - 4.5 GHz6 / 8 cores10 MB L3
Intel Core i3-1305U1.2 - 4.5 GHz5 / 6 cores10 MB L3
Intel Processor U3000.9 - 4.4 GHz5 / 6 cores8 MB L3
Apple M2 Max2.42 - 3.7 GHz12 / 12 cores48 MB L3
Apple M2 Pro2.42 - 3.5 GHz12 / 12 cores24 MB L3
Apple M2 Pro 10-Core2.42 - 3.7 GHz10 / 10 cores24 MB L3
Apple M2 « 2.42 - 3.48 GHz8 / 8 cores8 MB L3
Apple M2 Max2.42 - 3.7 GHz12 / 12 cores48 MB L3
Apple M2 Pro2.42 - 3.5 GHz12 / 12 cores24 MB L3
Apple M2 Pro 10-Core « 2.42 - 3.7 GHz10 / 10 cores24 MB L3
Apple M22.42 - 3.48 GHz8 / 8 cores8 MB L3
Clock1300 - 5200 MHz2424 - 3480 MHz2424 - 3696 MHz
L1 Cache928 KB2 MB7.3 MB
L2 Cache9.5 MB20 MB36 MB
L3 Cache12 MB8 MB24 MB
Cores / Threads10 / 128 / 810 / 10
TDP15 Watt20 Watt
Technology10 nm5 nm5 nm
max. Temp.100 °C
SocketBGA1700
FeaturesThread DirectorARMv8 Instruction SetARMv8 Instruction Set
iGPUIntel Iris Xe Graphics G7 96EUs ( - 1300 MHz)Apple M2 10-Core GPU ( - 1398 MHz)Apple M2 Pro 16-Core GPU
Architecturex86ARMARM
Announced
Manufacturerark.intel.comwww.apple.com
Transistors20000 Million40000 Million

Benchmarks

Performance Rating - CB R15 + R20 + 7-Zip + X265 + Blender + 3DM11 CPU - i7-1365U
41 pt (57%)
Cinebench 2024 - Cinebench 2024 CPU Single Core
100%
1 M2 +
121 Points (84%)
Cinebench 2024 - Cinebench 2024 CPU Multi Core
100%
1 M2 +
513 Points (10%)
Cinebench R23 - Cinebench R23 Multi Core
min: 7532     avg: 8750     median: 8946 (8%)     max: 9576 Points
97%
M2 +
min: 8517     avg: 8654     median: 8667 (8%)     max: 8772 Points
11811 Points (11%)
Cinebench R23 - Cinebench R23 Single Core
min: 1877     avg: 1886     median: 1887 (80%)     max: 1891 Points
84%
M2 +
min: 1580     avg: 1595     median: 1585 (67%)     max: 1638 Points
1643 Points (70%)
Cinebench R20 - Cinebench R20 CPU (Single Core)
min: 703     avg: 724     median: 726.5 (81%)     max: 741 Points
52%
M2 +
min: 216     avg: 370.8     median: 381 (42%)     max: 446 Points
449 Points (50%)
Cinebench R20 - Cinebench R20 CPU (Multi Core)
min: 2902     avg: 3391     median: 3495.5 (9%)     max: 3669 Points
66%
M2 +
min: 2231     avg: 2325     median: 2324 (6%)     max: 2416 Points
3235 Points (8%)
Cinebench R15 - Cinebench R15 CPU Multi 64 Bit
min: 1348     avg: 1471     median: 1466.5 (9%)     max: 1604 Points
83%
M2 +
min: 1209.9     avg: 1222     median: 1215 (8%)     max: 1243 Points
1664 Points (11%)
Cinebench R15 - Cinebench R15 CPU Single 64 Bit
min: 261     avg: 265     median: 265.5 (80%)     max: 268 Points
84%
M2 +
min: 222     avg: 223.8     median: 223 (67%)     max: 229 Points
231 Points (70%)
7-Zip 18.03 - 7-Zip 18.03 Multli Thread 4 runs
min: 33476     avg: 38339     median: 39727 (23%)     max: 40424 MIPS
7-Zip 18.03 - 7-Zip 18.03 Single Thread 4 runs
min: 5722     avg: 5841     median: 5850.5 (70%)     max: 5941 MIPS
HWBOT x265 Benchmark v2.2 - HWBOT x265 4k Preset
min: 8.61     avg: 9.6     median: 9.8 (17%)     max: 10.3 fps
Blender - Blender 3.3 Classroom CPU *
min: 660     avg: 727     median: 726.5 (9%)     max: 796 Seconds
102%
M2 +
min: 540     avg: 620     median: 619.5 (8%)     max: 702 Seconds
435 Seconds (6%)
Blender - Blender 2.79 BMW27 CPU *
min: 373     avg: 395.3     median: 383 (3%)     max: 430 Seconds
98%
M2 +
min: 549     avg: 614     median: 597 (4%)     max: 713 Seconds
415 Seconds (3%)
R Benchmark 2.5 - R Benchmark 2.5 *
min: 0.4504     avg: 0.5     median: 0.5 (10%)     max: 0.4586 sec
3DMark 11 - 3DM11 Performance Physics
min: 11465     avg: 12579     median: 12071.5 (33%)     max: 14708 Points
3DMark - 3DMark Cloud Gate Physics
10387 Points (26%)
3DMark - 3DMark Fire Strike Standard Physics
min: 15179     avg: 16981     median: 17182 (31%)     max: 18379 Points
3DMark - 3DMark Time Spy CPU
min: 5497     avg: 6435     median: 6438.5 (27%)     max: 7364 Points
Geekbench 6.2 - Geekbench 6.2 Single-Core
2583 Points (70%)
101%
1 M2 +
min: 2587     avg: 2609     median: 2599 (70%)     max: 2650 Points
Geekbench 6.2 - Geekbench 6.2 Multi-Core
9605 Points (38%)
105%
1 M2 +
min: 10034     avg: 10083     median: 10089 (40%)     max: 10120 Points
Geekbench 5.5 - Geekbench 5.1 - 5.4 64 Bit Single-Core
min: 1841     avg: 1884     median: 1878.5 (79%)     max: 1938 Points
102%
M2 +
min: 1887     avg: 1914     median: 1915.5 (81%)     max: 1953 Points
min: 1926     avg: 1937     median: 1936.5 (82%)     max: 1947 Points
Geekbench 5.5 - Geekbench 5.1 - 5.4 64 Bit Multi-Core
min: 8272     avg: 8565     median: 8605.5 (15%)     max: 8778 Points
104%
M2 +
min: 8491     avg: 8812     median: 8956 (16%)     max: 8994 Points
min: 12074     avg: 12132     median: 12131.5 (22%)     max: 12189 Points
Geekbench 5.0 - Geekbench 5.0 64 Bit Single-Core
min: 1797     avg: 1813     median: 1812.5 (8%)     max: 1828 Points
Geekbench 5.0 - Geekbench 5.0 64 Bit Multi-Core
min: 8334     avg: 8500     median: 8500 (27%)     max: 8666 Points
Mozilla Kraken 1.1 - Kraken 1.1 Total Score *
min: 487     avg: 493.5     median: 494 (1%)     max: 499 ms
100%
M2 +
min: 440     avg: 450.1     median: 449.2 (1%)     max: 466.8 ms
447.4 ms (1%)
Octane V2 - Octane V2 Total Score
93596 Points (82%)
80%
M2 +
min: 72484     avg: 75019     median: 74878 (66%)     max: 78736 Points
75471 Points (66%)
WebXPRT 4 - WebXPRT 4 Score
min: 261     avg: 263     median: 262.5 (75%)     max: 266 Points
90%
M2 +
min: 223     avg: 237.8     median: 235 (68%)     max: 256 Points
250 Points (72%)
WebXPRT 3 - WebXPRT 3 Score
min: 290     avg: 298.8     median: 300 (63%)     max: 305 Points
125%
M2 +
min: 342     avg: 366.5     median: 376 (78%)     max: 387 Points
391 Points (81%)
Antutu v9 - AnTuTu v9 Total Score
100%
1 M2 +
min: 1257990     avg: 1337360     median: 1337360 (81%)     max: 1416730 Points
Antutu v9 - AnTuTu v9 CPU
100%
1 M2 +
min: 294643     avg: 298254     median: 298254 (82%)     max: 301865 Points
CrossMark - CrossMark Overall
min: 1605     avg: 1638     median: 1636 (63%)     max: 1675 Points
92%
M2 +
min: 1437     avg: 1515     median: 1507 (58%)     max: 1585 Points
1772 Points (68%)
Power Consumption - Prime95 Power Consumption - external Monitor *
min: 35.5     avg: 41.3     median: 41.3 (7%)     max: 47.1 Watt
Power Consumption - Cinebench R15 Multi Power Consumption - external Monitor *
min: 46.9     avg: 53.6     median: 53.5 (10%)     max: 60.6 Watt
105%
1 M2 +
29 Watt (5%)
Power Consumption - Geekbench 5.5 Power Consumption 150cd *
100%
1 M2 +
min: 6.86     avg: 8.3     median: 8.4 (4%)     max: 9.71 Watt
Power Consumption - Idle Power Consumption - external Monitor *
min: 4.69     avg: 6.5     median: 6.1 (4%)     max: 9.22 Watt
103%
1 M2 +
min: 2.03     avg: 2.6     median: 2.4 (2%)     max: 3.98 Watt
2.2 Watt (1%)
Power Consumption - Idle Power Consumption 150cd 1min *
min: 3.84     avg: 5.3     median: 5.5 (6%)     max: 6.47 Watt
102%
1 M2 +
min: 1.631     avg: 3.5     median: 3.6 (4%)     max: 5.32 Watt
5.2 Watt (6%)
Power Consumption - Cinebench R15 Multi Power Efficiency - external Monitor
min: 25.8     avg: 27.6     median: 26.5 (20%)     max: 30.5 Points per Watt
160%
1 M2 +
42.4 Points per Watt (32%)

Average Benchmarks Intel Core i7-1365U → 100% n=15

Average Benchmarks Apple M2 → 91% n=15

Average Benchmarks Apple M2 Pro 10-Core → 102% n=15

- Range of benchmark values for this graphics card
- Average benchmark values for this graphics card
* Smaller numbers mean a higher performance
1 This benchmark is not used for the average calculation

v1.28
log 01. 22:30:30

#0 checking url part for id 14914 +0s ... 0s

#1 checking url part for id 14521 +0s ... 0s

#2 checking url part for id 14977 +0s ... 0s

#3 redirected to Ajax server, took 1719865830 +0s ... 0s

#4 did not recreate cache, as it is less than 5 days old! Created at Mon, 01 Jul 2024 05:15:43 +0200 +0s ... 0s

#5 composed specs +0.007s ... 0.008s

#6 did output specs +0s ... 0.008s

#7 getting avg benchmarks for device 14914 +0.004s ... 0.012s

#8 got single benchmarks 14914 +0.008s ... 0.02s

#9 getting avg benchmarks for device 14521 +0.001s ... 0.02s

#10 got single benchmarks 14521 +0.008s ... 0.029s

#11 getting avg benchmarks for device 14977 +0.001s ... 0.029s

#12 got single benchmarks 14977 +0.003s ... 0.033s

#13 got avg benchmarks for devices +0s ... 0.033s

#14 min, max, avg, median took s +0.032s ... 0.064s

#15 return log +0s ... 0.064s

Please share our article, every link counts!
> Expert Reviews and News on Laptops, Smartphones and Tech Innovations > Benchmarks / Tech > Processor Comparison - Head 2 Head
Redaktion, 2017-09- 8 (Update: 2023-07- 1)