Notebookcheck Logo

Intel Core i7-12700K vs newitem vs UNISOC Tiger T310

Intel Core i7-12700K

► remove from comparison Intel i7-12700K

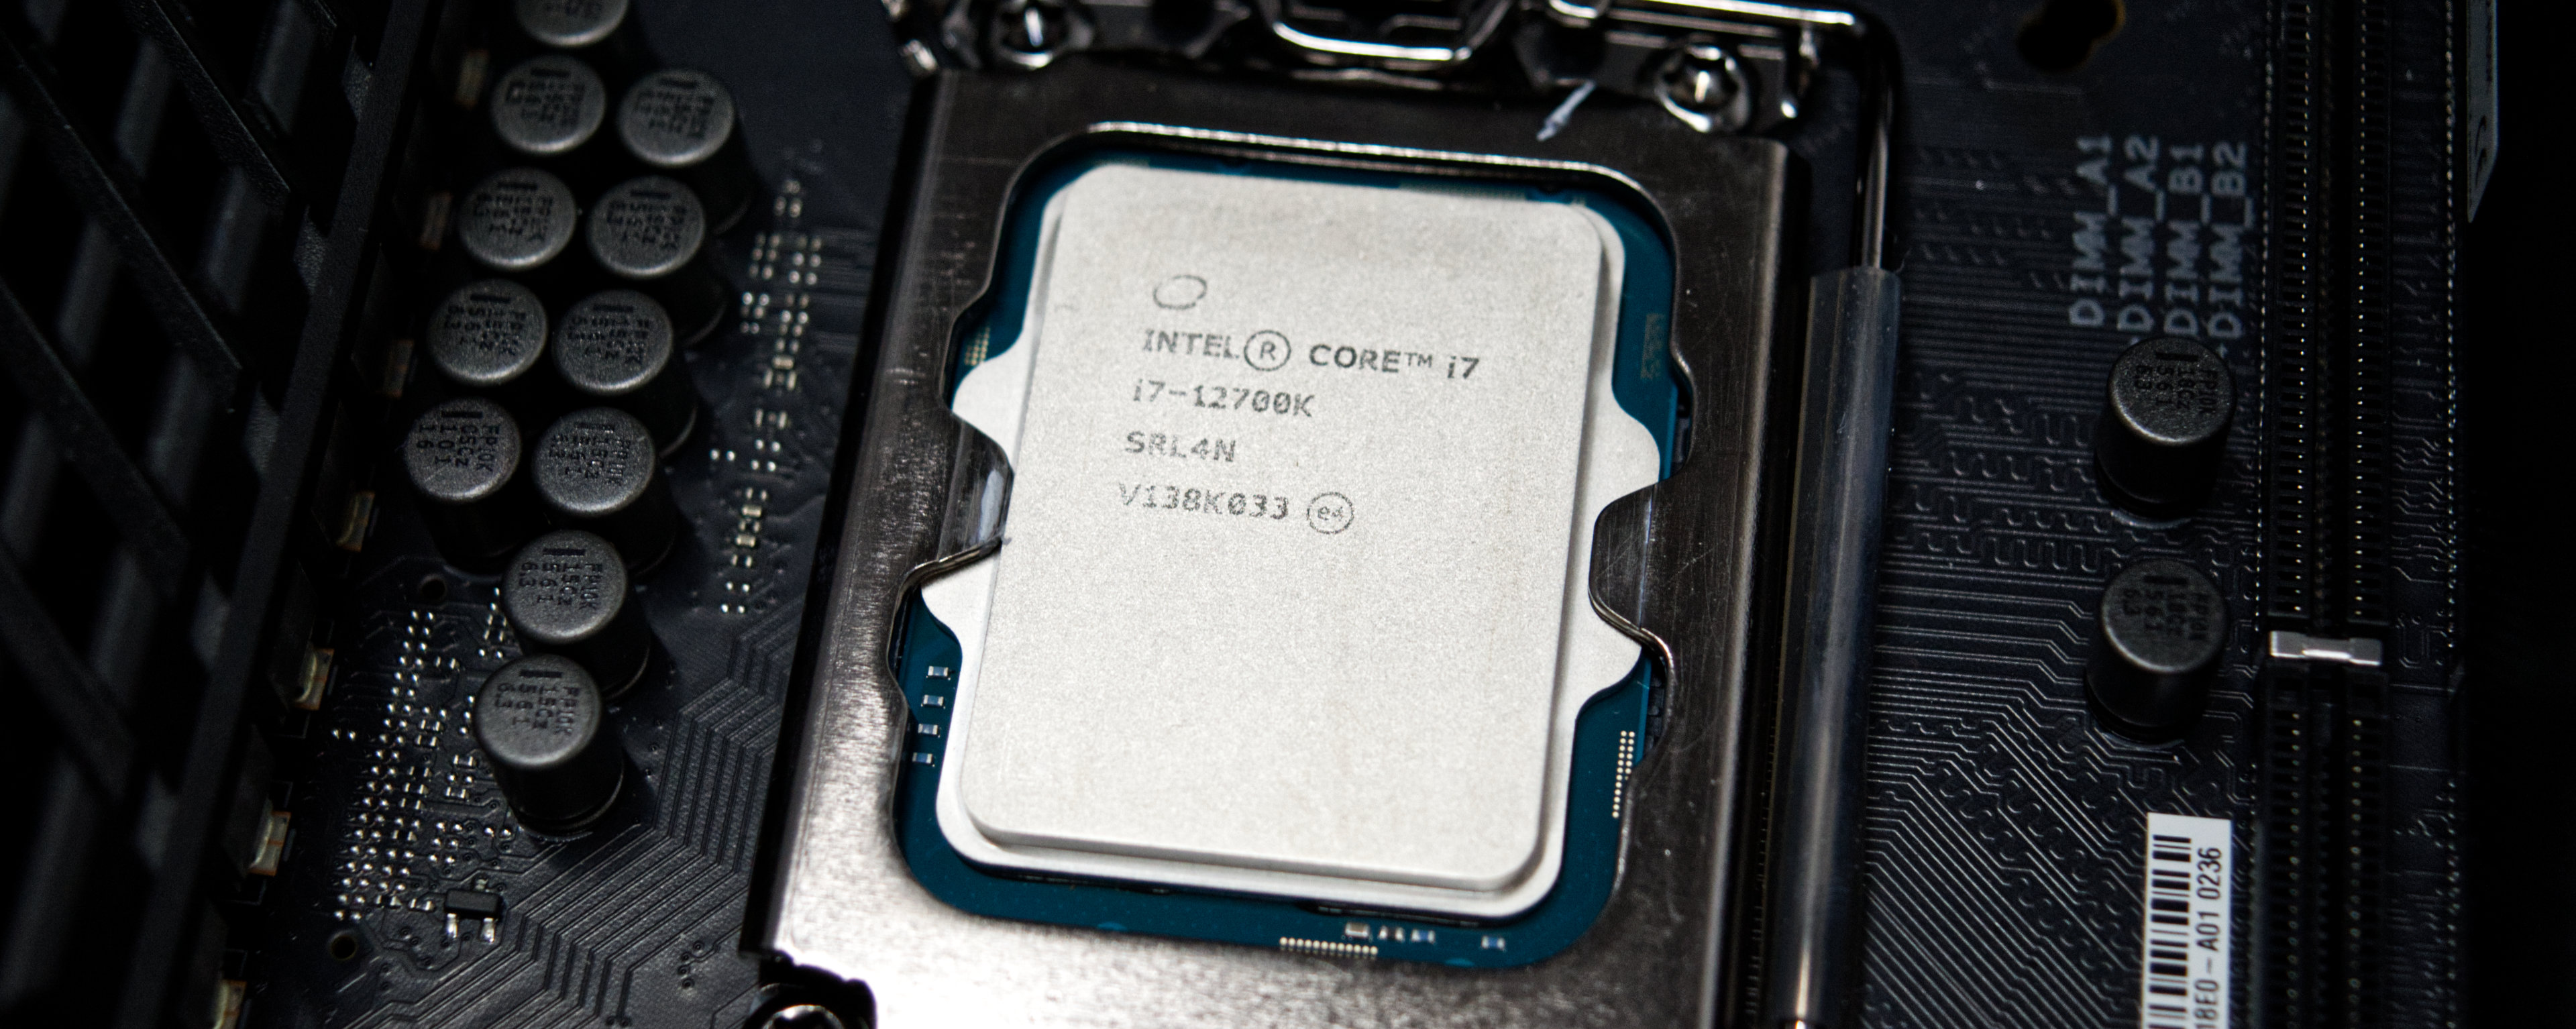
The Intel Core i7-12700K is a high end CPU for desktops based on the Alder Lake architecture. It was first announced in November 2021 and offers 8 performance cores and 4 efficiency cores. The performance cores (P-cores) support HyperThreading, leading to 20 Threads that can be processed at once. The performance cores can clock with up to 5 GHz (Turbo Boost Max 3.0), the efficiency cores can clock with up to 3.9 GHz. All cores can use 25 MB Smart Cache. The integrated memory controller supports up to 128 GB DDR5 with 4800 MT/s (dual channel).

Thread Director (in hardware) can support the operating system to decide which thread to use on the performance or efficiency cores for the best performance.

The integrated graphics adapter is based on the Xe-architecture and called Intel UHD Graphics 770. It clocks between 300 and 1.5 GHz.

For AI tasks, the CPU also integrates GNA 3.0 and DL Boost. Quick Sync in version 8 is the same as in the Rocket Lake CPUs and supports MPEG-2, AVC, VC-1 decode, JPEG, VP8 decode, VP9, HEVC and AV1 decode in hardware.

Performance

The average 12700K in our database is way ahead of the Ryzen 7 5800X and the Ryzen 9 3900X, as far as multi-thread benchmark scores are concerned. Which is a very, very impressive result, as of late 2022.

Power consumption

This Core i7 series chip has a Base power consumption of 125 W, with its highest Intel-recommended Turbo power consumption sitting at 190 W. It might be a good idea to get an AIO cooling solution for a chip this power hungry.

The i7-12700K is manufactured on Intel's fourth-generation 10 nm process marketed as Intel 7 for lower-than-average, as of early 2023, energy efficiency.

UNISOC Tiger T310

► remove from comparison  T310

The Unisoc Tiger T310 is a SoC for smartphones and tablets of the entry level. It was first announced in mid 2019 and integrates four CPU cores (quad core). One big Cortex-A75 core clocked at up to 2 GHz and three small A55 cores with up to 1.8 GHz.

Furthermore, the chip integrates an LTE modem (Cat 7, TDD-LTE, FDD-LTE, TDSCDMA, WCDMA, CDMA, GSM), Bluetooth 5.0 and WiFi b/g/n/ac. The integrated ISP supports up to two cameras (16 MPixel and 8 Mpixel, maximum 30 fps video capture) and the GNSS can use all current standards (GPS, Glonass, Beidou, Galileo).

The memory controller is able to drive LPDDR3 at 933 MHz and faster LPDDR4x at 1333 MHz.

The PowerVR GE8300 iGPU is from Imagination and clocked at up to 800 MHz.

The chip is produced in 12nm at TSMC and should offer a rather good power efficiency (for 2019).

ModelIntel Core i7-12700KnewitemUNISOC Tiger T310
SeriesIntel Alder Lake-S
CodenameAlder Lake
Series:
Intel Core i9-12900K3.2 - 5.2 GHz16 / 24 cores30 MB L3
Intel Core i9-129002.4 - 5.1 GHz16 / 24 cores20 MB L3
Intel Core i7-12700K « 2.7 - 5 GHz12 / 20 cores25 MB L3
Intel Core i7-12700F3.3 - 4.9 GHz12 / 20 cores25 MB L3
Intel Core i7-127003.3 - 4.9 GHz12 / 20 cores25 MB L3
Intel Core i5-12600K2.8 - 4.9 GHz10 / 16 cores20 MB L3
newitem «  cores
HiSilicon Kirin 9000W1.53 - 2.49 GHz12 / 12 cores
UNISOC Tiger T3101.8 - 2 GHz4 / 4 cores
Rockchip RK32881.8 GHz4 / 4 cores
Apple A6x1.4 GHzcores
Apple A61 GHzcores
Apple S52 / 2 cores
HiSilicon k3v2 Hi36201.2 GHz4 / 4 cores
Rockchip RK3066 1.5 GHz1.5 GHz2 / 2 cores
Amlogic AML8726-MX1.5 GHz2 / 2 cores
Rockchip RK31681.2 GHz2 / 2 cores
Rockchip RK2918 1.2 GHz1.2 GHz1 / 1 cores
ARM Cortex A8 1.2 GHz1.2 GHz1 / 1 cores
Telechips TCC8803 1GHz1 GHz1 / 1 cores
Loongson 2F 900MHz0.9 GHz1 / 1 cores
CSR86700.08 GHzcores
ARM Cortex-M4 cores
HiSilicon Hi6262 cores
DK3.5+STcores
unknown cores
newitem cores
HiSilicon Kirin 9000W1.53 - 2.49 GHz12 / 12 cores
UNISOC Tiger T310 « 1.8 - 2 GHz4 / 4 cores
Rockchip RK32881.8 GHz4 / 4 cores
Apple A6x1.4 GHzcores
Apple A61 GHzcores
Apple S52 / 2 cores
HiSilicon k3v2 Hi36201.2 GHz4 / 4 cores
Rockchip RK3066 1.5 GHz1.5 GHz2 / 2 cores
Amlogic AML8726-MX1.5 GHz2 / 2 cores
Rockchip RK31681.2 GHz2 / 2 cores
Rockchip RK2918 1.2 GHz1.2 GHz1 / 1 cores
ARM Cortex A8 1.2 GHz1.2 GHz1 / 1 cores
Telechips TCC8803 1GHz1 GHz1 / 1 cores
Loongson 2F 900MHz0.9 GHz1 / 1 cores
CSR86700.08 GHzcores
ARM Cortex-M4 cores
HiSilicon Hi6262 cores
DK3.5+STcores
unknown cores
Clock2700 - 5000 MHz1800 - 2000 MHz
L2 Cache12 MB
L3 Cache25 MB
Cores / Threads12 / 204 / 4
TDP125 Watt
Technology10 nm12 nm
max. Temp.100 °C
SocketLGA1700
FeaturesDDR4-3200/DDR5-4800 RAM, PCIe 5, Thr. Dir., DL Boost, GNA, vPro Enterp., MMX, SSE, SSE2, SSE3, SSSE3, SSE4.1, SSE4.2, AVX, AVX2, BMI2, ABM, FMA, ADX, SMEP, SMAP, EIST, TM1, TM2, HT, Turbo, SST, AES-NI, RDRAND, RDSEED, SHALTE Cat.7, BT 5.0, WiFi ac, GNSS, eMMC 5.1, LPDDR3 933, LPDDR4x 1333 MHz
iGPUIntel UHD Graphics 770 (300 - 1500 MHz)PowerVR GE8300 ( - 800 MHz)
Architecturex86ARM
$409 U.S.
Announced
Manufacturerark.intel.comwww.unisoc.com

Benchmarks

Performance Rating - CB R15 + R20 + 7-Zip + X265 + Blender + 3DM11 CPU - i7-12700K
46.7 pt (65%)
Cinebench R23 - Cinebench R23 Multi Core
min: 17003     avg: 19784     median: 19784 (18%)     max: 22565 Points
Cinebench R23 - Cinebench R23 Single Core
min: 1806     avg: 1851     median: 1850.5 (79%)     max: 1895 Points
Cinebench R20 - Cinebench R20 CPU (Single Core)
min: 731     avg: 736     median: 735.5 (82%)     max: 740 Points
Cinebench R20 - Cinebench R20 CPU (Multi Core)
min: 6953     avg: 7801     median: 7800.5 (19%)     max: 8648 Points
Cinebench R15 - Cinebench R15 CPU Multi 64 Bit
3325 Points (21%)
Cinebench R15 - Cinebench R15 CPU Single 64 Bit
272 Points (82%)
Cinebench R11.5 - Cinebench R11.5 CPU Multi 64 Bit
38.4 Points (50%)
Cinebench R11.5 - Cinebench R11.5 CPU Single 64 Bit
3.3 Points (82%)
Cinebench R10 - Cinebench R10 Rend. Single (32bit)
9305 Points (56%)
Cinebench R10 - Cinebench R10 Rend. Multi (32bit)
63484 Points (46%)
Cinebench R10 - Cinebench R10 Rend. Multi (64bit)
102539 Points (71%)
Cinebench R10 - Cinebench R10 Rend. Single (64bit)
15179 Points (18%)
wPrime 2.10 - wPrime 2.0 1024m *
171.2 s (2%)
wPrime 2.10 - wPrime 2.0 32m *
2.7 s (1%)
WinRAR - WinRAR 4.0
10389 Points (16%)
7-Zip 18.03 - 7-Zip 18.03 Multli Thread 4 runs
min: 65508     avg: 73439     median: 73438.5 (42%)     max: 81369 MIPS
7-Zip 18.03 - 7-Zip 18.03 Single Thread 4 runs
min: 6117     avg: 6270     median: 6269.5 (75%)     max: 6422 MIPS
X264 HD Benchmark 4.0 - x264 Pass 2
179 fps (62%)
X264 HD Benchmark 4.0 - x264 Pass 1
349.5 fps (81%)
HWBOT x265 Benchmark v2.2 - HWBOT x265 4k Preset
min: 14.9     avg: 20.5     median: 20.5 (36%)     max: 26.1 fps
TrueCrypt - TrueCrypt Serpent
1.6 GB/s (0%)
TrueCrypt - TrueCrypt Twofish
2.8 GB/s (48%)
TrueCrypt - TrueCrypt AES
15.7 GB/s (41%)
Blender - Blender 2.79 BMW27 CPU *
min: 152.3     avg: 173.1     median: 173.1 (1%)     max: 193.9 Seconds
R Benchmark 2.5 - R Benchmark 2.5 *
min: 0.412     avg: 0.4     median: 0.4 (9%)     max: 0.423 sec
3DMark 06 - CPU - 3DMark 06 - CPU
16827 Points (36%)
Super Pi mod 1.5 XS 1M - Super Pi mod 1.5 XS 1M *
7.3 s (2%)
Super Pi mod 1.5 XS 2M - Super Pi mod 1.5 XS 2M *
16.6 s (1%)
Super Pi Mod 1.5 XS 32M - Super Pi mod 1.5 XS 32M *
387 s (2%)
3DMark Vantage - 3DM Vant. Perf. CPU no Physx
93250 Points (82%)
3DMark 11 - 3DM11 Performance Physics
min: 23129     avg: 24947     median: 24947 (67%)     max: 26765 Points
3DMark - 3DMark Ice Storm Physics
109742 Points (89%)
3DMark - 3DMark Ice Storm Extreme Physics
112268 Points (91%)
3DMark - 3DMark Ice Storm Unlimited Physics
109389 Points (92%)
3DMark - 3DMark Cloud Gate Physics
min: 21804     avg: 23017     median: 23017 (58%)     max: 24230 Points
3DMark - 3DMark Fire Strike Standard Physics
min: 31240     avg: 34160     median: 34159.5 (61%)     max: 37079 Points
3DMark - 3DMark Time Spy CPU
min: 13915     avg: 15550     median: 15550 (66%)     max: 17185 Points
3DMark - 3DMark Sling Shot Extreme (ES 3.1) Unlimited Physics
100%
1 T310 +
1588 Points (19%)
3DMark - 3DMark Sling Shot (ES 3.0) Unlimited Physics
100%
1 T310 +
1590 Points (18%)
Geekbench 5.5 - Geekbench 5.1 - 5.4 64 Bit Single-Core
min: 1890     avg: 1912     median: 1911.5 (81%)     max: 1933 Points
20%
1 T310 +
376 Points (16%)
Geekbench 5.5 - Geekbench 5.1 - 5.4 64 Bit Multi-Core
min: 12475     avg: 14016     median: 14016 (25%)     max: 15557 Points
5%
1 T310 +
756 Points (1%)
Geekbench 5.0 - Geekbench 5.0 64 Bit Single-Core
min: 1835     avg: 1841     median: 1840.5 (8%)     max: 1846 Points
Geekbench 5.0 - Geekbench 5.0 64 Bit Multi-Core
min: 12318     avg: 13879     median: 13879 (44%)     max: 15440 Points
Geekbench 4.4 - Geekbench 4.1 - 4.4 64 Bit Single-Core
8133 Points (81%)
21%
1 T310 +
1687 Points (17%)
Geekbench 4.4 - Geekbench 4.1 - 4.4 64 Bit Multi-Core
55786 Points (61%)
5%
1 T310 +
2969 Points (3%)
Geekbench 3 - Geekbench 3 64 Bit Multi-Core
100%
1 T310 +
2987 Points (5%)
Geekbench 3 - Geekbench 3 64 Bit Single-Core
100%
1 T310 +
1656 Points (25%)
Mozilla Kraken 1.1 - Kraken 1.1 Total Score *
min: 496     avg: 498     median: 498 (1%)     max: 500 ms
97%
1 T310 +
3239 ms (4%)
Octane V2 - Octane V2 Total Score
100%
1 T310 +
11986 Points (11%)
WebXPRT 4 - WebXPRT 4 Score
100%
1 T310 +
45 Points (13%)
WebXPRT 3 - WebXPRT 3 Score
min: 301     avg: 303.5     median: 303.5 (63%)     max: 306 Points
21%
1 T310 +
63 Points (13%)
Antutu v9 - AnTuTu v9 Total Score
100%
1 T310 +
162595 Points (10%)
Antutu v9 - AnTuTu v9 CPU
100%
1 T310 +
57138 Points (16%)
PassMark PerformanceTest Mobile V1 - PerformanceTest Mobile V1 CPU Tests
100%
1 T310 +
1653 Points (0%)
PCMark for Android - PCM f. Android Storage 2.0 score
100%
1 T310 +
9900 Points (16%)
PCMark for Android - PCM f. Android Work Score 3.0
100%
1 T310 +
6866 Points (32%)
CrossMark - CrossMark Overall
1999 Points (77%)
Power Consumption - Prime95 Power Consumption - external Monitor *
min: 132.1     avg: 206.6     median: 206.6 (36%)     max: 281 Watt
Power Consumption - Cinebench R15 Multi Power Consumption - external Monitor *
278.2 Watt (51%)
Power Consumption - Geekbench 5.5 Power Consumption 150cd *
100%
1 T310 +
3.7 Watt (2%)
Power Consumption - Idle Power Consumption 150cd 1min *
100%
1 T310 +
1.6 Watt (2%)
Power Consumption - Cinebench R15 Multi Power Efficiency - external Monitor
12 Points per Watt (9%)

Average Benchmarks Intel Core i7-12700K → 0% n=

Average Benchmarks UNISOC Tiger T310 → 0% n=

- Range of benchmark values for this graphics card
- Average benchmark values for this graphics card
* Smaller numbers mean a higher performance
1 This benchmark is not used for the average calculation

v1.28
log 02. 08:50:51

#0 checking url part for id 14033 +0s ... 0s

#1 checking url part for id 17594 +0s ... 0s

#2 checking url part for id 14530 +0s ... 0s

#3 redirected to Ajax server, took 1719903044 +0s ... 0s

#4 did not recreate cache, as it is less than 5 days old! Created at Mon, 01 Jul 2024 05:15:43 +0200 +0s ... 0s

#5 composed specs +0.004s ... 0.004s

#6 did output specs +0s ... 0.004s

#7 getting avg benchmarks for device 14033 +0.004s ... 0.008s

#8 got single benchmarks 14033 +0.005s ... 0.014s

#9 getting avg benchmarks for device 17594 +0s ... 0.014s

#10 got single benchmarks 17594 +0s ... 0.014s

#11 getting avg benchmarks for device 14530 +0.001s ... 0.015s

#12 got single benchmarks 14530 +0.004s ... 0.018s

#13 got avg benchmarks for devices +0s ... 0.018s

#14 min, max, avg, median took s +0.037s ... 0.055s

#15 return log +0s ... 0.055s

Please share our article, every link counts!
> Expert Reviews and News on Laptops, Smartphones and Tech Innovations > Benchmarks / Tech > Processor Comparison - Head 2 Head
Redaktion, 2017-09- 8 (Update: 2023-07- 1)