Notebookcheck Logo

Intel Core i7-11700K vs Intel Core i3-N300 vs Intel Core i5-11400F

Intel Core i7-11700K

► remove from comparison Intel i7-11700K

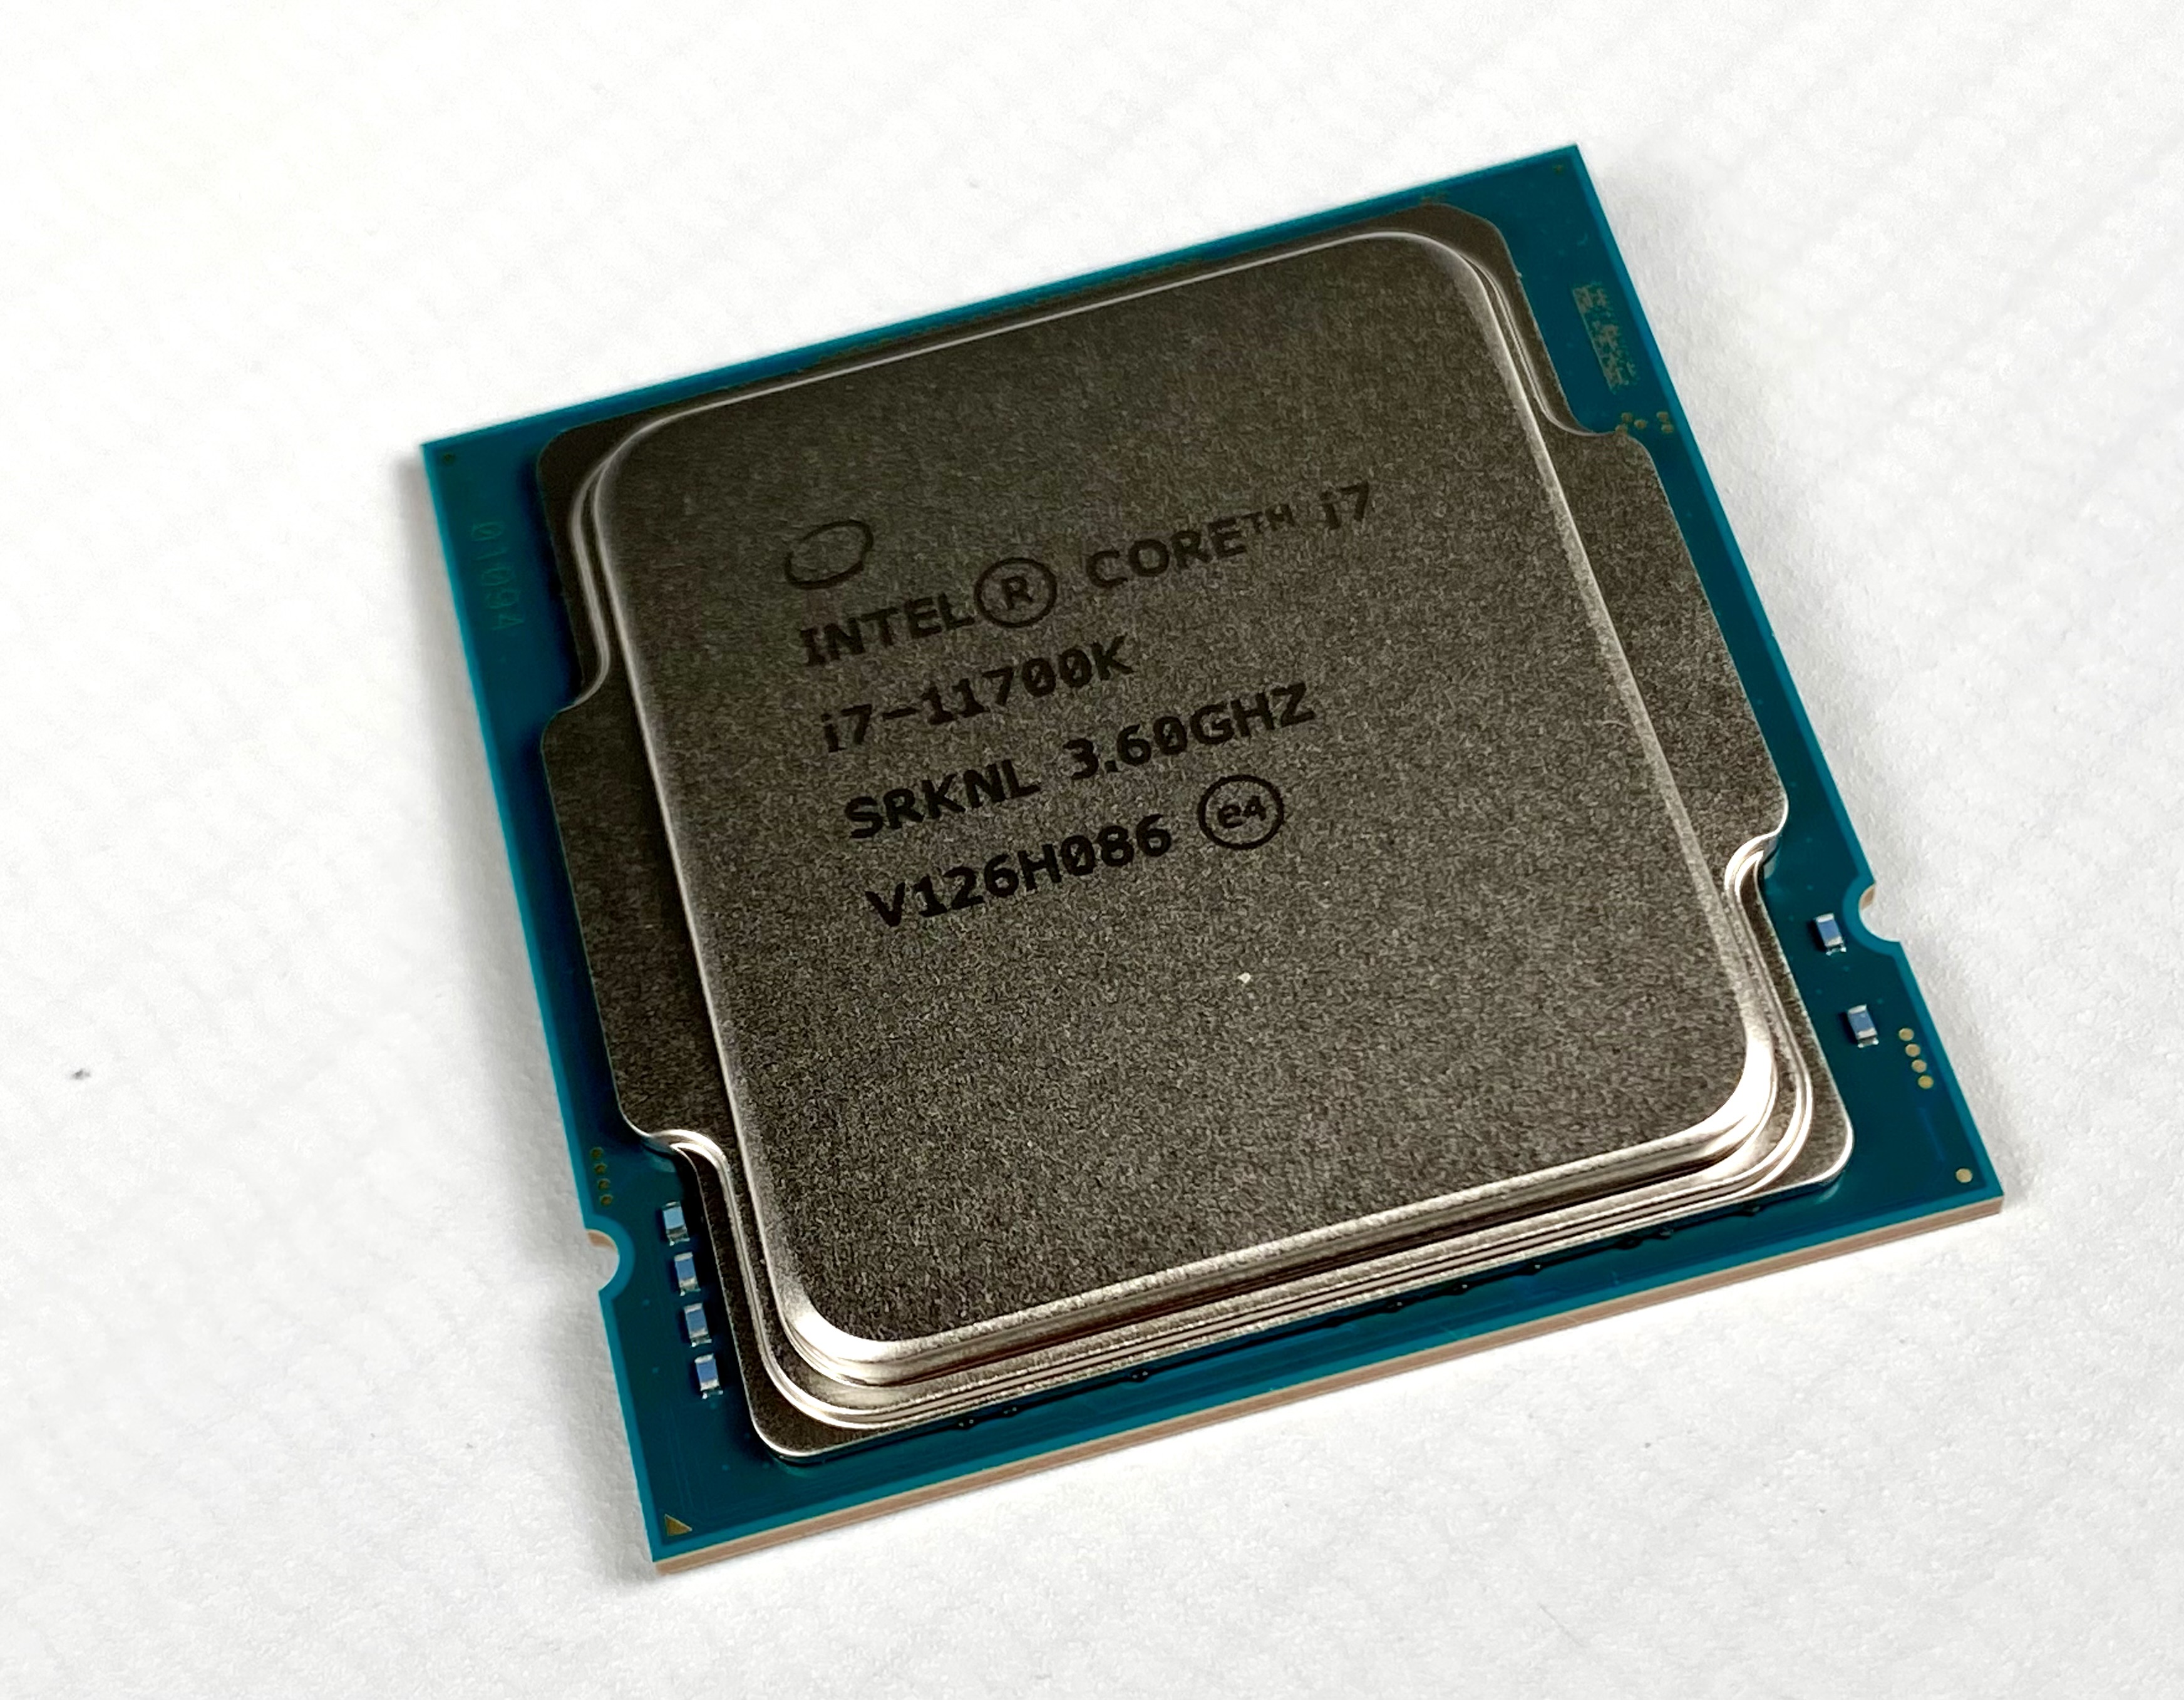
The Intel Core i7-11700K is a high-end desktop CPU based on the Rocket Lake architecture. The CPU offers 8 cores and 16 threads clocked at 3.6 - 4.9 GHz. The TDP is rated at 125 Watt (PL1, power limit sustained load) but the PL2 is set to around 250 Watt for short term boosts (up to 56 seconds). 

The Sunny Cove processor cores (known from the Ice Lake mobile CPUs) offer larger caches and an improved IPC (up to 19%). Furthermore, the chip also includes (partly) integrated WiFi 6E and Thunderbolt 4. The platform supports PCIe 4.0 and Intel DL Boost for AI acceleration.

The faster Rocket Lake-S CPUs also integrate a new Intel UHD Graphics 750 that is based on the current Intel Xe architecture (e.g. mobile Tiger Lake).

The CPU is manufactured on an old 14 nm process like the Comet Lake predecessors.

Intel Core i3-N300

► remove from comparison Intel i3-N300

The Intel Core i3-N305 is an entry-level mobile CPU for thin and light laptops from the Alder Lake-N series. It was announced in early 2023 and offers no performance cores and 8 efficient cores (E-cores, Gracemont architecture). The chip does not support HyperThreading and clocks with up to 3.8 GHz (single core, 3 GHz all core Turbo). The performance of the E-cores should be similar to old Skylake cores (compare to the Core i7-6700HQ). All cores can use up to 6 MB L3-cache. 

Performance

The performance depends on the cooling and TDP settings and should be somewhere similar to the old  Alder Lake Pentium 8500 (1 performance core, 4 efficiency cores, max. 4.4 GHz and 8 MB L3-cache). The multi-threaded performance should be quite good with the 8 cores but will suffer due to the low TDP. Single thread performance will suffer due to the missing P-cores and relatively low boost clock speeds.

Features

The Alder Lake-N chips only support single channel memory with up to DDR5-4800, DDR4-3200 or LPDDR5-4800. The chip also supports Quick Sync and AV1 decoding (most likely same engine as in Alder Lake). Furthermore, Wi-Fi 6E and Bluetooth 5.2 are partly integrated (but no Thunderbolt). External chips can be connected via PCIe Gen3 x9 (via the PCH).

The integrated graphics adapter is based on the Xe-architecture and offersall 32 EUs (Execution Units) operating at up to 1.25 GHz. In addition to the single channel memory, the gaming performance is very limited of the iGPU.

Power consumption

The i3 has a base power consumption of 7 W and is therefore even suited for fanless cooling. The CPU is built with a further improved 10nm SuperFin process at Intel (called Intel 7).

Intel Core i5-11400F

► remove from comparison Intel i5-11400F

The Intel Core i5-11400F is a fast six-core desktop processor based on the new Rocket Lake architecture, which was introduced in March 2021. The processor clocks with a base clock of 2.6 GHz and reaches an all-core boost of 4.2 GHz under load. In single-thread applications, the Intel Core i5-11400F even reaches up to 4.4 GHz. Intel also gives the Rocket Lake processors the Hyperthreading feature, which allows the i5-11400F to process up to 12 threads simultaneously. As known, the Intel Core i5-11400F is manufactured in the 14 nm process. Nevertheless, many changes have been made with the Rocket Lake architecture, which is also reflected in the performance compared to the Comet Lake. The Intel Core i5-11400F is a non-K CPU, which means that there is no freely selectable multiplier. Thus, the scope for overclocking is relatively small.

Performance

Compared to the Intel Core i5-10400F, the Core i5-11400F offers a significantly better IPC. This can be seen clearly in the single-core benchmarks. But the multi-core performance also benefits from the better IPC compared to Comet-Lake. A performance increase of up to 20 percent can be expected. The Core i5 has to do without the TVB (Thermal Velocity Boost). However, 4.2 GHz is still possible when all cores are loaded. Due to the very high single-thread performance, the Intel Core i5-11400F is best suited for video games.

Graphics

The processors marked with "F" in the nomenclature don't offer an integrated graphics unit. All other non-F processors can fall back on the Intel UHD Graphics 750 and also allow operation without a dedicated graphics card.

Power consumption

The TDP turns out relatively low with 65 watts. This is the PL1 value. For Turbo, the Intel Core i5-11400F offers a higher TDP of up to 154 watts with PL2. However, this may only be applied for a maximum of 28 seconds (dew). A good air cooler should be able to handle the resulting waste heat, so no AiO is necessary for this processor.

ModelIntel Core i7-11700KIntel Core i3-N300Intel Core i5-11400F
SeriesIntel Rocket LakeIntel Alder Lake-NIntel Rocket Lake
CodenameRocket LakeAlder Lake-NRocket Lake
Series: Rocket Lake Rocket Lake
Intel Core i9-11900K3.5 - 5.3 GHz8 / 16 cores16 MB L3
Intel Core i7-11700K « 3.6 - 5 GHz8 / 16 cores16 MB L3
Intel Core i7-117002.5 - 4.9 GHz8 / 16 cores16 MB L3
Intel Core i5-11600K3.9 - 4.9 GHz6 / 12 cores12 MB L3
Intel Core i5-11400F2.6 - 4.4 GHz6 / 12 cores12 MB L3
Intel Core i5-11400T1.3 - 3.7 GHz6 / 12 cores12 MB L3
Intel Core i3-N3051.8 - 3.8 GHz8 / 8 cores6 MB L3
Intel Core i3-N300 « - 3.8 GHz8 / 8 cores6 MB L3
Intel Processor N2001 - 3.7 GHz4 / 4 cores6 MB L3
Intel Processor N97 - 3.6 GHz4 / 4 cores6 MB L3
Intel Processor N95 - 3.4 GHz4 / 4 cores6 MB L3
Intel Processor N1001 - 3.4 GHz4 / 4 cores6 MB L3
Intel Processor N501 - 3.4 GHz2 / 2 cores6 MB L3
Intel Core i9-11900K3.5 - 5.3 GHz8 / 16 cores16 MB L3
Intel Core i7-11700K3.6 - 5 GHz8 / 16 cores16 MB L3
Intel Core i7-117002.5 - 4.9 GHz8 / 16 cores16 MB L3
Intel Core i5-11600K3.9 - 4.9 GHz6 / 12 cores12 MB L3
Intel Core i5-11400F « 2.6 - 4.4 GHz6 / 12 cores12 MB L3
Intel Core i5-11400T1.3 - 3.7 GHz6 / 12 cores12 MB L3
Clock3600 - 5000 MHz <=3800 MHz2600 - 4400 MHz
L1 Cache640 KB480 KB
L2 Cache4 MB3 MB
L3 Cache16 MB6 MB12 MB
Cores / Threads8 / 168 / 8
8 x 3.8 GHz Intel Crestmont E-Core
6 / 12
TDP125 Watt7 Watt65 Watt
Technology14 nm10 nm14 nm
max. Temp.100 °C105 °C100 °C
SocketLGA1200LGA1200
FeaturesDDR4-3200 RAM, PCIe 4, 8 GT/s bus, DL Boost, GNA, vPro, MMX, SSE, SSE2, SSE3, SSSE3, SSE4.1, SSE4.2, AVX, AVX2, AVX-512, BMI2, ABM, FMA, ADX, VMX, SMX, SMEP, SMAP, MPX, EIST, TM1, TM2, HT, Turbo, SST, AES-NI, RDRAND, RDSEED, SHADDR4-3200 RAM, PCIe 4, 8 GT/s bus, DL Boost, GNA, MMX, SSE, SSE2, SSE3, SSSE3, SSE4.1, SSE4.2, AVX, AVX2, AVX-512, BMI2, ABM, FMA, ADX, VMX, SMEP, SMAP, MPX, EIST, TM1, TM2, HT, Turbo, SST, AES-NI, RDRAND, RDSEED, SHA
iGPUIntel UHD Graphics Xe 750 32EUs (Rocket Lake) (350 - 1300 MHz)Intel UHD Graphics Xe 750 32EUs (Rocket Lake) ( - 1250 MHz)
Architecturex86x86x86
Announced
Manufacturerark.intel.comark.intel.comark.intel.com
Die Size276 mm2
$157 U.S.

Benchmarks

Performance Rating - CB R15 + R20 + 7-Zip + X265 + Blender + 3DM11 CPU - i7-11700K
41.2 pt (57%)
Performance Rating - CB R15 + R20 + 7-Zip + X265 + Blender + 3DM11 CPU - i3-N300
20 pt (28%)
Performance Rating - CB R15 + R20 + 7-Zip + X265 + Blender + 3DM11 CPU - i5-11400F
36.2 pt (50%)
Cinebench 2024 - Cinebench 2024 CPU Single Core
100%
1 i3-N300 +
34 Points (24%)
Cinebench 2024 - Cinebench 2024 CPU Multi Core
100%
1 i3-N300 +
165 Points (3%)
Cinebench R23 - Cinebench R23 Multi Core
14281 Points (13%)
2546 Points (2%)
10235 Points (10%)
Cinebench R23 - Cinebench R23 Single Core
1558 Points (66%)
513 Points (22%)
1339 Points (57%)
Cinebench R20 - Cinebench R20 CPU (Single Core)
min: 580     avg: 588     median: 588 (65%)     max: 596 Points
195 Points (22%)
502 Points (56%)
Cinebench R20 - Cinebench R20 CPU (Multi Core)
min: 5082     avg: 5361     median: 5361 (13%)     max: 5640 Points
968 Points (2%)
3945 Points (10%)
Cinebench R15 - Cinebench R15 CPU Multi 64 Bit
min: 2265     avg: 2299     median: 2299 (15%)     max: 2333 Points
416 Points (3%)
1574 Points (10%)
Cinebench R15 - Cinebench R15 CPU Single 64 Bit
240 Points (72%)
85 Points (26%)
210 Points (63%)
Cinebench R11.5 - Cinebench R11.5 CPU Multi 64 Bit
25.6 Points (33%)
5.3 Points (7%)
17.7 Points (23%)
Cinebench R11.5 - Cinebench R11.5 CPU Single 64 Bit
2.9 Points (71%)
1 Points (25%)
2.2 Points (55%)
Cinebench R10 - Cinebench R10 Rend. Single (32bit)
9621 Points (58%)
2884 Points (17%)
6210 Points (38%)
Cinebench R10 - Cinebench R10 Rend. Multi (32bit)
58342 Points (42%)
12014 Points (9%)
44220 Points (32%)
Cinebench R10 - Cinebench R10 Rend. Multi (64bit)
100%
1 i3-N300 +
18450 Points (13%)
57417 Points (40%)
Cinebench R10 - Cinebench R10 Rend. Single (64bit)
100%
1 i3-N300 +
4497 Points (5%)
8876 Points (11%)
wPrime 2.10 - wPrime 2.0 32m *
4.8 s (1%)
17.5 s (4%)
4.1 s (1%)
wPrime 2.10 - wPrime 2.0 1024m *
100%
1 i3-N300 +
531 s (6%)
117.2 s (1%)
WinRAR - WinRAR 4.0
100%
1 i3-N300 +
1915 Points (3%)
7147 Points (11%)
7-Zip 18.03 - 7-Zip 18.03 Multli Thread 4 runs
57129 MIPS (33%)
11976 MIPS (7%)
41522 MIPS (24%)
7-Zip 18.03 - 7-Zip 18.03 Single Thread 4 runs
6157 MIPS (74%)
2403 MIPS (29%)
5466 MIPS (65%)
X264 HD Benchmark 4.0 - x264 Pass 2
128 fps (45%)
28.9 fps (10%)
91.5 fps (32%)
X264 HD Benchmark 4.0 - x264 Pass 1
292.5 fps (67%)
106.6 fps (25%)
258 fps (60%)
HWBOT x265 Benchmark v2.2 - HWBOT x265 4k Preset
16.3 fps (29%)
3.2 fps (6%)
13.5 fps (24%)
TrueCrypt - TrueCrypt Serpent
1.2 GB/s (0%)
0.2 GB/s (0%)
0.8 GB/s (0%)
TrueCrypt - TrueCrypt Twofish
1.9 GB/s (33%)
0.5 GB/s (8%)
1.4 GB/s (24%)
TrueCrypt - TrueCrypt AES
12.7 GB/s (33%)
2.6 GB/s (7%)
8.7 GB/s (23%)
Blender - Blender 3.3 Classroom CPU *
100%
1 i3-N300 +
2147 Seconds (27%)
Blender - Blender 2.79 BMW27 CPU *
221 Seconds (2%)
1095 Seconds (8%)
290.2 Seconds (2%)
R Benchmark 2.5 - R Benchmark 2.5 *
0.5 sec (11%)
1.3 sec (29%)
0.6 sec (12%)
3DMark 06 - CPU - 3DMark 06 - CPU
16388 Points (35%)
4261 Points (9%)
13359 Points (28%)
Super Pi mod 1.5 XS 1M - Super Pi mod 1.5 XS 1M *
20.2 s (4%)
33.2 s (7%)
7.8 s (2%)
Super Pi mod 1.5 XS 2M - Super Pi mod 1.5 XS 2M *
100%
1 i3-N300 +
69.1 s (3%)
16.9 s (1%)
Super Pi Mod 1.5 XS 32M - Super Pi mod 1.5 XS 32M *
685 s (3%)
1381 s (6%)
703 s (3%)
3DMark Vantage - 3DM Vant. Perf. CPU no Physx
100%
1 i3-N300 +
15263 Points (13%)
57236 Points (50%)
3DMark 11 - 3DM11 Performance Physics
17324 Points (47%)
4983 Points (13%)
15367 Points (42%)
3DMark - 3DMark Ice Storm Physics
70388 Points (57%)
28114 Points (23%)
71688 Points (58%)
3DMark - 3DMark Ice Storm Extreme Physics
100%
1 i3-N300 +
28073 Points (23%)
71496 Points (58%)
3DMark - 3DMark Ice Storm Unlimited Physics
100%
1 i3-N300 +
28903 Points (24%)
74053 Points (62%)
3DMark - 3DMark Cloud Gate Physics
18593 Points (47%)
4049 Points (10%)
13346 Points (34%)
3DMark - 3DMark Fire Strike Standard Physics
25557 Points (46%)
5528 Points (10%)
21144 Points (38%)
3DMark - 3DMark Time Spy CPU
8468 Points (36%)
Geekbench 6.2 - Geekbench 6.2 Single-Core
100%
1 i3-N300 +
762 Points (21%)
Geekbench 6.2 - Geekbench 6.2 Multi-Core
100%
1 i3-N300 +
2803 Points (11%)
Geekbench 5.5 - Geekbench 5.1 - 5.4 64 Bit Single-Core
min: 1721     avg: 1766     median: 1765.5 (74%)     max: 1810 Points
626 Points (26%)
1575 Points (66%)
Geekbench 5.5 - Geekbench 5.1 - 5.4 64 Bit Multi-Core
min: 10269     avg: 10787     median: 10786.5 (19%)     max: 11304 Points
2674 Points (5%)
7681 Points (14%)
Geekbench 5.0 - Geekbench 5.0 64 Bit Single-Core
100%
1 i3-N300 +
616 Points (3%)
1543 Points (7%)
Geekbench 5.0 - Geekbench 5.0 64 Bit Multi-Core
100%
1 i3-N300 +
2642 Points (8%)
7679 Points (24%)
Geekbench 4.4 - Geekbench 4.1 - 4.4 64 Bit Single-Core
100%
1 i3-N300 +
2913 Points (29%)
6836 Points (68%)
Geekbench 4.4 - Geekbench 4.1 - 4.4 64 Bit Multi-Core
100%
1 i3-N300 +
9894 Points (11%)
30191 Points (33%)
Mozilla Kraken 1.1 - Kraken 1.1 Total Score *
603 ms (1%)
1638 ms (2%)
654 ms (1%)
Sunspider - Sunspider 1.0 Total Score *
124.2 ms (1%)
Octane V2 - Octane V2 Total Score
71212 Points (63%)
WebXPRT 3 - WebXPRT 3 Score
254 Points (53%)
104.3 Points (22%)
255 Points (53%)
CrossMark - CrossMark Overall
1775 Points (68%)
529 Points (20%)
Power Consumption - Prime95 Power Consumption - external Monitor *
210 Watt (36%)
150%
1 i3-N300 +
24.4 Watt (4%)
236 Watt (41%)
Power Consumption - Cinebench R15 Multi Power Consumption - external Monitor *
244 Watt (45%)
173%
1 i3-N300 +
22.2 Watt (4%)
204 Watt (37%)
Power Consumption - Idle Power Consumption - external Monitor *
100%
1 i3-N300 +
14.7 Watt (10%)
Power Consumption - Cinebench R15 Multi Power Efficiency - external Monitor
9.6 Points per Watt (7%)
7.7 Points per Watt (6%)

Average Benchmarks Intel Core i7-11700K → 100% n=32

Average Benchmarks Intel Core i3-N300 → 40% n=32

Average Benchmarks Intel Core i5-11400F → 83% n=32

- Range of benchmark values for this graphics card
- Average benchmark values for this graphics card
* Smaller numbers mean a higher performance
1 This benchmark is not used for the average calculation

v1.28
log 02. 07:29:13

#0 checking url part for id 12999 +0s ... 0s

#1 checking url part for id 14928 +0s ... 0s

#2 checking url part for id 13219 +0s ... 0s

#3 redirected to Ajax server, took 1719898153 +0s ... 0s

#4 did not recreate cache, as it is less than 5 days old! Created at Mon, 01 Jul 2024 05:15:43 +0200 +0s ... 0s

#5 composed specs +0.006s ... 0.006s

#6 did output specs +0s ... 0.006s

#7 getting avg benchmarks for device 12999 +0.003s ... 0.009s

#8 got single benchmarks 12999 +0.004s ... 0.013s

#9 getting avg benchmarks for device 14928 +0.004s ... 0.017s

#10 got single benchmarks 14928 +0.004s ... 0.021s

#11 getting avg benchmarks for device 13219 +0.004s ... 0.025s

#12 got single benchmarks 13219 +0.004s ... 0.028s

#13 got avg benchmarks for devices +0s ... 0.028s

#14 min, max, avg, median took s +0.063s ... 0.091s

#15 return log +0s ... 0.091s

Please share our article, every link counts!
> Expert Reviews and News on Laptops, Smartphones and Tech Innovations > Benchmarks / Tech > Processor Comparison - Head 2 Head
Redaktion, 2017-09- 8 (Update: 2023-07- 1)