Notebookcheck Logo

Intel Core i7-10700K vs AMD Ryzen 5 5600X vs Intel Core i7-10700

Intel Core i7-10700K

► remove from comparison

The Intel Core i7-10700K is a high-end desktop CPU based on the Comet Lake architecture. The CPU offers 8 cores and 16 threads clocked at 3.8 - 5.1 GHz. The TDP is rated at 125 Watt (PL1) but the PL2 is set to 229 Watt for short term boosts (up to 56 seconds).

AMD Ryzen 5 5600X

► remove from comparison AMD R5 5600X

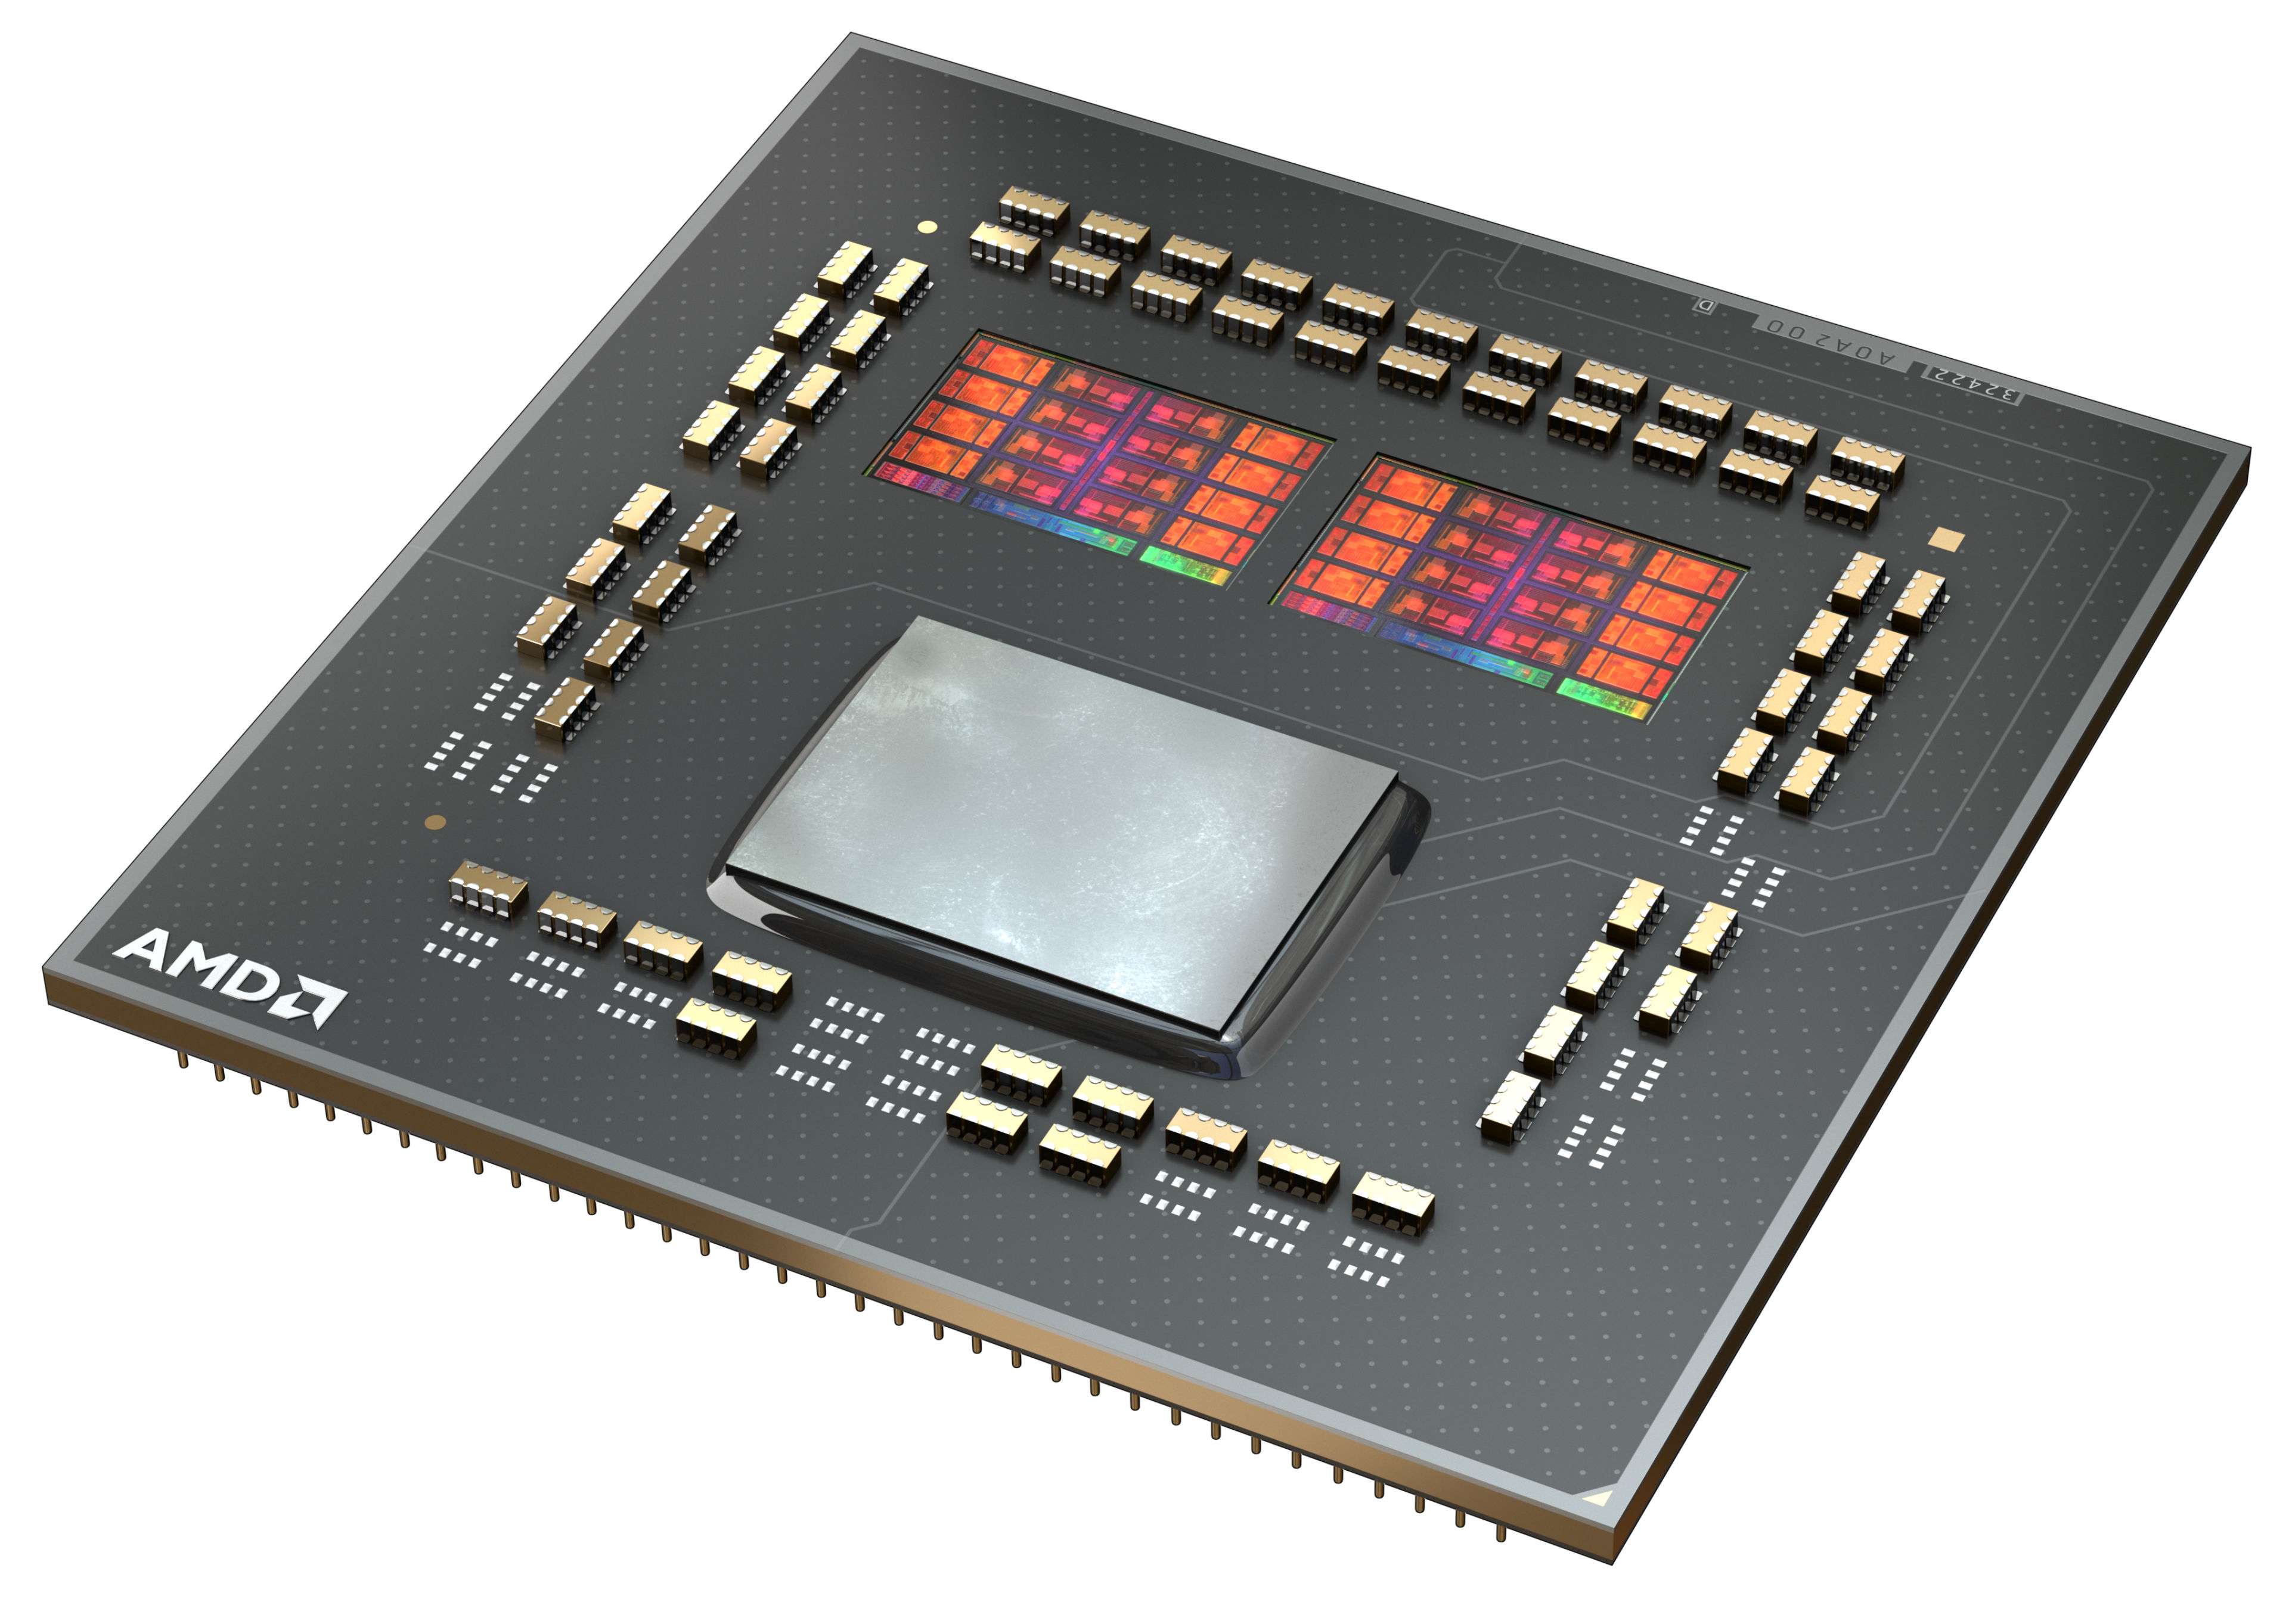
The AMD Ryzen 5 5600X is a desktop processor with 6 SMT-enabled (12 threads) and based on the Zen 3 architecture. Launched in November 2020, it is the fastest 6-core Ryzen desktop processor. With a TDP of 65 watts, the Ryzen 5 5600X is the least energy-hungry model in the Zen 3 family to date.

The Ryzen 5 5600X is clocked at 3.7 GHz base clock and can be clocked up to 4.6 GHz with Precision Boost 2.

Performance

The average 5600X in our database is in the same league as the Ryzen 9 4900H and the Ryzen 7 6800HS, as far as multi-thread benchmark scores are concerned. While this isn't the fastest CPU money can buy, it still rips through most workloads with ease, as of mid 2022. Find out more in our full review.

Power consumption

This Ryzen 5 series chip has a default TDP (also known as the long-term power limit) of 65 W to be in line with most desktop processors.

The R5 5600X is built with TSMC's 7 nm process for average, as of early 2023, energy efficiency.

Intel Core i7-10700

► remove from comparison

The Intel Core i7-10700 is a high-end desktop CPU based on the Comet Lake architecture. The CPU offers 8 cores and 16 threads clocked at 2.9 - 4.8 GHz. All cores can run at up to 4.6 GHz.

Compared to the older Core i7-9700, the 10700 now enables HyperThreading and therefore in some applications a nice performance boost. The single core performance is quite similar.

The chip is manufactured on 14nm++ process at Intel. The TDP is rated at 65 Watt (PL1) but the PL2 is set to 224 Watt for short term boosts (up to 28 seconds).

ModelIntel Core i7-10700KAMD Ryzen 5 5600XIntel Core i7-10700
SeriesIntel Comet LakeAMD Vermeer (Ryzen 5000)Intel Comet Lake
CodenameComet LakeVermeer (Zen 3)Comet Lake
Series: Comet Lake Comet Lake
Intel Core i9-10900K3.7 - 5.3 GHz10 / 20 cores20 MB L3
Intel Core i7-10700K « 3.8 - 5.1 GHz8 / 16 cores16 MB L3
Intel Core i7-107002.9 - 4.8 GHz8 / 16 cores16 MB L3
Intel Core i5-10600K4.1 - 4.8 GHz6 / 12 cores12 MB L3
Intel Core i5-10400F2.9 - 4.3 GHz6 / 12 cores12 MB L3
Intel Core i3-10100F3.6 - 4.3 GHz4 / 8 cores6 MB L3
AMD Ryzen 9 5950X3.4 - 4.9 GHz16 / 32 cores64 MB L3
AMD Ryzen 7 5800X3.8 - 4.7 GHz8 / 16 cores32 MB L3
AMD Ryzen 7 5700X3.4 - 4.6 GHz8 / 16 cores32 MB L3
AMD Ryzen 5 5600X « 3.7 - 4.6 GHz6 / 12 cores32 MB L3
Intel Core i9-10900K3.7 - 5.3 GHz10 / 20 cores20 MB L3
Intel Core i7-10700K3.8 - 5.1 GHz8 / 16 cores16 MB L3
Intel Core i7-10700 « 2.9 - 4.8 GHz8 / 16 cores16 MB L3
Intel Core i5-10600K4.1 - 4.8 GHz6 / 12 cores12 MB L3
Intel Core i5-10400F2.9 - 4.3 GHz6 / 12 cores12 MB L3
Intel Core i3-10100F3.6 - 4.3 GHz4 / 8 cores6 MB L3
Clock3800 - 5100 MHz3700 - 4600 MHz2900 - 4800 MHz
L1 Cache512 KB384 KB512 KB
L2 Cache2 MB3 MB2 MB
L3 Cache16 MB32 MB16 MB
Cores / Threads8 / 166 / 128 / 16
TDP125 Watt65 Watt65 Watt
Technology14 nm7 nm14 nm
max. Temp.100 °C95 °C100 °C
SocketLGA1200AM4LGA1200
FeaturesDDR4-2933 RAM, PCIe 3, 8 GT/s bus, vPro, MMX, SSE, SSE2, SSE3, SSSE3, SSE4.1, SSE4.2, AVX, AVX2, BMI2, ABM, FMA, ADX, VMX, SMX, SMEP, SMAP, MPX, EIST, TM1, TM2, HT, Turbo, SST, AES-NI, RDRAND, RDSEED, SGXDDR4-3200 RAM, PCIe 4, MMX (+), SSE, SSE2, SSE3, SSSE3, SSE4.1, SSE4.2, SSE4A, AES, AVX, AVX2, FMA3, SHADDR4-2933 RAM, PCIe 3, 8 GT/s bus, vPro, MMX, SSE, SSE2, SSE3, SSSE3, SSE4.1, SSE4.2, AES, AVX, AVX2, FMA3
iGPUIntel UHD Graphics 630 (350 - 1200 MHz)Intel UHD Graphics 630 (350 - 1200 MHz)
Architecturex86x86x86
$400 U.S.$299 U.S.$340 U.S.
Announced
Manufacturerark.intel.comwww.amd.comark.intel.com

Benchmarks

Performance Rating - CB R15 + R20 + 7-Zip + X265 + Blender + 3DM11 CPU - i7-10700K
37.8 pt (52%)
Performance Rating - CB R15 + R20 + 7-Zip + X265 + Blender + 3DM11 CPU - R5 5600X
41.9 pt (58%)
Cinebench R23 - Cinebench R23 Multi Core
11838 Points (11%)
8532 Points (8%)
Cinebench R23 - Cinebench R23 Single Core
1541 Points (66%)
1234 Points (52%)
Cinebench R20 - Cinebench R20 CPU (Single Core)
496 Points (55%)
601 Points (67%)
Cinebench R20 - Cinebench R20 CPU (Multi Core)
4882 Points (12%)
4567 Points (11%)
Cinebench R15 - Cinebench R15 CPU Multi 64 Bit
2027 Points (13%)
1968 Points (12%)
1455 Points (9%)
Cinebench R15 - Cinebench R15 CPU Single 64 Bit
208 Points (63%)
254 Points (77%)
196 Points (59%)
Cinebench R11.5 - Cinebench R11.5 CPU Multi 64 Bit
22.2 Points (29%)
21.8 Points (28%)
16.7 Points (22%)
Cinebench R11.5 - Cinebench R11.5 CPU Single 64 Bit
2.4 Points (59%)
3 Points (73%)
2.3 Points (56%)
Cinebench R10 - Cinebench R10 Rend. Single (32bit)
7910 Points (48%)
6462 Points (39%)
7611 Points (46%)
Cinebench R10 - Cinebench R10 Rend. Multi (32bit)
50670 Points (37%)
39331 Points (28%)
41156 Points (30%)
Cinebench R10 - Cinebench R10 Rend. Multi (64bit)
64901 Points (45%)
69545 Points (48%)
52577 Points (36%)
Cinebench R10 - Cinebench R10 Rend. Single (64bit)
10201 Points (12%)
12563 Points (15%)
9898 Points (12%)
wPrime 2.10 - wPrime 2.0 1024m *
85.7 s (1%)
113.9 s (1%)
119.5 s (1%)
wPrime 2.10 - wPrime 2.0 32m *
3.2 s (1%)
3.9 s (1%)
3.3 s (1%)
WinRAR - WinRAR 4.0
8469 Points (13%)
13282 Points (21%)
6555 Points (10%)
7-Zip 18.03 - 7-Zip 18.03 Multli Thread 4 runs
54050 MIPS (31%)
56607 MIPS (32%)
43007 MIPS (25%)
7-Zip 18.03 - 7-Zip 18.03 Single Thread 4 runs
5647 MIPS (68%)
6594 MIPS (79%)
5293 MIPS (63%)
X264 HD Benchmark 4.0 - x264 Pass 2
121 fps (42%)
117 fps (41%)
84.8 fps (30%)
X264 HD Benchmark 4.0 - x264 Pass 1
269 fps (62%)
320 fps (74%)
236 fps (54%)
HWBOT x265 Benchmark v2.2 - HWBOT x265 4k Preset
16.3 fps (29%)
15.7 fps (28%)
11.6 fps (20%)
TrueCrypt - TrueCrypt Serpent
1 GB/s (0%)
0.9 GB/s (0%)
1.1 GB/s (0%)
TrueCrypt - TrueCrypt Twofish
2 GB/s (34%)
1.5 GB/s (26%)
1.8 GB/s (31%)
TrueCrypt - TrueCrypt AES
11.2 GB/s (29%)
10.7 GB/s (28%)
10.3 GB/s (27%)
Blender - Blender 2.79 BMW27 CPU *
217.4 Seconds (2%)
260.2 Seconds (2%)
315.4 Seconds (2%)
R Benchmark 2.5 - R Benchmark 2.5 *
0.6 sec (12%)
0.5 sec (10%)
0.6 sec (13%)
3DMark 06 - CPU - 3DMark 06 - CPU
14576 Points (31%)
Super Pi mod 1.5 XS 1M - Super Pi mod 1.5 XS 1M *
7.6 s (2%)
8.1 s (2%)
8.1 s (2%)
Super Pi mod 1.5 XS 2M - Super Pi mod 1.5 XS 2M *
17.2 s (1%)
17.5 s (1%)
17.2 s (1%)
Super Pi Mod 1.5 XS 32M - Super Pi mod 1.5 XS 32M *
391.3 s (2%)
400.9 s (2%)
439.6 s (2%)
3DMark Vantage - 3DM Vant. Perf. CPU no Physx
66603 Points (58%)
3DMark 11 - 3DM11 Performance Physics
18064 Points (49%)
19649 Points (53%)
15497 Points (42%)
3DMark - 3DMark Ice Storm Physics
72174 Points (59%)
88825 Points (72%)
62614 Points (51%)
3DMark - 3DMark Ice Storm Extreme Physics
72375 Points (59%)
88777 Points (72%)
62334 Points (51%)
3DMark - 3DMark Ice Storm Unlimited Physics
74085 Points (62%)
91500 Points (77%)
3DMark - 3DMark Cloud Gate Physics
18637 Points (47%)
16447 Points (42%)
13579 Points (34%)
3DMark - 3DMark Fire Strike Standard Physics
24791 Points (44%)
25990 Points (46%)
20080 Points (36%)
3DMark - 3DMark Time Spy CPU
10963 Points (46%)
8911 Points (38%)
8580 Points (36%)
Geekbench 5.5 - Geekbench 5.1 - 5.4 64 Bit Single-Core
min: 1371     avg: 1374     median: 1373.5 (58%)     max: 1376 Points
1657 Points (70%)
1299 Points (55%)
Geekbench 5.5 - Geekbench 5.1 - 5.4 64 Bit Multi-Core
min: 8911     avg: 8925     median: 8925 (16%)     max: 8939 Points
8980 Points (16%)
8173 Points (15%)
Geekbench 5.0 - Geekbench 5.0 64 Bit Single-Core
1368 Points (6%)
1587 Points (7%)
1304 Points (6%)
Geekbench 5.0 - Geekbench 5.0 64 Bit Multi-Core
8903 Points (28%)
8926 Points (28%)
8196 Points (26%)
Geekbench 4.4 - Geekbench 4.1 - 4.4 64 Bit Single-Core
6247 Points (62%)
6953 Points (69%)
5726 Points (57%)
Geekbench 4.4 - Geekbench 4.1 - 4.4 64 Bit Multi-Core
34735 Points (38%)
35617 Points (39%)
32174 Points (35%)
Mozilla Kraken 1.1 - Kraken 1.1 Total Score *
747 ms (1%)
578 ms (1%)
752 ms (1%)
WebXPRT 3 - WebXPRT 3 Score
245 Points (51%)
286 Points (60%)
244 Points (51%)
CrossMark - CrossMark Overall
1489 Points (57%)
Power Consumption - Prime95 Power Consumption - external Monitor *
205 Watt (35%)
175.8 Watt (30%)
116.3 Watt (20%)
Power Consumption - Cinebench R15 Multi Power Consumption - external Monitor *
207.7 Watt (38%)
170.1 Watt (31%)
148 Watt (27%)
Power Consumption - Cinebench R15 Multi Power Efficiency - external Monitor
9.8 Points per Watt (7%)
11.6 Points per Watt (9%)
9.8 Points per Watt (7%)

Average Benchmarks Intel Core i7-10700K → 100% n=38

Average Benchmarks AMD Ryzen 5 5600X → 105% n=38

Average Benchmarks Intel Core i7-10700 → 90% n=38

- Range of benchmark values for this graphics card
- Average benchmark values for this graphics card
* Smaller numbers mean a higher performance
1 This benchmark is not used for the average calculation

v1.28
log 01. 22:14:55

#0 checking url part for id 12778 +0s ... 0s

#1 checking url part for id 12785 +0s ... 0s

#2 checking url part for id 13214 +0s ... 0s

#3 redirected to Ajax server, took 1719864895 +0s ... 0s

#4 did not recreate cache, as it is less than 5 days old! Created at Mon, 01 Jul 2024 05:15:43 +0200 +0s ... 0s

#5 composed specs +0.004s ... 0.004s

#6 did output specs +0s ... 0.004s

#7 getting avg benchmarks for device 12778 +0.004s ... 0.008s

#8 got single benchmarks 12778 +0.004s ... 0.012s

#9 getting avg benchmarks for device 12785 +0.004s ... 0.016s

#10 got single benchmarks 12785 +0.004s ... 0.02s

#11 getting avg benchmarks for device 13214 +0.001s ... 0.02s

#12 got single benchmarks 13214 +0.004s ... 0.024s

#13 got avg benchmarks for devices +0s ... 0.024s

#14 min, max, avg, median took s +0.059s ... 0.083s

#15 return log +0s ... 0.083s

Please share our article, every link counts!
> Expert Reviews and News on Laptops, Smartphones and Tech Innovations > Benchmarks / Tech > Processor Comparison - Head 2 Head
Redaktion, 2017-09- 8 (Update: 2023-07- 1)