Notebookcheck Logo

Intel Core i5-L16G7 vs AMD Ryzen 5 5500U

Intel Core i5-L16G7

► remove from comparison Intel i5-L16G7

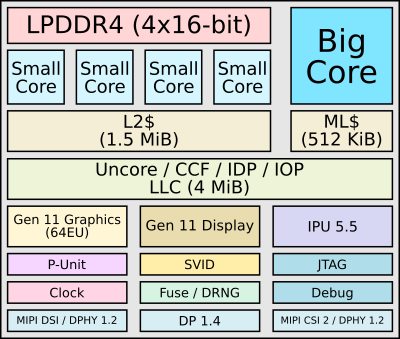
The Core i5-L16G7 is an SoC with 5 processor cores based on the Lakefield architecture. It uses one fast Sunny Cove core (known from Ice-Lake CPUs but without AVX512) with up to 3 GHz and 4 small Tremont cores (Atom / Celeron) with up to 2.8 GHz. Using all 5 cores, the CPU can reach up to 1.8 GHz, base clock speed is 1.4 GHz. The CPU does not support HyperThreading / SMT. The rest of the SoC is similar to the Ice Lake chips, like the Gen 11 graphics card with 64 EUs (similar to the Iris Plus G7 but only clocked at 500 MHz and using the UHD Graphics name).

Performance

The average L16G7 in our database is in the same league as the Pentium N6000 and also the Core i3-1110G4, as far as multi-thread benchmark scores are concerned. This kind of performance is only sufficient for basic day-to-day activities as of late 2023.

Your mileage may vary depending on how competent the cooling solution of your laptop is and how high the CPU power limits are.

With a specified TDP of 7 Watt (PL1, 9.5 Watt PL2), the CPU is well suited for thin and light laptops and Windows based tablets. / 2-in-1. Intel claims that the standby power was greatly reduced (91% better compared to the i7-8500Y with 2.5 mW). The SoC is manufactured in 10nm and uses the Intel Foveros 3D Packaging technology. Foveros is used to stack the in 22FFL manufactured I/O die, the compute die in 10nm and up to 8 GB LPDDR4X-4267.

AMD Ryzen 5 5500U

► remove from comparison AMD R5 5500U

The AMD Ryzen 5 5500U is a hexa-core APU of the Lucienne product family designed for use in ultra-thin, upper mid-range laptops. The processor was unveiled in H1 2021; its six CPU cores are based on the Zen 2 microarchitecture. The cores run at 2.1 GHz (base clock speed) to 4 GHz (highest Boost frequency possible) and feature the thread-doubling SMT technology for a total of 12 threads. The chip is manufactured on the modern 7 nm TSMC process.

One could be forgiven for thinking Ryzen 5 5500U is a renamed Ryzen 5 4500U - which is not the case. Ryzen 5 5500U is most similar to Ryzen 5 4600U, the most noteworthy difference between the two being the faster iGPU model of the former.

In the meantime, Ryzen 5 5600U got a little more lucky; it is based on the newer Zen 3 architecture and it also has higher clock speeds than what a 5500U can boast of.

Architecture

While Ryzen 5 5500U and Ryzen 7 5700U are Zen 2-based processors, the neighbouring Ryzen 5 5600U and Ryzen 7 5800U use AMD's brand-new Zen 3 architecture. This makes the former two a generation older than their names suggest. Still, Zen 2 is nothing to sneeze at, with its high performance-per-Watt and performance-per-MHz figures.

Ryzen 5 5500U supports dual-channel DDR4-3200 and quad-channel LPDDR4-4266 RAM and has 8 MB of Level 3 cache. Unlike desktop-grade Ryzen 5000-series processors, Ryzen 5 5500U is limited to PCI-Express 3.0 (not PCI-Express 4.0; no 7.9 GB/s NVMe SSDs here).

The processor gets soldered permanently on to the motherboard (FP6 socket interface) and is thus not user-replaceable.

Performance

Multi-thread performance is most comparable to the Ryzen 7 4700U and the Core i7-10850H, which is nothing to sneeze at. The Ryzen will have no trouble chewing through pretty much any workload, as of mid 2022.

Thanks to its decent cooling solution and a long-term CPU power limit of around 27 W, the Lenovo IdeaPad Flex 5 14ALC05-82HU006NGE is among the fastest laptops built around the 5500U that we know of. It can be more than 30% faster in CPU-bound workloads than the slowest system featuring the same chip in our database, as of August 2023.

Graphics

The Radeon RX Vega 7 iGPU has 7 CUs at its disposal (64 x 7 = 448 unified shaders) running at up to 1,800 MHz. Its real-life performance is close to what we've seen from GeForce MX250 and Iris Xe Graphics G7 (80 EUs); Mass Effect Legendary Edition (2021) runs well at 1080p resolution, low-to-medium settings, to give you an example. As the iGPU has no VRAM of its own, it is paramount that fast system RAM is used.

The graphics adapter definitely supports UHD 2160p monitors at 60 Hz. It will have no trouble HW-decoding HEVC, AVC, VP9, MPEG-2 and other popular video codecs. There is no AV1 support; AV1-encoded videos will be software-decoded, which six Zen 2 cores will handle with ease.

Power consumption

The APU has a default TDP (also known as the long-term Power Limit) of 15 W. That can be changed to anything between 10 W and 25 W by laptop makers and in many cases they do go for a value higher than 15 W to achieve higher performance levels. On the other hand, by going for the lowest value, it will be possible to build a passively cooled system around the Ryzen 5.

The R5 5500U is manufactured using TSMC's 7 nm process for average, as of mid 2023, average efficiency.

ModelIntel Core i5-L16G7AMD Ryzen 5 5500U
SeriesIntel LakefieldAMD Lucienne (Zen 2, Ryzen 5000)
CodenameLakefieldLucienne-U (Zen 2)
Series: Lucienne (Zen 2, Ryzen 5000) Lucienne-U (Zen 2)
Intel Core i5-L16G7 « 1.4 - 3 GHz5 / 5 cores
Intel Core i3-L13G4 compare0.8 - 2.8 GHz5 / 5 cores4 MB L3
AMD Ryzen 7 5700U compare1.8 - 4.3 GHz8 / 16 cores8 MB L3
AMD Ryzen 5 5500U « 2.1 - 4 GHz6 / 12 cores8 MB L3
AMD Ryzen 3 5300U compare2.6 - 3.8 GHz4 / 8 cores4 MB L3
Clock1400 - 3000 MHz2100 - 4000 MHz
Cores / Threads5 / 56 / 12
TDP7 Watt25 Watt
Technology10 nm7 nm
max. Temp.100 °C105 °C
SocketCSP1016FP6
FeaturesLPDDR4x-4266 RAM, PCIe 3, 4 GT/s bus, MMX, SSE, SSE2, SSE3, SSSE3, SSE4.1, SSE4.2, VMX, SMEP, SMAP, EIST, TM1, TM2, Turbo, SST, AES-NI, RDRAND, RDSEED, SHADDR4-3200/LPDDR4-4266 RAM, PCIe 3, MMX, SSE, SSE2, SSE3, SSSE3, SSE4A, SSE4.1, SSE4.2, AVX, AVX2, BMI2, ABM, FMA, ADX, SMEP, SMAP, SMT, CPB, AES-NI, RDRAND, RDSEED, SHA, SME
iGPUIntel UHD Graphics G7 (Lakefield GT2 64 EU) (200 - 500 MHz)AMD Radeon RX Vega 7 ( - 1800 MHz)
Architecturex86x86
$281 U.S.
Announced
Manufacturerark.intel.comwww.amd.com
L1 Cache384 KB
L2 Cache3 MB
L3 Cache8 MB

Benchmarks

Performance Rating - CB R15 + R20 + 7-Zip + X265 + Blender + 3DM11 CPU - i5-L16G7
21.1 pt (29%)
Performance Rating - CB R15 + R20 + 7-Zip + X265 + Blender + 3DM11 CPU - R5 5500U
31.9 pt (44%)
Cinebench R23 - Cinebench R23 Multi Core
1810 Points (2%)
min: 6030     avg: 7209     median: 7186 (7%)     max: 8353 Points
Cinebench R23 - Cinebench R23 Single Core
710 Points (30%)
min: 1149     avg: 1172     median: 1172 (50%)     max: 1183 Points
Cinebench R20 - Cinebench R20 CPU (Single Core)
min: 276     avg: 282.5     median: 282.5 (31%)     max: 289 Points
min: 449     avg: 456.6     median: 457 (51%)     max: 461 Points
Cinebench R20 - Cinebench R20 CPU (Multi Core)
min: 609     avg: 648     median: 647.5 (2%)     max: 686 Points
min: 2223     avg: 2756     median: 2698 (7%)     max: 3213 Points
Cinebench R15 - Cinebench R15 CPU Multi 64 Bit
255 Points (2%)
min: 995     avg: 1220     median: 1247 (8%)     max: 1387 Points
Cinebench R15 - Cinebench R15 CPU Single 64 Bit
min: 88.3     avg: 89.5     median: 89.5 (27%)     max: 90.7 Points
min: 170     avg: 176     median: 177 (53%)     max: 177.6 Points
Cinebench R11.5 - Cinebench R11.5 CPU Multi 64 Bit
3.2 Points (4%)
11.4 Points (15%)
Cinebench R11.5 - Cinebench R11.5 CPU Single 64 Bit
1.4 Points (35%)
2 Points (50%)
Cinebench R10 - Cinebench R10 Rend. Single (32bit)
4079 Points (25%)
5313 Points (32%)
Cinebench R10 - Cinebench R10 Rend. Multi (32bit)
9003 Points (7%)
27437 Points (20%)
wPrime 2.10 - wPrime 2.0 1024m *
879 s (10%)
181.3 s (2%)
wPrime 2.10 - wPrime 2.0 32m *
28.6 s (6%)
6.2 s (1%)
WinRAR - WinRAR 4.0
3945 Points (6%)
7-Zip 18.03 - 7-Zip 18.03 Multli Thread 4 runs
min: 7230     avg: 7587     median: 7586.5 (4%)     max: 7943 MIPS
min: 29585     avg: 33606     median: 33768 (19%)     max: 36896 MIPS
7-Zip 18.03 - 7-Zip 18.03 Single Thread 4 runs
min: 3174     avg: 3211     median: 3211 (38%)     max: 3248 MIPS
min: 4174     avg: 4300     median: 4324 (52%)     max: 4356 MIPS
X264 HD Benchmark 4.0 - x264 Pass 2
45.3 fps (16%)
X264 HD Benchmark 4.0 - x264 Pass 1
162.3 fps (37%)
HWBOT x265 Benchmark v2.2 - HWBOT x265 4k Preset
min: 1.44     avg: 1.5     median: 1.5 (3%)     max: 1.48 fps
min: 6.7     avg: 8.4     median: 8.5 (15%)     max: 9.69 fps
TrueCrypt - TrueCrypt Serpent
0.5 GB/s (0%)
TrueCrypt - TrueCrypt Twofish
0.8 GB/s (14%)
TrueCrypt - TrueCrypt AES
4.3 GB/s (11%)
Blender - Blender 3.3 Classroom CPU *
min: 676     avg: 763     median: 748.5 (10%)     max: 878 Seconds
Blender - Blender 2.79 BMW27 CPU *
min: 1897     avg: 2027     median: 2026.5 (14%)     max: 2156 Seconds
min: 358     avg: 418.5     median: 416.5 (3%)     max: 490 Seconds
R Benchmark 2.5 - R Benchmark 2.5 *
min: 0.897     avg: 0.9     median: 0.9 (20%)     max: 0.987 sec
min: 0.607     avg: 0.6     median: 0.6 (14%)     max: 0.67 sec
3DMark 06 - CPU - 3DMark 06 - CPU
min: 8635     avg: 9185     median: 9184.5 (20%)     max: 9734 Points
Super Pi mod 1.5 XS 1M - Super Pi mod 1.5 XS 1M *
11.7 s (3%)
10.5 s (2%)
Super Pi mod 1.5 XS 2M - Super Pi mod 1.5 XS 2M *
25.9 s (1%)
Super Pi Mod 1.5 XS 32M - Super Pi mod 1.5 XS 32M *
622 s (3%)
3DMark 11 - 3DM11 Performance Physics
min: 2926     avg: 3015     median: 3015 (8%)     max: 3104 Points
min: 6895     avg: 9793     median: 10040 (27%)     max: 10681 Points
3DMark - 3DMark Ice Storm Physics
26353 Points (21%)
min: 50218     avg: 57085     median: 57983 (47%)     max: 60564 Points
3DMark - 3DMark Ice Storm Extreme Physics
26635 Points (22%)
min: 48627     avg: 55331     median: 57797 (47%)     max: 59569 Points
3DMark - 3DMark Ice Storm Unlimited Physics
32705 Points (28%)
min: 62790     avg: 64497     median: 64153.5 (54%)     max: 66889 Points
3DMark - 3DMark Cloud Gate Physics
min: 2831     avg: 2834     median: 2834 (7%)     max: 2837 Points
min: 7749     avg: 10198     median: 10339 (26%)     max: 11371 Points
3DMark - 3DMark Fire Strike Standard Physics
min: 4138     avg: 4306     median: 4305.5 (8%)     max: 4473 Points
min: 13854     avg: 16350     median: 16469 (29%)     max: 17840 Points
3DMark - 3DMark Time Spy CPU
1148 Points (5%)
min: 3774     avg: 4983     median: 5074.5 (21%)     max: 5964 Points
Geekbench 5.5 - Geekbench 5.1 - 5.4 64 Bit Single-Core
min: 797     avg: 827     median: 826.5 (35%)     max: 856 Points
min: 1070     avg: 1103     median: 1108 (47%)     max: 1126 Points
Geekbench 5.5 - Geekbench 5.1 - 5.4 64 Bit Multi-Core
min: 1441     avg: 1634     median: 1633.5 (3%)     max: 1826 Points
min: 4063     avg: 5256     median: 5438.5 (10%)     max: 5917 Points
Geekbench 5.0 - Geekbench 5.0 64 Bit Single-Core
min: 1088     avg: 1115     median: 1119.5 (5%)     max: 1127 Points
Geekbench 5.0 - Geekbench 5.0 64 Bit Multi-Core
min: 5247     avg: 5547     median: 5515 (17%)     max: 6008 Points
Geekbench 4.4 - Geekbench 4.1 - 4.4 64 Bit Single-Core
min: 4736     avg: 4787     median: 4798 (48%)     max: 4834 Points
Geekbench 4.4 - Geekbench 4.1 - 4.4 64 Bit Multi-Core
min: 20208     avg: 22051     median: 21901 (24%)     max: 24123 Points
Mozilla Kraken 1.1 - Kraken 1.1 Total Score *
min: 1252     avg: 1278     median: 1277.5 (1%)     max: 1303 ms
min: 837     avg: 853     median: 851 (1%)     max: 877 ms
Octane V2 - Octane V2 Total Score
min: 31228     avg: 32455     median: 32455 (29%)     max: 33682 Points
min: 48678     avg: 50485     median: 50330 (44%)     max: 52365 Points
WebXPRT 4 - WebXPRT 4 Score
156.3 Points (45%)
WebXPRT 3 - WebXPRT 3 Score
min: 121     avg: 124.5     median: 124.5 (26%)     max: 128 Points
min: 191.4     avg: 204.1     median: 206 (43%)     max: 212 Points
CrossMark - CrossMark Overall
min: 958     avg: 1047     median: 1049 (40%)     max: 1103 Points
Power Consumption - Prime95 Power Consumption - external Monitor *
min: 23.6     avg: 38.9     median: 38.4 (7%)     max: 54.7 Watt
Power Consumption - Cinebench R15 Multi Power Consumption - external Monitor *
min: 29     avg: 43.9     median: 45.9 (8%)     max: 56.3 Watt
Power Consumption - Idle Power Consumption - external Monitor *
4.3 Watt (3%)
Power Consumption - Idle Power Consumption 150cd 1min *
min: 5.32     avg: 6.5     median: 6.1 (7%)     max: 9.08 Watt
Power Consumption - Cinebench R15 Multi Power Efficiency - external Monitor
min: 21.7     avg: 28.9     median: 27.4 (20%)     max: 38.3 Points per Watt

Average Benchmarks Intel Core i5-L16G7 → 100% n=31

Average Benchmarks AMD Ryzen 5 5500U → 245% n=31

- Range of benchmark values for this graphics card
- Average benchmark values for this graphics card
* Smaller numbers mean a higher performance
1 This benchmark is not used for the average calculation

Add one or more devices and compare

In the following list you can select (and also search for) devices that should be added to the comparison. You can select more than one device.

restrict list:

show all (including archived), 2024, 2023
v1.28
log 30. 16:35:53

#0 checking url part for id 12215 +0s ... 0s

#1 checking url part for id 12981 +0s ... 0s

#2 redirected to Ajax server, took 1719758153 +0s ... 0s

#3 did not recreate cache, as it is less than 5 days old! Created at Fri, 28 Jun 2024 05:15:21 +0200 +0s ... 0s

#4 composed specs +0.009s ... 0.009s

#5 did output specs +0s ... 0.009s

#6 getting avg benchmarks for device 12215 +0.004s ... 0.013s

#7 got single benchmarks 12215 +0.005s ... 0.018s

#8 getting avg benchmarks for device 12981 +0.004s ... 0.022s

#9 got single benchmarks 12981 +0.029s ... 0.051s

#10 got avg benchmarks for devices +0s ... 0.051s

#11 min, max, avg, median took s +0.043s ... 0.094s

#12 return log +0.002s ... 0.097s

Please share our article, every link counts!
> Expert Reviews and News on Laptops, Smartphones and Tech Innovations > Benchmarks / Tech > Processor Comparison - Head 2 Head
Redaktion, 2017-09- 8 (Update: 2023-07- 1)