Notebookcheck Logo

Intel Core i5-14500HX vs AMD Ryzen 7 5700X vs Intel Core i9-14900HX

Intel Core i5-14500HX

► remove from comparison Intel i5-14500HX

The Intel Core i5-14500HX is a high-end CPU from the Raptor-Lake-HX Refresh series (RPL-H). The CPU offers all 6 performance cores (P-cores, Golden Cove or Raptor Cove architecture) and 8 efficiency cores (E-cores, Gracemont architecture). The P-cores support hyperthreading (therefore 20 threads together) and clock from 2.4 to 4.9 GHz (single-core turbo). The E-cores clock from 1.9 - 3.7 GHz and should offer comparable performance to old Skylake cores (e.g. i7-6920HQ).

Performance

Thanks to the higher clock rates of the Rocket Lake series, the i5-14500HX can reach the level of the old Core i9-12900H and is therefore a very fast mobile CPU that is ideal for all areas of application.

Graphics unit

Like its predecessor, Intel integrates an Intel Xe-based graphics unit. In the 14500HX, all 96 EUs are activated and clock at up to 1.55 GHz.

Features

Like Alder-Lake-H, Raptor-Lake-H has partially integrated WiFi 6E and Thunderbolt 4 (4x). The integrated memory controller now supports faster DDR5-5200 memory. The integrated Gaussian and Neural Accelerator (GNA) is still installed in version 3.0. The Quick Sync 8 media engine is the same as in Rocket Lake and supports MPEG-2, AVC, VC-1 decode, JPEG, VP8 decode, VP9, HEVC and AV1 decode. The chip supports PCIe 5.0 x8 for a dGPU and two PCIe 4.0 x4 for SSDs. The PCH also offers PCIe Gen3 x12.

Power consumption

The Intel Core i5-14500HX is specified with 55 watts TDP (PL2 157 watts). The processor continues to be manufactured using the improved Intel 7 process (10 nm SuperFin).

AMD Ryzen 7 5700X

► remove from comparison AMD R7 5700X

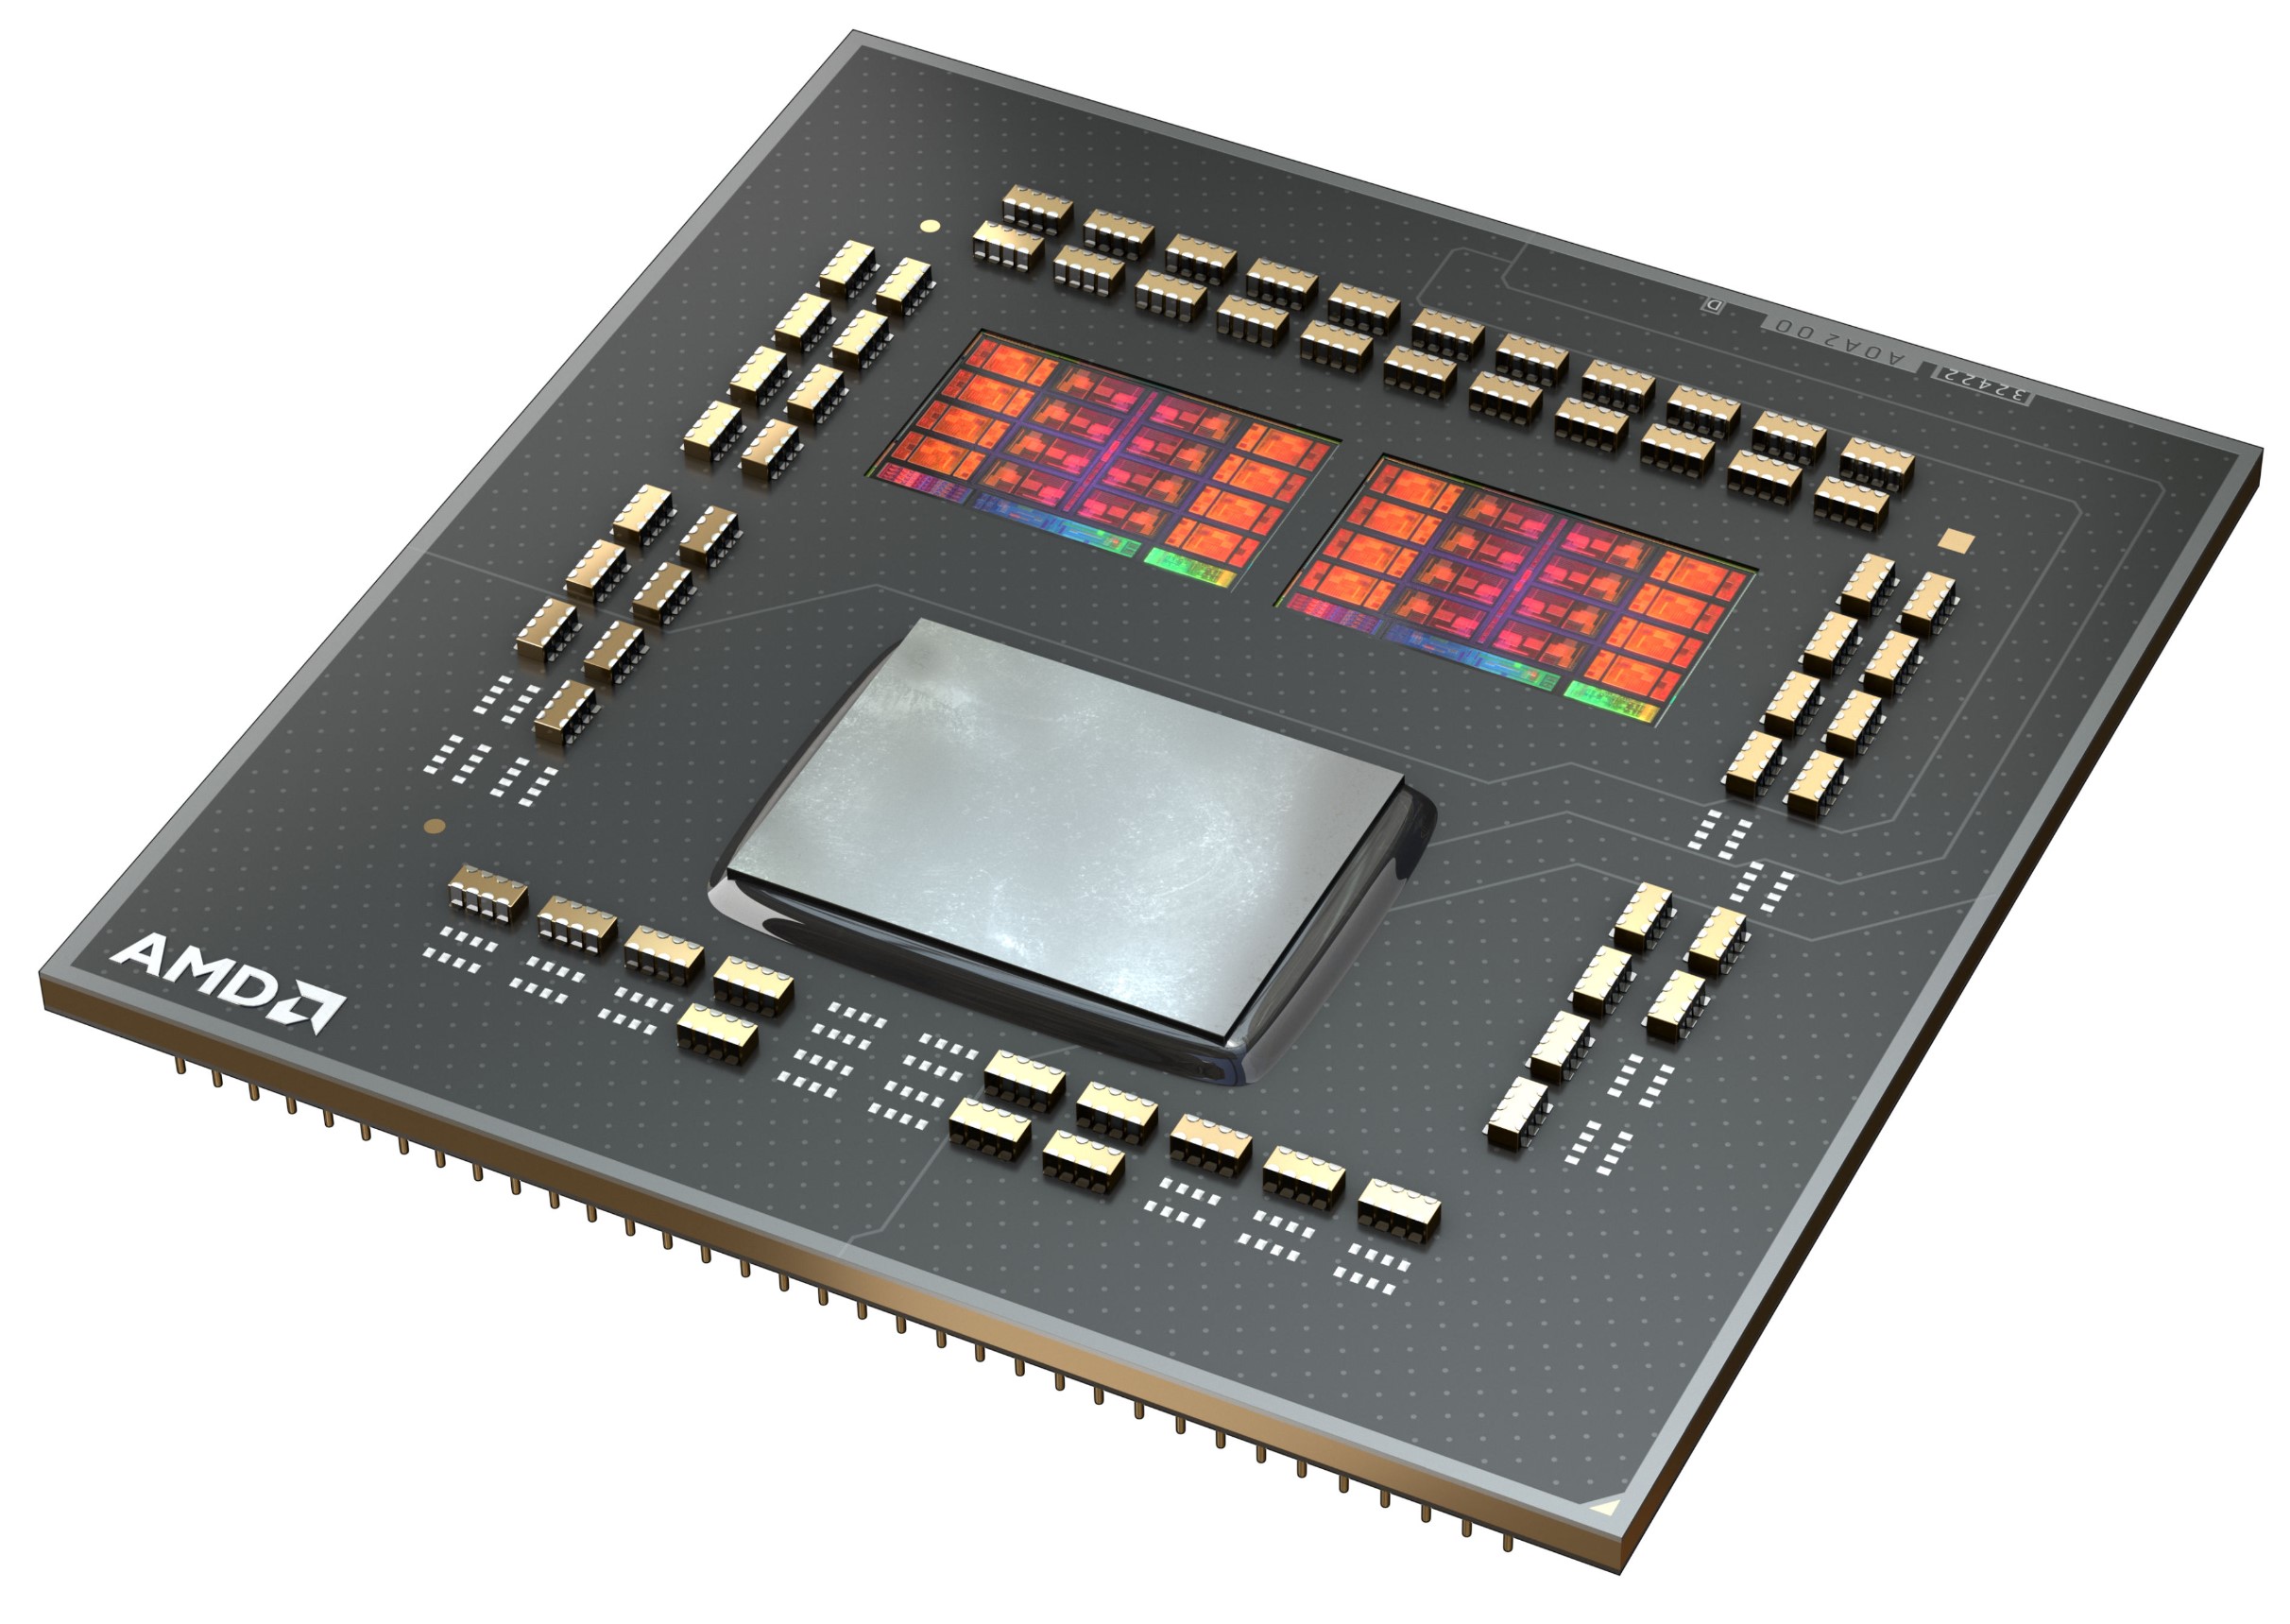
The AMD Ryzen 7 5700X is a desktop processor with 8 cores and simultaneous multithreading (SMT), which means it can process 16 threads simultaneously. In April 2022, AMD presented the Ryzen 7 5700X, a new 8-core processor that is very similar to the AMD Ryzen 7 5800X. However, due to the lower TDP, there are no restrictions on the clock frequency. Nevertheless, the AMD Ryzen 7 5700X reaches up to 4.6 GHz in boost, which is only 100 MHz less than the AMD Ryzen 7 5800X. However, the base clock drops significantly to 3.4 GHz.

The performance of the AMD Ryzen 7 5700X is consistently excellent in all applications. The native 8-core can really show off its strengths, especially in multi-threaded applications, although the single-core performance has also been significantly improved compared to the older Zen 2 architecture.

The internal structure of the processor is similar to the AMD Ryzen 7 5800X. The CCX modules are also connected to each other via the I/O die, which we already know from Zen2. However, according to AMD, the Infinity Fabric should now achieve clock rates of up to 2 GHz, which in turn enables a RAM clock rate of 4,000 MHz without any loss of performance.

In terms of manufacturing processes, AMD also relies on TSCM for the 7nm production of the CPU cores in the Vermeer processors, although the I/O die is still supplied in 12 nm by Globalfoundries.

The AMD Ryzen 7 5700X is impressive in gaming thanks to the significantly improved IPC compared to Zen2. In terms of power consumption, the AMD Ryzen 7 5700X impresses with its low TDP of just 65 watts. This means that the processor can also be operated with a compact air cooler without any problems. The AMD Ryzen 7 5800X is operated with a TDP of 105 watts.

Intel Core i9-14900HX

► remove from comparison Intel i9-14900HX

The Intel Core i9-14900HX is a high-end CPU based on the Raptor Lake architecture for large and heavy notebooks. The CPU was introduced at the beginning of 2024 and is a slightly higher clocked variant of the older Core i9-13980HX.

The total of 32 threads are divided into P-cores and E-cores, which we already know from Alder-Lake. Here, 8 performance cores (P-cores) with hyperthreading are used and 16 efficiency cores, so that a total of 32 threads can be processed simultaneously. The P-cores clock from 2.2 GHz (base clock) to 5.8 GHz (single-core turbo) and the E-cores from 1.6 GHz to 4.1 GHz.

Performance

Due to the slightly higher maximum clock rates, the single-core performance of the 14900HX in particular increases slightly compared to the 13980HX. Compared to AMD's top model, the Ryzen 9 7945HX or 7945HX3D the 14900HX comes in just behind (on average in our benchmarks). However, the performance depends on the benchmark and the cooling and is usually very comparable.

Graphics

Like the Intel Core i9-12900HX, the Intel Core i9-14900HX offers an integrated graphics unit. The Intel Iris XE architecture continues to serve as the basis. In terms of performance, however, not much has changed with the Intel UHD Graphics 770.

The 14900HX is manufactured on the improved 10nm FinFET process at Intel (Intel 7 process) and is specified with 55 watts of base power and 157 watts of turbo power.

ModelIntel Core i5-14500HXAMD Ryzen 7 5700XIntel Core i9-14900HX
SeriesIntel Raptor Lake-HXAMD Vermeer (Ryzen 5000)Intel Raptor Lake-HX
CodenameRaptor Lake-HX RefreshVermeer (Zen 3)Raptor Lake-HX Refresh
Series: Raptor Lake-HX Raptor Lake-HX Refresh
Intel Core i9-14900HX1.6 - 5.8 GHz24 / 32 cores36 MB L3
Intel Core i7-14700HX3.9 - 5.5 GHz20 / 28 cores30 MB L3
Intel Core i7-14650HX1.6 - 5.2 GHz16 / 24 cores30 MB L3
Intel Core i5-14500HX « 1.8 - 5 GHz14 / 20 cores24 MB L3
Intel Core i5-14450HX1.8 - 4.8 GHz10 / 16 cores20 MB L3
AMD Ryzen 9 5950X3.4 - 4.9 GHz16 / 32 cores64 MB L3
AMD Ryzen 7 5800X3.8 - 4.7 GHz8 / 16 cores32 MB L3
AMD Ryzen 7 5700X « 3.4 - 4.6 GHz8 / 16 cores32 MB L3
AMD Ryzen 5 5600X3.7 - 4.6 GHz6 / 12 cores32 MB L3
Intel Core i9-14900HX « 1.6 - 5.8 GHz24 / 32 cores36 MB L3
Intel Core i7-14700HX3.9 - 5.5 GHz20 / 28 cores30 MB L3
Intel Core i7-14650HX1.6 - 5.2 GHz16 / 24 cores30 MB L3
Intel Core i5-14500HX1.8 - 5 GHz14 / 20 cores24 MB L3
Intel Core i5-14450HX1.8 - 4.8 GHz10 / 16 cores20 MB L3
Clock1800 - 5000 MHz3400 - 4600 MHz1600 - 5800 MHz
L3 Cache24 MB32 MB36 MB
Cores / Threads14 / 20
8 x 4.9 GHz Intel Raptor Cove P-Core
8 x 3.5 GHz Intel Gracemont E-Core
8 / 1624 / 32
8 x 5.8 GHz Intel Raptor Cove P-Core
16 x 4.1 GHz Intel Gracemont E-Core
TDP55 Watt65 Watt55 Watt
TDP Turbo PL2157 Watt157 Watt
Technology10 nm7 nm10 nm
max. Temp.100 °C90 °C100 °C
SocketBGA17441331BGA1964
FeaturesDDR4-3200/LPDDR4x-4266/DDR5-5200/LPDDR5-6400/LPDDR5x-6400 RAM, PCIe 5, Thr. Dir., DL Boost, GNA, MMX, SSE, SSE2, SSE3, SSSE3, SSE4.1, SSE4.2, AVX, AVX2, BMI2, ABM, FMA, ADX, SMEP, SMAP, EIST, TM1, TM2, HT, Turbo, SST, AES-NI, RDRAND, RDSEED, SHAMMX(+), SSE, SSE2, SSE3, SSSE3, SSE4.1, SSE4.2, SSE4A, x86-64, AMD-V, AES, AVX, AVX2, FMA3, SHA, Precision Boost 2DDR4-3200/DDR5-5600 RAM, PCIe 5, Thr. Dir., DL B., GNA, MMX, SSE, SSE2, SSE3, SSSE3, SSE4.1, SSE4.2, AVX, AVX2, BMI2, ABM, FMA, ADX, VMX, SMEP, SMAP, EIST, TM1, TM2, HT, Turbo, SST, AES-NI, RDRAND, RDSEED, SHA
iGPUIntel Iris Xe Graphics G7 96EUs ( - 1550 MHz)Intel UHD Graphics Xe 32EUs (Tiger Lake-H) ( - 1650 MHz)
Architecturex86x86x86
Announced
Manufacturerark.intel.comwww.amd.comark.intel.com
L1 Cache512 KB
L2 Cache4 MB32 MB
Die Size2 x 74 sq. mm; I/O = 125 sq. mm mm2257 mm2
$299 U.S.

Benchmarks

Performance Rating - CB R15 + R20 + 7-Zip + X265 + Blender + 3DM11 CPU - R7 5700X
42.8 pt (59%)
Performance Rating - CB R15 + R20 + 7-Zip + X265 + Blender + 3DM11 CPU - i9-14900HX
55.4 pt (77%)
Cinebench 2024 - Cinebench 2024 CPU Single Core
min: 120.1     avg: 128.1     median: 129.7 (90%)     max: 131.7 Points
Cinebench 2024 - Cinebench 2024 CPU Multi Core
min: 1107     avg: 1634     median: 1718 (32%)     max: 2071 Points
Cinebench R23 - Cinebench R23 Multi Core
13184 Points (12%)
min: 20702     avg: 29638     median: 30560 (28%)     max: 36249 Points
Cinebench R23 - Cinebench R23 Single Core
1499 Points (64%)
min: 1720     avg: 2160     median: 2194 (93%)     max: 2235 Points
Cinebench R20 - Cinebench R20 CPU (Single Core)
595 Points (66%)
min: 657     avg: 827     median: 836.5 (93%)     max: 859 Points
Cinebench R20 - Cinebench R20 CPU (Multi Core)
5405 Points (13%)
min: 8427     avg: 11271     median: 11619 (28%)     max: 13832 Points
Cinebench R15 - Cinebench R15 CPU Multi 64 Bit
2329 Points (15%)
min: 3263     avg: 4503     median: 4611 (29%)     max: 5589 Points
Cinebench R15 - Cinebench R15 CPU Single 64 Bit
253 Points (76%)
min: 247     avg: 306.7     median: 311 (94%)     max: 320 Points
Cinebench R11.5 - Cinebench R11.5 CPU Multi 64 Bit
26.5 Points (34%)
Cinebench R11.5 - Cinebench R11.5 CPU Single 64 Bit
2.9 Points (73%)
Cinebench R10 - Cinebench R10 Rend. Single (32bit)
6527 Points (39%)
Cinebench R10 - Cinebench R10 Rend. Multi (32bit)
42876 Points (31%)
Cinebench R10 - Cinebench R10 Rend. Multi (64bit)
74898 Points (52%)
Cinebench R10 - Cinebench R10 Rend. Single (64bit)
12419 Points (15%)
wPrime 2.10 - wPrime 2.0 1024m *
89.6 s (1%)
wPrime 2.10 - wPrime 2.0 32m *
3.4 s (1%)
WinRAR - WinRAR 4.0
12478 Points (20%)
7-Zip 18.03 - 7-Zip 18.03 Multli Thread 4 runs
65777 MIPS (38%)
min: 87555     avg: 115052     median: 119352 (69%)     max: 136645 MIPS
7-Zip 18.03 - 7-Zip 18.03 Single Thread 4 runs
6522 MIPS (78%)
min: 5452     avg: 7066     median: 7210.5 (86%)     max: 7508 MIPS
X264 HD Benchmark 4.0 - x264 Pass 2
134.7 fps (47%)
X264 HD Benchmark 4.0 - x264 Pass 1
305 fps (70%)
HWBOT x265 Benchmark v2.2 - HWBOT x265 4k Preset
17.1 fps (30%)
min: 22.7     avg: 30.2     median: 30.8 (54%)     max: 38.9 fps
TrueCrypt - TrueCrypt Serpent
1.2 GB/s (0%)
TrueCrypt - TrueCrypt Twofish
1.9 GB/s (33%)
TrueCrypt - TrueCrypt AES
13.4 GB/s (35%)
Blender - Blender 3.3 Classroom CPU *
374 Seconds (5%)
min: 155     avg: 205.7     median: 195 (2%)     max: 298 Seconds
Blender - Blender 2.79 BMW27 CPU *
221 Seconds (2%)
min: 91     avg: 116.4     median: 110.5 (1%)     max: 164 Seconds
R Benchmark 2.5 - R Benchmark 2.5 *
0.5 sec (10%)
min: 0.3609     avg: 0.4     median: 0.4 (8%)     max: 0.4859 sec
3DMark 06 - CPU - 3DMark 06 - CPU
14862 Points (32%)
min: 19451     avg: 20120     median: 20119.5 (43%)     max: 20788 Points
Super Pi mod 1.5 XS 1M - Super Pi mod 1.5 XS 1M *
9.5 s (2%)
Super Pi mod 1.5 XS 2M - Super Pi mod 1.5 XS 2M *
20.4 s (1%)
Super Pi Mod 1.5 XS 32M - Super Pi mod 1.5 XS 32M *
460.7 s (2%)
3DMark Vantage - 3DM Vant. Perf. CPU no Physx
77709 Points (68%)
3DMark 11 - 3DM11 Performance Physics
20010 Points (54%)
min: 16205     avg: 23670     median: 24087 (65%)     max: 29134 Points
3DMark - 3DMark Ice Storm Physics
90009 Points (73%)
92919 Points (76%)
3DMark - 3DMark Ice Storm Extreme Physics
90305 Points (73%)
94249 Points (76%)
3DMark - 3DMark Ice Storm Unlimited Physics
92849 Points (78%)
94081 Points (79%)
3DMark - 3DMark Cloud Gate Physics
20598 Points (52%)
min: 16565     avg: 21097     median: 22021 (56%)     max: 24768 Points
3DMark - 3DMark Fire Strike Standard Physics
27800 Points (50%)
min: 32683     avg: 39023     median: 38894.5 (69%)     max: 46710 Points
3DMark - 3DMark Time Spy CPU
10432 Points (44%)
min: 13797     avg: 16836     median: 16982 (72%)     max: 18847 Points
Geekbench 6.2 - Geekbench 6.2 Single-Core
2186 Points (59%)
min: 2419     avg: 2982     median: 3028.5 (82%)     max: 3129 Points
Geekbench 6.2 - Geekbench 6.2 Multi-Core
9331 Points (37%)
min: 15849     avg: 17715     median: 17918.5 (71%)     max: 19665 Points
Geekbench 5.5 - Geekbench 5.1 - 5.4 64 Bit Single-Core
1647 Points (69%)
min: 1669     avg: 2095     median: 2128.5 (90%)     max: 2210 Points
Geekbench 5.5 - Geekbench 5.1 - 5.4 64 Bit Multi-Core
9353 Points (17%)
min: 8618     avg: 19814     median: 20450 (37%)     max: 23194 Points
Geekbench 5.0 - Geekbench 5.0 64 Bit Single-Core
1587 Points (7%)
min: 2090     avg: 2104     median: 2103.5 (9%)     max: 2117 Points
Geekbench 5.0 - Geekbench 5.0 64 Bit Multi-Core
9214 Points (29%)
min: 19253     avg: 21215     median: 21214.5 (67%)     max: 23176 Points
Geekbench 4.4 - Geekbench 4.1 - 4.4 64 Bit Single-Core
6928 Points (69%)
Geekbench 4.4 - Geekbench 4.1 - 4.4 64 Bit Multi-Core
37730 Points (41%)
Mozilla Kraken 1.1 - Kraken 1.1 Total Score *
579 ms (1%)
min: 428     avg: 447.2     median: 443 (1%)     max: 535 ms
Octane V2 - Octane V2 Total Score
min: 106992     avg: 109933     median: 109745 (96%)     max: 113875 Points
WebXPRT 4 - WebXPRT 4 Score
236 Points (68%)
min: 246     avg: 298.4     median: 302.5 (87%)     max: 316 Points
WebXPRT 3 - WebXPRT 3 Score
310 Points (65%)
min: 279     avg: 327.5     median: 328.5 (68%)     max: 345 Points
CrossMark - CrossMark Overall
1423 Points (55%)
min: 1877     avg: 2157     median: 2183 (84%)     max: 2344 Points
Power Consumption - Prime95 Power Consumption - external Monitor *
185.9 Watt (32%)
min: 89.1     avg: 176.6     median: 180 (31%)     max: 318 Watt
Power Consumption - Cinebench R15 Multi Power Consumption - external Monitor *
155.2 Watt (28%)
min: 185     avg: 239.1     median: 240.4 (44%)     max: 301 Watt
Power Consumption - Idle Power Consumption - external Monitor *
40.9 Watt (27%)
min: 14.8     avg: 23.8     median: 22.4 (15%)     max: 34.6 Watt
Power Consumption - Idle Power Consumption 150cd 1min *
min: 13.5     avg: 19.4     median: 18.1 (20%)     max: 35.2 Watt
Power Consumption - Cinebench R15 Multi Power Efficiency - external Monitor
15 Points per Watt (11%)
min: 16     avg: 19.9     median: 20 (15%)     max: 24.1 Points per Watt

Average Benchmarks AMD Ryzen 7 5700X → 0% n=

Average Benchmarks Intel Core i9-14900HX → 0% n=

- Range of benchmark values for this graphics card
- Average benchmark values for this graphics card
* Smaller numbers mean a higher performance
1 This benchmark is not used for the average calculation

v1.28
log 04. 09:59:04

#0 checking url part for id 17172 +0s ... 0s

#1 checking url part for id 15075 +0s ... 0s

#2 checking url part for id 17163 +0s ... 0s

#3 redirected to Ajax server, took 1720079944 +0s ... 0s

#4 did not recreate cache, as it is less than 5 days old! Created at Thu, 04 Jul 2024 05:15:21 +0200 +0s ... 0s

#5 composed specs +0.006s ... 0.006s

#6 did output specs +0s ... 0.006s

#7 getting avg benchmarks for device 17172 +0s ... 0.006s

#8 got single benchmarks 17172 +0s ... 0.006s

#9 getting avg benchmarks for device 15075 +0.004s ... 0.011s

#10 got single benchmarks 15075 +0.006s ... 0.016s

#11 getting avg benchmarks for device 17163 +0.004s ... 0.02s

#12 got single benchmarks 17163 +0.03s ... 0.05s

#13 got avg benchmarks for devices +0s ... 0.05s

#14 min, max, avg, median took s +0.053s ... 0.103s

#15 return log +0s ... 0.103s

Please share our article, every link counts!
> Expert Reviews and News on Laptops, Smartphones and Tech Innovations > Benchmarks / Tech > Processor Comparison - Head 2 Head
Redaktion, 2017-09- 8 (Update: 2023-07- 1)