Intel Core i5-13500 vs Intel Core i5-13600K
Intel Core i5-13500 ► remove from comparison
Der Intel Core i5-13500 ist ein schneller und sparsamer Desktop-Prozessor auf Basis der Raptor-Lake-Architektur, die bereits im Oktober 2022 vorgestellt wurde. Der Prozessor bietet einen Basistakt von 2,5 GHz und erreicht bis zu 4,8 GHz im Turbo. Die mit Alder-Lake eingeführte hybride CPU-Architektur kommt auch bei den Raptor-Lake-Prozessoren zum Einsatz. Im Vergleich zum Intel Core i5-12500 bietet der Intel Core i5-13500 mehr Kerne, womit eine höhere Gesamtleistung erzielt werden kann. In Summe kann der Intel Core i5-13500 bis zu 20 Threads parallel verarbeiten. Die Performance-Kerne (P-Cores) bieten hierzu Hyperthreading, was den energieeffizienten Kernen (E-Cores) vorenthalten wird.
Performance
Aufgrund der höheren Anzahl an physikalischen Recheneinheiten bietet der Intel Core i5-13500 gegenüber dem Intel Core i5-12500 spürbar mehr Leistung. Beide Prozessoren verfügen über 6 P-Kerne, wenngleich nur der Intel Core i5-13500 zusätzlich mit 8 E-Kernen bestückt ist.
Grafikeinheit
Wie auch der Intel Core i5-12600K bietet der Intel Core i5-13500 eine integrierte Grafikeinheit. Als Basis dient weiterhin die Intel Iris Xe-Architektur. Rein leistungstechnisch hat sich bei der neuen Intel UHD Graphics 770 aber nicht viel verändert.
Leistungsaufnahme
Die TDP des Intel Core i5-13500 beläuft sich auf 65 Watt, mit der Option, diese im Turbo auf bis zu 154 Watt zu erhöhen. Gegenüber dem Intel Core i5-12500 steigt der Energiebedarf etwas an.
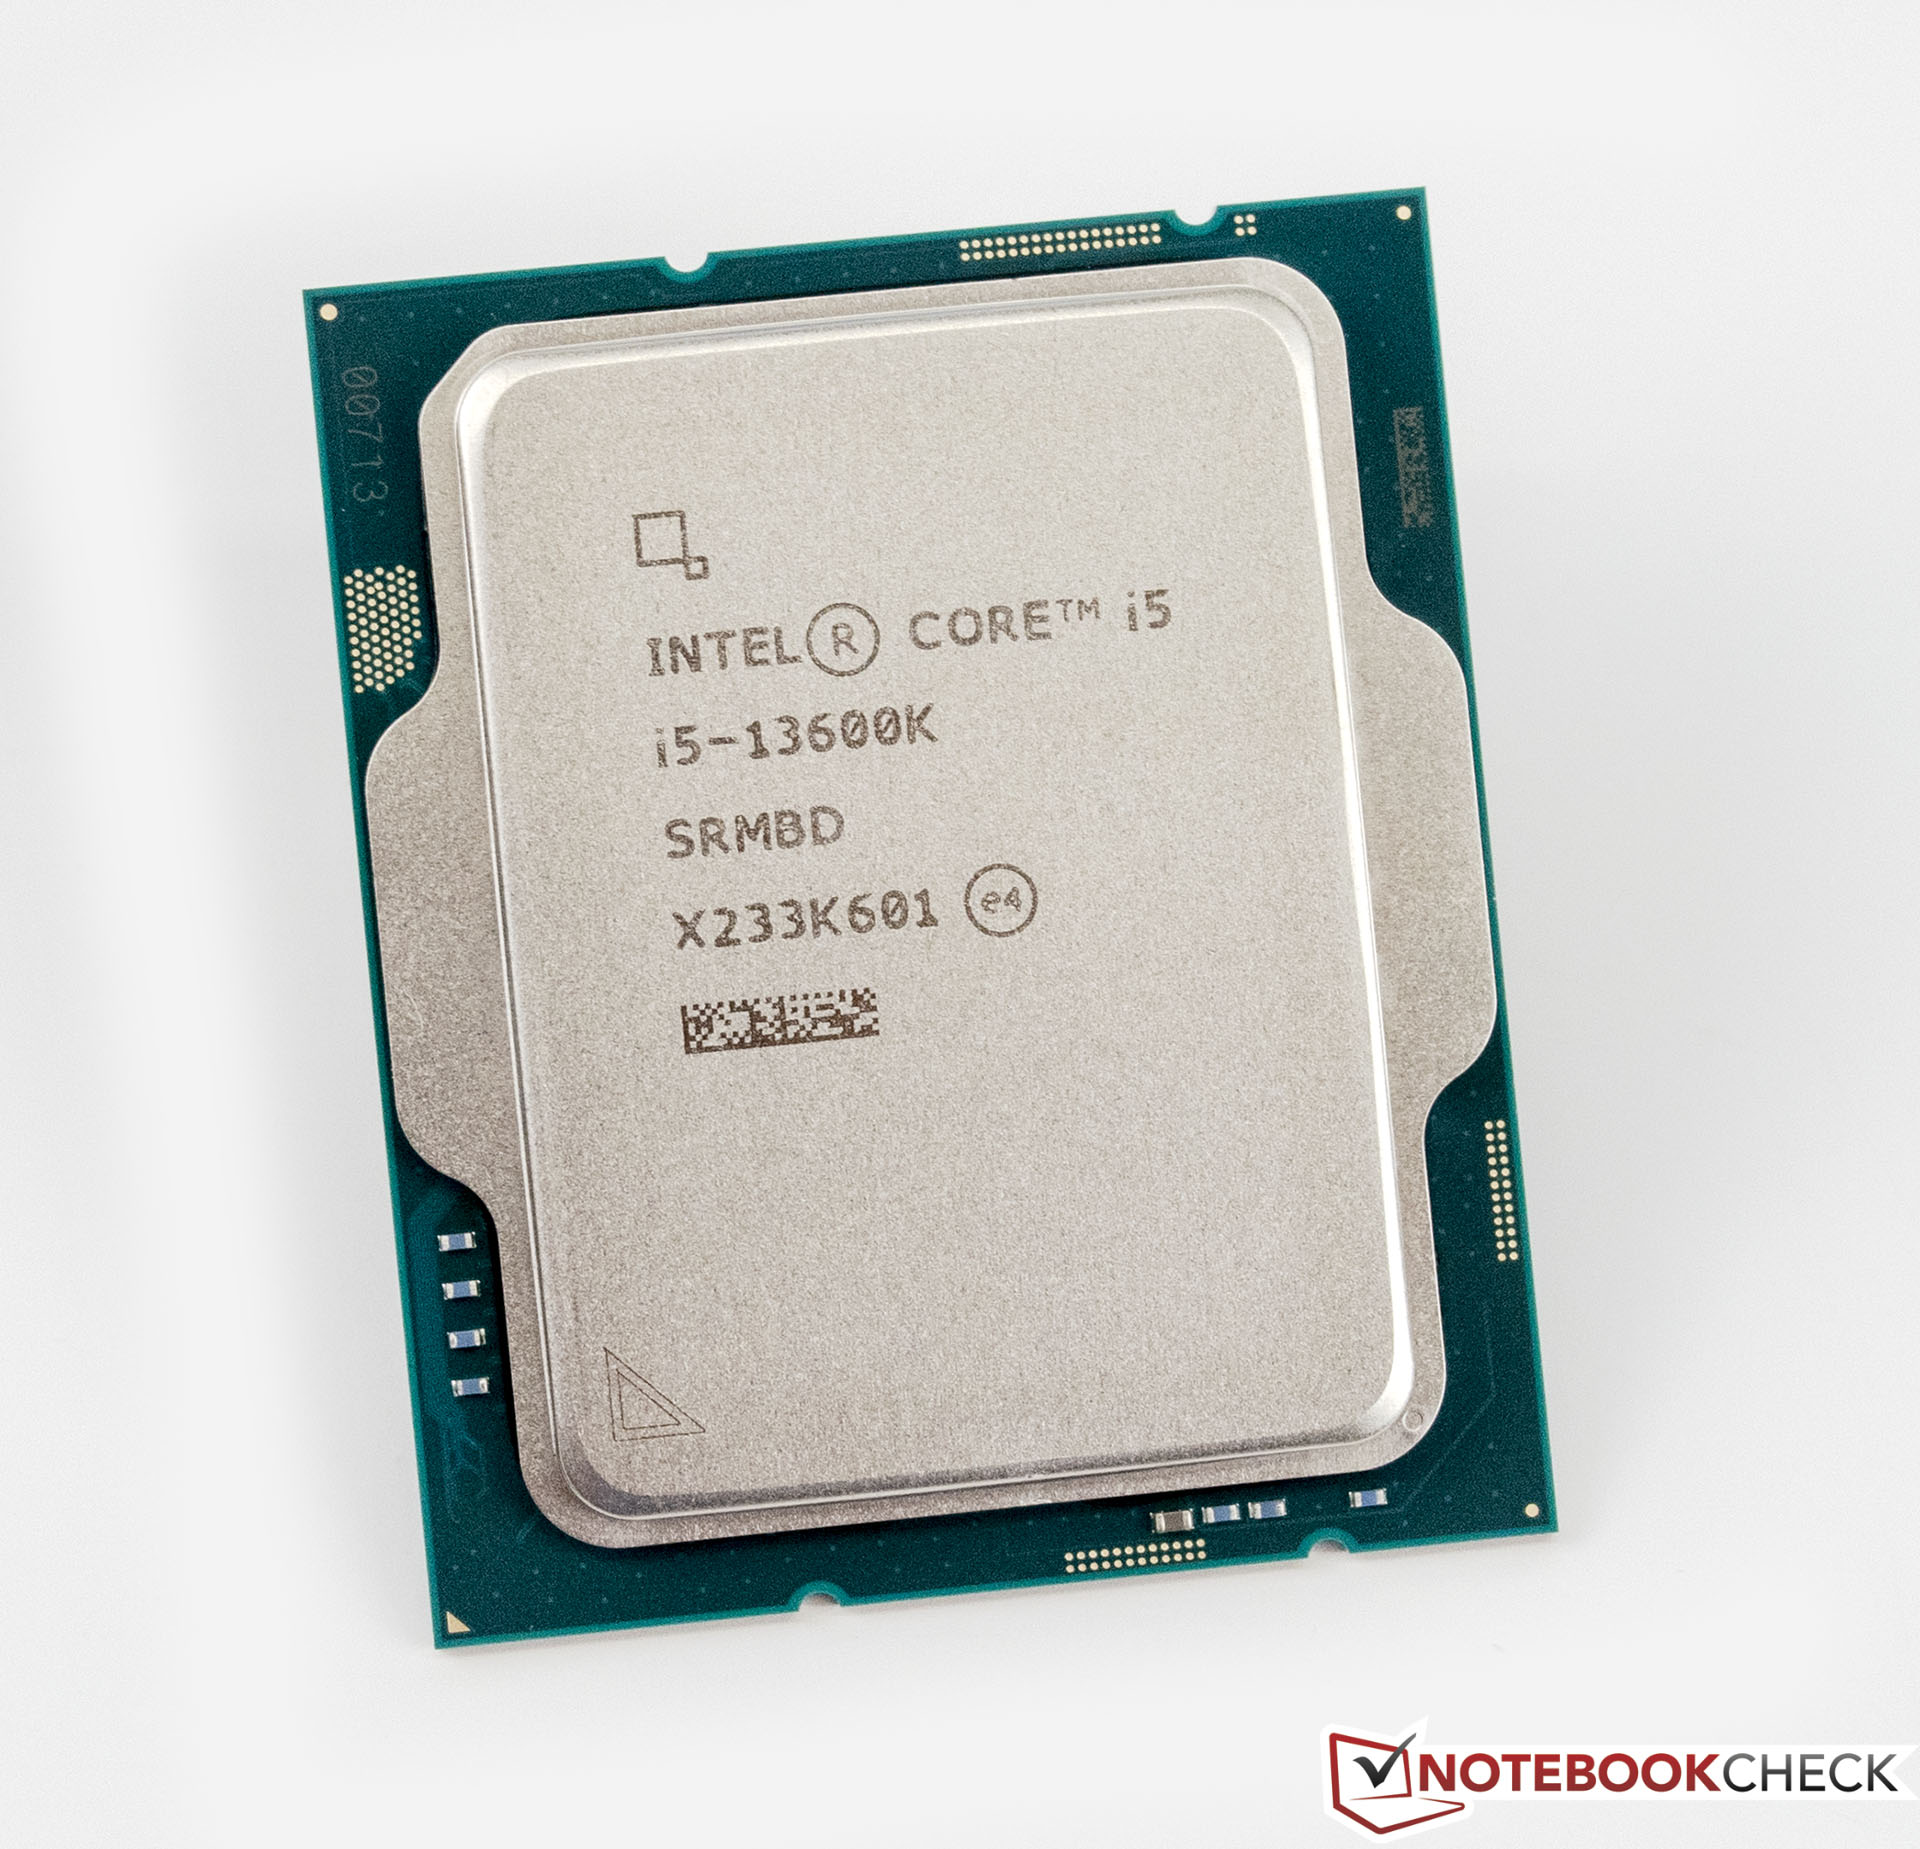
Intel Core i5-13600K ► remove from comparison
The Intel Core i5-13600K is a fast mid-range desktop processor of the Raptor Lake series. It includes a hybrid architecture for the CPU cores with combined 14 cores. Six fast Raptor Cove performance cores (P-cores) with HyperThreading and a clock speed of 3.5 - 5.1 GHz and eight Gracemont efficiency cores without HyperThreading and a clock speed of 2.6 - 3.9 GHz.
Thanks to the faster P-cores and more E-cores, the i5-13600K is significantly faster than the old i5-12600K (especially in multi-threaded workloads.
The 13600K is rated at 125 Watt TDP base power (PL1) and 181 Watt Turbo Power (PL2) and therefore slightly higher than the old Core i5-12600K .
Model Intel Core i5-13500 Intel Core i5-13600K Series Raptor Lake-S Intel Raptor Lake-S Codename Raptor Lake Raptor Lake Series: Raptor Lake-S Raptor Lake Intel Core i9-13900K 3 - 5.8 GHz 24 / 32 36 MB L3 Intel Core i7-13700K 3.4 - 5.4 GHz 16 / 24 30 MB L3 Intel Core i5-13600K « 3.5 - 5.1 GHz 14 / 20 24 MB L3 Intel Core i5-13500 2.5 - 4.8 GHz 14 / 20 24 MB L3 Intel Core i5-13500T 2.5 - 4.6 GHz 14 / 20 24 MB L3
Clock 2500 - 4800 MHz 3500 - 5100 MHz L2 Cache 11.5 MB 20 MB L3 Cache 24 MB 24 MB Cores / Threads 14 / 20 14 / 20 TDP 65 Watt 125 Watt TDP Turbo PL2 154 Watt Technology 10 nm 10 nm Die Size 215 mm2 257 mm2 max. Temp. 100 °C 100 °C Socket LGA 1700 LGA 1700 Features Intel UHD Graphics 770, DDR5 4800 MT/s, DDR4 3200 MT/s Intel UHD Graphics 770, DDR5 5600 MT/s, DDR4 3200 MT/s iGPU Intel UHD Graphics 770 (300 - 1550 MHz)Intel UHD Graphics 770 (300 - 1500 MHz)Architecture x86 x86 Announced Manufacturer www.intel.de www.intel.com $319 U.S.
Benchmarks Performance Rating - CB R15 + R20 + 7-Zip + X265 + Blender + 3DM11 CPU - i5-13500
42.6 pt (59%)
...
...
Performance Rating - CB R15 + R20 + 7-Zip + X265 + Blender + 3DM11 CPU - i5-13600K
49.4 pt (69%)
...
...
Cinebench 2024 - Cinebench 2024 CPU Single Core
107 Points (74%)
Cinebench 2024 - Cinebench 2024 CPU Multi Core
822 Points (15%)
Cinebench R23 - Cinebench R23 Multi Core
14573 Points (14%)
min: 24174 avg: 24221 median: 24221 (22%) max: 24268 Points
CPU TDP ? TDP 65 W TDP 125 W 100% 60% 100%
Cinebench R23 - Cinebench R23 Single Core
1780 Points (76%)
min: 1991 avg: 2001 median: 2000.5 (85%) max: 2010 Points
CPU TDP ? TDP 65 W TDP 125 W 100% 89% 99%
Cinebench R20 - Cinebench R20 CPU (Single Core)
685 Points (76%)
min: 766 avg: 771 median: 770.5 (86%) max: 775 Points
CPU TDP ? TDP 65 W TDP 125 W 100% 88% 99%
Cinebench R20 - Cinebench R20 CPU (Multi Core)
5633 Points (14%)
min: 9217 avg: 9241 median: 9241 (23%) max: 9265 Points
CPU TDP ? TDP 65 W TDP 125 W 100% 61% 99%
Cinebench R15 - Cinebench R15 CPU Multi 64 Bit
2405 Points (15%)
min: 3641 avg: 3642 median: 3642 (23%) max: 3643 Points
CPU TDP ? TDP 65 W TDP 125 W 100% 66% 100%
Cinebench R15 - Cinebench R15 CPU Single 64 Bit
256 Points (77%)
min: 286 avg: 287.5 median: 287.5 (87%) max: 289 Points
CPU TDP ? TDP 65 W TDP 125 W 100% 89% 99%
Cinebench R11.5 - Cinebench R11.5 CPU Multi 64 Bit
28.4 Points (37%)
min: 42.2 avg: 42.3 median: 42.3 (55%) max: 42.38 Points
CPU TDP ? TDP 65 W TDP 125 W 100% 67% 100%
Cinebench R11.5 - Cinebench R11.5 CPU Single 64 Bit
3.1 Points (77%)
min: 3.45 avg: 3.5 median: 3.5 (86%) max: 3.48 Points
CPU TDP ? TDP 65 W TDP 125 W 100% 89% 99%
Cinebench R10 - Cinebench R10 Rend. Single (32bit)
8875 Points (54%)
min: 10710 avg: 10755 median: 10754.5 (65%) max: 10799 Points
CPU TDP ? TDP 65 W TDP 125 W 100% 82% 99%
Cinebench R10 - Cinebench R10 Rend. Multi (32bit)
49300 Points (36%)
min: 67973 avg: 68880 median: 68879.5 (50%) max: 69786 Points
CPU TDP ? TDP 65 W TDP 125 W 97% 71% 100%
Cinebench R10 - Cinebench R10 Rend. Multi (64bit)
79625 Points (55%)
min: 110412 avg: 110969 median: 110969 (77%) max: 111526 Points
CPU TDP ? TDP 65 W TDP 125 W 99% 71% 100%
Cinebench R10 - Cinebench R10 Rend. Single (64bit)
14282 Points (17%)
min: 16074 avg: 16155 median: 16154.5 (20%) max: 16235 Points
CPU TDP ? TDP 65 W TDP 125 W 100% 88% 99%
wPrime 2.10 - wPrime 2.0 1024m *
100.7 s (1%)
min: 172.189 avg: 174.9 median: 174.9 (2%) max: 177.592 s
CPU TDP ? TDP 65 W TDP 125 W 100% 101% 100%
wPrime 2.10 - wPrime 2.0 32m *
4 s (1%)
min: 2.518 avg: 2.5 median: 2.5 (1%) max: 2.527 s
CPU TDP ? TDP 65 W TDP 125 W 100% 100% 100%
7704 Points (12%)
min: 10937 avg: 10967 median: 10967 (17%) max: 10997 Points
CPU TDP ? TDP 65 W TDP 125 W 99% 70% 100%
7-Zip 18.03 - 7-Zip 18.03 Multli Thread 4 runs
55528 MIPS (32%)
min: 89527 avg: 89587 median: 89587 (51%) max: 89647 MIPS
CPU TDP ? TDP 65 W TDP 125 W 100% 62% 100%
7-Zip 18.03 - 7-Zip 18.03 Single Thread 4 runs
5887 MIPS (70%)
min: 6253 avg: 6378 median: 6377.5 (76%) max: 6502 MIPS
CPU TDP ? TDP 65 W TDP 125 W 100% 91% 96%
X264 HD Benchmark 4.0 - x264 Pass 2
134.6 fps (47%)
min: 198.6 avg: 198.8 median: 198.8 (69%) max: 199 fps
CPU TDP ? TDP 65 W TDP 125 W 100% 68% 100%
X264 HD Benchmark 4.0 - x264 Pass 1
306 fps (71%)
min: 387 avg: 387.5 median: 387.5 (89%) max: 388 fps
CPU TDP ? TDP 65 W TDP 125 W 100% 79% 100%
HWBOT x265 Benchmark v2.2 - HWBOT x265 4k Preset
16.3 fps (29%)
min: 27.5 avg: 27.6 median: 27.6 (48%) max: 27.6 fps
CPU TDP ? TDP 65 W TDP 125 W 100% 59% 100%
TrueCrypt - TrueCrypt Serpent
1.3 GB/s (0%)
1.7 GB/s (0%)
CPU TDP ? TDP 65 W TDP 125 W 100% 76% 100%
TrueCrypt - TrueCrypt Twofish
2.3 GB/s (40%)
min: 3.1 avg: 3.2 median: 3.2 (54%) max: 3.2 GB/s
CPU TDP ? TDP 65 W TDP 125 W 97% 72% 100%
TrueCrypt - TrueCrypt AES
12 GB/s (31%)
min: 18.8 avg: 19.1 median: 19.1 (50%) max: 19.4 GB/s
CPU TDP ? TDP 65 W TDP 125 W 97% 62% 100%
Blender - Blender 3.3 Classroom CPU *
399 Seconds (5%)
min: 37 avg: 161.7 median: 224 (3%) max: 224 Seconds
CPU TDP ? TDP 65 W TDP 125 W 104% 100% 102%
Blender - Blender 2.79 BMW27 CPU *
223 Seconds (2%)
135 Seconds (1%)
CPU TDP ? TDP 65 W TDP 125 W 101% 100% 101%
R Benchmark 2.5 - R Benchmark 2.5 *
0.4 sec (10%)
min: 0.4048 avg: 0.4 median: 0.4 (9%) max: 0.405 sec
CPU TDP ? TDP 65 W TDP 125 W 101% 100% 101%
3DMark 06 - CPU - 3DMark 06 - CPU
14875 Points (32%)
17627 Points (38%)
CPU TDP ? TDP 65 W 100% 84%
Super Pi mod 1.5 XS 1M - Super Pi mod 1.5 XS 1M *
7.8 s (2%)
min: 6.471 avg: 6.5 median: 6.5 (1%) max: 6.58 s
CPU TDP ? TDP 65 W TDP 125 W 100% 100% 100%
Super Pi mod 1.5 XS 2M - Super Pi mod 1.5 XS 2M *
17.2 s (1%)
min: 14.876 avg: 14.9 median: 14.9 (1%) max: 14.993 s
CPU TDP ? TDP 65 W TDP 125 W 100% 100% 100%
Super Pi Mod 1.5 XS 32M - Super Pi mod 1.5 XS 32M *
min: 328.929 avg: 331.4 median: 331.4 (1%) max: 333.798 s
CPU TDP ? TDP 125 W 100% 100%
3DMark Vantage - 3DM Vant. Perf. CPU no Physx
69725 Points (61%)
97718 Points (86%)
CPU TDP ? TDP 65 W 100% 71%
3DMark 11 - 3DM11 Performance Physics
18026 Points (49%)
min: 30358 avg: 30419 median: 30419 (82%) max: 30480 Points
CPU TDP ? TDP 65 W TDP 125 W 100% 59% 100%
3DMark - 3DMark Ice Storm Physics
84456 Points (69%)
min: 86734 avg: 86952 median: 86952 (71%) max: 87170 Points
CPU TDP ? TDP 65 W TDP 125 W 100% 97% 99%
3DMark - 3DMark Ice Storm Extreme Physics
83392 Points (68%)
min: 87784 avg: 87861 median: 87860.5 (71%) max: 87937 Points
CPU TDP ? TDP 65 W TDP 125 W 100% 95% 100%
3DMark - 3DMark Ice Storm Unlimited Physics
81778 Points (69%)
min: 88547 avg: 89321 median: 89321 (75%) max: 90095 Points
CPU TDP ? TDP 65 W TDP 125 W 100% 91% 98%
3DMark - 3DMark Cloud Gate Physics
17891 Points (45%)
min: 26359 avg: 26394 median: 26394 (67%) max: 26429 Points
CPU TDP ? TDP 65 W TDP 125 W 100% 68% 100%
3DMark - 3DMark Fire Strike Standard Physics
26263 Points (47%)
min: 35386 avg: 35395 median: 35395 (63%) max: 35404 Points
CPU TDP ? TDP 65 W TDP 125 W 100% 74% 100%
3DMark - 3DMark Time Spy CPU
9655 Points (41%)
min: 17079 avg: 17102 median: 17101.5 (72%) max: 17124 Points
CPU TDP ? TDP 65 W TDP 125 W 100% 56% 100%
Geekbench 6.2 - Geekbench 6.2 Single-Core
2483 Points (67%)
Geekbench 6.2 - Geekbench 6.2 Multi-Core
10348 Points (41%)
Geekbench 5.5 - Geekbench 5.1 - 5.4 64 Bit Single-Core
1805 Points (76%)
min: 1967 avg: 1973 median: 1973 (83%) max: 1979 Points
CPU TDP ? TDP 65 W TDP 125 W 99% 91% 100%
Geekbench 5.5 - Geekbench 5.1 - 5.4 64 Bit Multi-Core
10322 Points (18%)
min: 16651 avg: 16671 median: 16670.5 (30%) max: 16690 Points
CPU TDP ? TDP 65 W TDP 125 W 100% 62% 100%
Geekbench 5.0 - Geekbench 5.0 64 Bit Single-Core
1749 Points (8%)
min: 1931 avg: 1948 median: 1947.5 (8%) max: 1964 Points
CPU TDP ? TDP 65 W TDP 125 W 98% 89% 100%
Geekbench 5.0 - Geekbench 5.0 64 Bit Multi-Core
10213 Points (32%)
min: 16497 avg: 16566 median: 16566 (52%) max: 16635 Points
CPU TDP ? TDP 65 W TDP 125 W 100% 61% 99%
Geekbench 4.4 - Geekbench 4.1 - 4.4 64 Bit Single-Core
7379 Points (74%)
min: 8618 avg: 8625 median: 8624.5 (86%) max: 8631 Points
CPU TDP ? TDP 65 W TDP 125 W 100% 85% 100%
Geekbench 4.4 - Geekbench 4.1 - 4.4 64 Bit Multi-Core
39094 Points (43%)
min: 60407 avg: 61014 median: 61014 (67%) max: 61621 Points
CPU TDP ? TDP 65 W TDP 125 W 98% 63% 100%
Mozilla Kraken 1.1 - Kraken 1.1 Total Score *
519 ms (1%)
min: 467 avg: 468 median: 468 (1%) max: 469 ms
CPU TDP ? TDP 65 W TDP 125 W 100% 100% 100%
WebXPRT 4 - WebXPRT 4 Score
254 Points (73%)
288 Points (83%)
CPU TDP ? TDP 65 W TDP 125 W 100% 88% 100%
WebXPRT 3 - WebXPRT 3 Score
266 Points (55%)
min: 329 avg: 331 median: 331 (69%) max: 333 Points
CPU TDP ? TDP 65 W TDP 125 W 100% 80% 99%
CrossMark - CrossMark Overall
1549 Points (59%)
min: 2237 avg: 2254 median: 2254 (86%) max: 2271 Points
CPU TDP ? TDP 65 W TDP 125 W 100% 68% 99%
Power Consumption - Prime95 Power Consumption - external Monitor *
98.7 Watt (17%)
min: 278 avg: 313 median: 313 (54%) max: 348 Watt
CPU TDP ? TDP 65 W TDP 125 W 100% 207% 130%
Power Consumption - Cinebench R15 Multi Power Consumption - external Monitor *
121 Watt (22%)
min: 245 avg: 265.5 median: 265.5 (48%) max: 286 Watt
CPU TDP ? TDP 65 W TDP 125 W 100% 163% 116%
Power Consumption - Idle Power Consumption - external Monitor *
7.9 Watt (5%)
min: 69.3 avg: 73.3 median: 73.3 (48%) max: 77.3 Watt
CPU TDP ? TDP 65 W TDP 125 W 111% 194% 100%
Power Consumption - Cinebench R15 Multi Power Efficiency - external Monitor
19.9 Points per Watt (15%)
min: 12.7 avg: 13.8 median: 13.8 (10%) max: 14.9 Points per Watt
CPU TDP ? TDP 65 W TDP 125 W 64% 100% 75%
Average Benchmarks Intel Core i5-13500 → 100% n=47 Average Benchmarks Intel Core i5-13600K → 129% n=47
- Range of benchmark values for this graphics card
- Average benchmark values for this graphics card
* Smaller numbers mean a higher performance
1 This benchmark is not used for the average calculation
v1.28
log 04. 17:09:12
#0 checking url part for id 17901 +0s ... 0s
#1 checking url part for id 14626 +0s ... 0s
#2 redirected to Ajax server, took 1720105752 +0s ... 0s
#3 did not recreate cache, as it is less than 5 days old! Created at Thu, 04 Jul 2024 05:15:21 +0200 +0s ... 0s
#4 composed specs +0.004s ... 0.004s
#5 did output specs +0s ... 0.004s
#6 getting avg benchmarks for device 17901 +0.004s ... 0.008s
#7 got single benchmarks 17901 +0.005s ... 0.012s
#8 getting avg benchmarks for device 14626 +0.003s ... 0.016s
#9 got single benchmarks 14626 +0.005s ... 0.021s
#10 got avg benchmarks for devices +0s ... 0.021s
#11 min, max, avg, median took s +0.049s ... 0.07s
#12 return log +0.002s ... 0.072s
Please share our article, every link counts!
Redaktion, 2017-09- 8 (Update: 2023-07- 1)
 Deutsch
 English
 Español
 Français
 Italiano
 Nederlands
 Polski
 Português
 Русский
 Türkçe
 Svenska
 Chinese
 Magyar