Notebookcheck Logo

Intel Core i5-13500 vs Apple M3 Max 14-Core vs Apple M3

Intel Core i5-13500

► remove from comparison

Der Intel Core i5-13500 ist ein schneller und sparsamer Desktop-Prozessor auf Basis der Raptor-Lake-Architektur, die bereits im Oktober 2022 vorgestellt wurde. Der Prozessor bietet einen Basistakt von 2,5 GHz und erreicht bis zu 4,8 GHz im Turbo. Die mit Alder-Lake eingeführte hybride CPU-Architektur kommt auch bei den Raptor-Lake-Prozessoren zum Einsatz. Im Vergleich zum Intel Core i5-12500 bietet der Intel Core i5-13500 mehr Kerne, womit eine höhere Gesamtleistung erzielt werden kann. In Summe kann der Intel Core i5-13500 bis zu 20 Threads parallel verarbeiten. Die Performance-Kerne (P-Cores) bieten hierzu Hyperthreading, was den energieeffizienten Kernen (E-Cores) vorenthalten wird.

Performance

Aufgrund der höheren Anzahl an physikalischen Recheneinheiten bietet der Intel Core i5-13500 gegenüber dem Intel Core i5-12500 spürbar mehr Leistung. Beide Prozessoren verfügen über 6 P-Kerne, wenngleich nur der Intel Core i5-13500 zusätzlich mit 8 E-Kernen bestückt ist.

Grafikeinheit

Wie auch der Intel Core i5-12600K bietet der Intel Core i5-13500 eine integrierte Grafikeinheit. Als Basis dient weiterhin die Intel Iris Xe-Architektur. Rein leistungstechnisch hat sich bei der neuen Intel UHD Graphics 770 aber nicht viel verändert. 

Leistungsaufnahme

Die TDP des Intel Core i5-13500 beläuft sich auf 65 Watt, mit der Option, diese im Turbo auf bis zu 154 Watt zu erhöhen. Gegenüber dem Intel Core i5-12500 steigt der Energiebedarf etwas an.

Apple M3 Max 14-Core

► remove from comparison Apple Apple M3 Max 14-Core

The Apple M3 Max 14 core CPU is a system on a chip (SoC) from Apple for notebooks that was introduced towards the end of 2023. It integrates a new 14-core CPU with 10 performance cores with up to 4.06 GHz and 4 efficiency cores with 2.8 GHz. There is also a more powerful 16-core variant with 40 GPU cores.

Thanks to the higher clock rates and architectural improvements, the processor performance is also significantly better than the M2 Max in benchmarks and can keep up with the fastest mobile CPUs.

The M3 also integrates a new graphics card with dynamic caching, mesh shading and ray tracing acceleration via hardware. In the cheaper model, 30 of the chip's 40 cores are used and support up to 5 displays simultaneously (internal and 4 external).

GPU and CPU can jointly access the shared memory on the package (unified memory). This is available in 36 and 96 GB variants and offers 400 GB/s maximum bandwidth (512 bit bus).

The integrated 16-core Neural Engine has also been revised and now offers 18 TOPS peak performance (compared to 15.8 TOPS in the M2 but 35 TOPS in the new A17 Pro). The video engine now also supports AV1 decoding in hardware. H.264, HEVC and ProRes (RAW) can still be decoded and encoded. Like its predecessor, the Max chip offers two video engines and can therefore encode and decode two streams simultaneously.

Unfortunately, the integrated WLAN only continues to support WiFi 6E (no WiFi 7), unlike the small M3 SoC thunderbolt 4 is also supported (max 40 Gbit/s).

The chip is manufactured in the current 3nm process (N3B) at TSMC and contains 92 billion transistors (+37% vs. Apple M2 Max).

Apple M3

► remove from comparison Apple M3

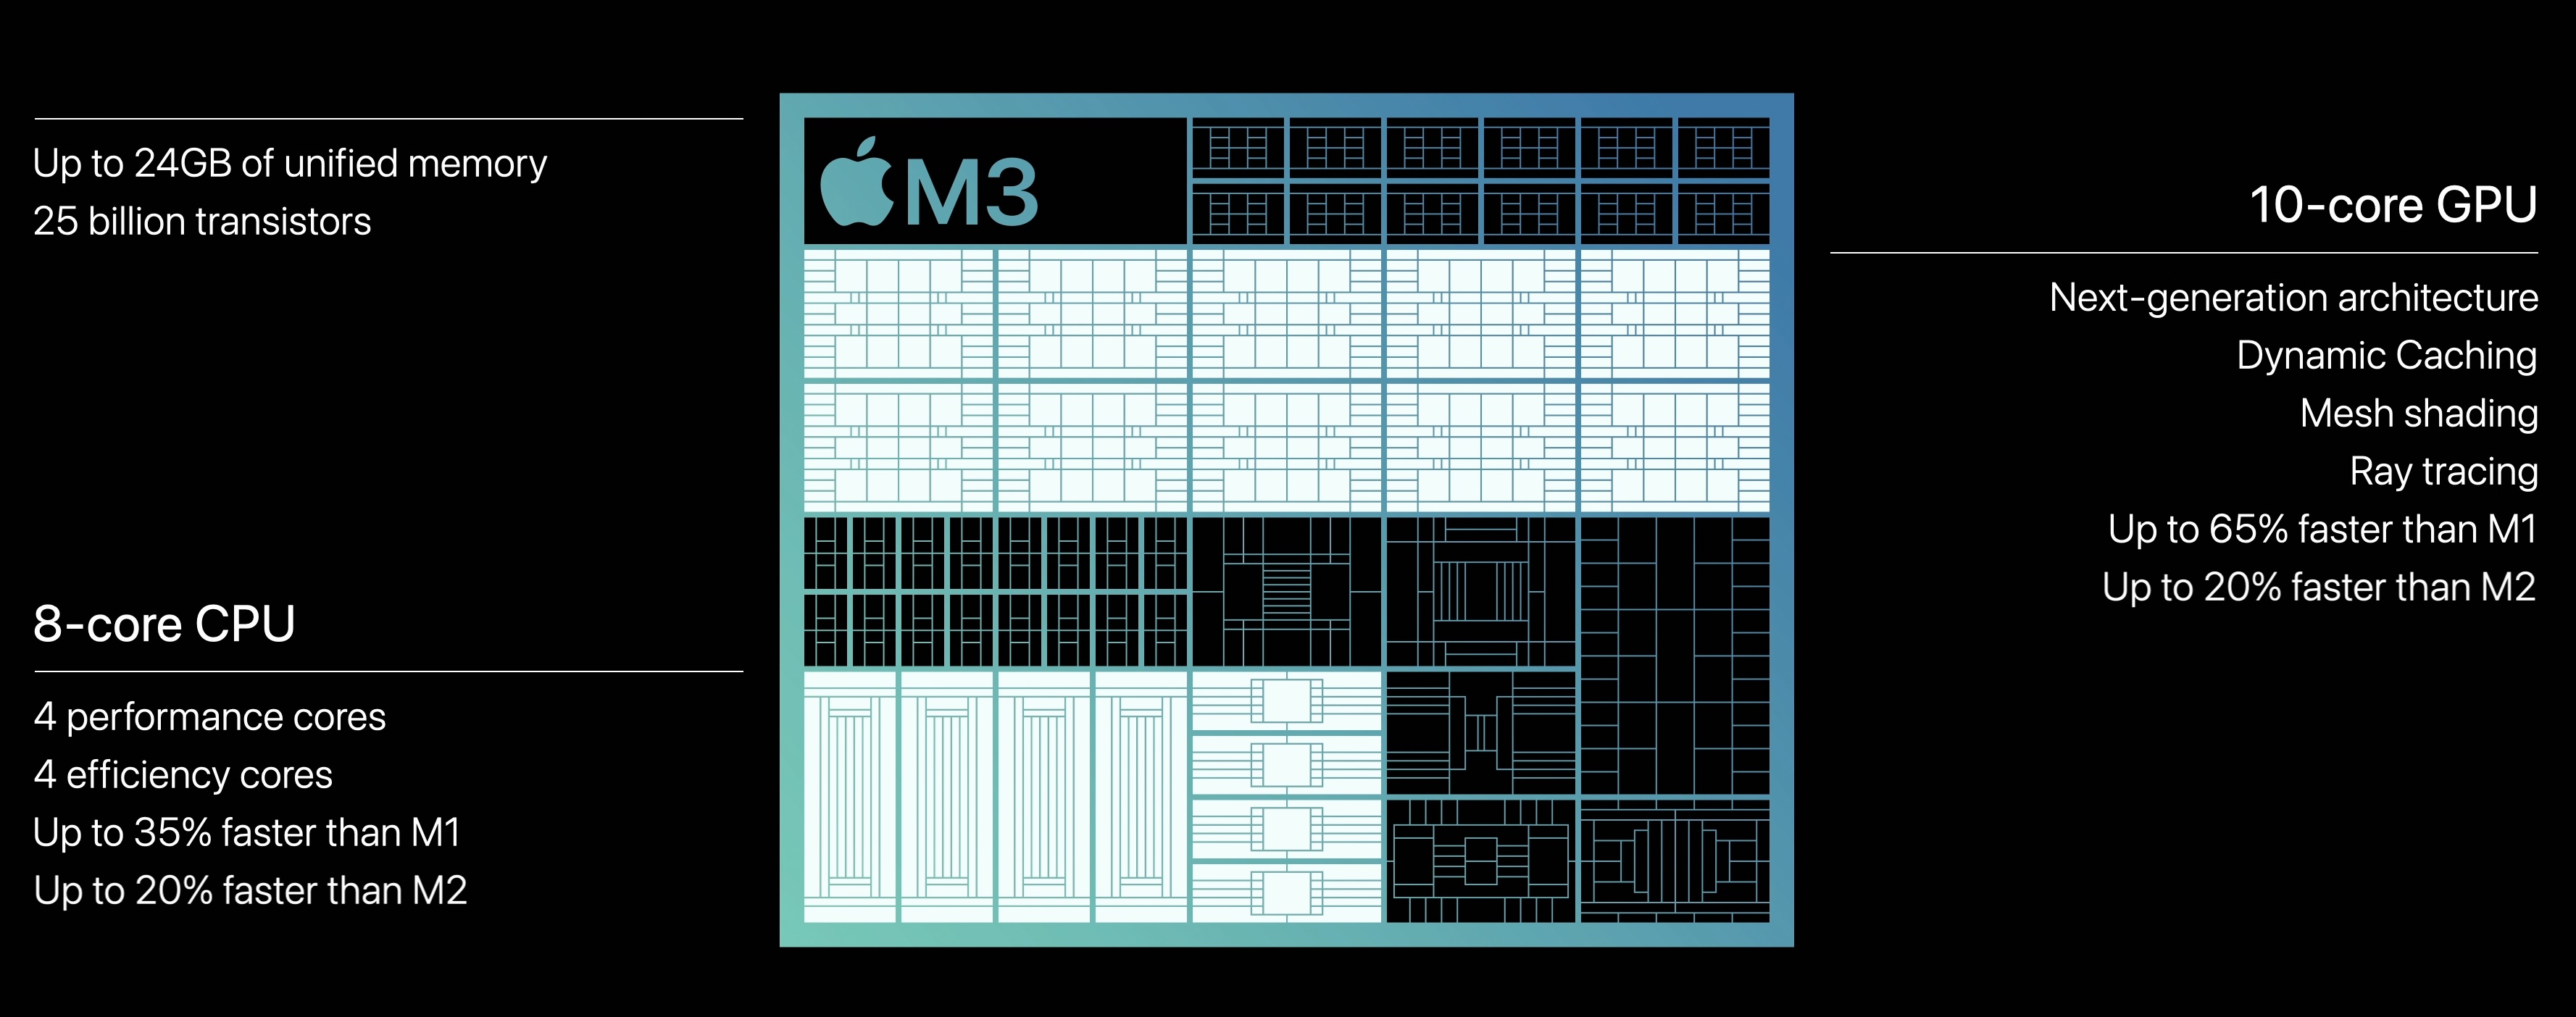
The Apple M3 is a system on a chip (SoC) from Apple for notebooks that was introduced in late 2023. It integrates a new 8-core CPU with 4 performance cores with up to 4.06 GHz and 4 efficiency cores running at up to 2.75 GHz. Apple claims that the CPU is up to 20% faster than in the old Apple M2 (3.5 GHz)

Due to the higher clock speeds and architecture improvements, the processor performance is also significantly better than the M2 in benchmarks (see e.g. Geekbench below) and can keep up with the fastest CPUs in short single-core tests (like the Raptor Lake i9-13950HX).

The M3 also integrates a new graphics adapter with dynamic caching, mesh shading and ray tracing acceleration. According to Apple, it is 20% faster than the GPU in the M2. The chip integrates again 10 GPU cores, but the cheaper variant only offers 8 cores (e.g. in the entry iMac). Furthermore, the GPU only supports 2 displays (an additional 6K60 display to the internal one).

Both GPU and CPU can access the unified memory on the package together. It is still available in 8, 16 and 24 GB variants and offers the same 100 GB/s maximum bandwidth (unlike the Pro models that feature a reduced memory bandwidth). 

The integrated 16-core Neural Engine has also been revised and now offers 18 TOPS peak performance (versus 15.8 TOPS in the M2 but 35 TOPS in the new A17 Pro). The video engine now supports AV1 decoding in hardware. H.264, HEVC and ProRes (RAW) can still be decoded and encoded.

Unfortunately, the integrated wireless network module only supports Wi-Fi 6E (no Wi-Fi 7) and due to the support of only a single external monitor, the chip also has to make do with no Thunderbolt 4 (Thunderbolt 3 / USB 4 support only for up to 40 Gbit/s).

The chip is manufactured on the current 3nm TSMC process (N3B most likely) and contains 25 billion transistors (+25% vs. Apple M2). The 3nm process should also contribute to the excellent efficiency of the chip. Under load, the M3 CPU consumes approximately 20 Watt.

ModelIntel Core i5-13500Apple M3 Max 14-CoreApple M3
Series Raptor Lake-SApple Apple M3Apple Apple M3
CodenameRaptor Lake
Series: Apple M3
Intel Core i9-13900K3 - 5.8 GHz24 / 32 cores36 MB L3
Intel Core i7-13700K3.4 - 5.4 GHz16 / 24 cores30 MB L3
Intel Core i5-13600K3.5 - 5.1 GHz14 / 20 cores24 MB L3
Intel Core i5-13500 « 2.5 - 4.8 GHz14 / 20 cores24 MB L3
Intel Core i5-13500T2.5 - 4.6 GHz14 / 20 cores24 MB L3
Apple M3 Max 16-Core2.75 - 4.06 GHz16 / 16 cores
Apple M3 Max 14-Core « 2.75 - 4.06 GHz14 / 14 cores
Apple M3 Pro 12-Core2.75 - 4.06 GHz12 / 12 cores
Apple M3 Pro 11-Core2.75 - 4.06 GHz11 / 11 cores
Apple M32.75 - 4.06 GHz8 / 8 cores
Apple M3 Max 16-Core2.75 - 4.06 GHz16 / 16 cores
Apple M3 Max 14-Core2.75 - 4.06 GHz14 / 14 cores
Apple M3 Pro 12-Core2.75 - 4.06 GHz12 / 12 cores
Apple M3 Pro 11-Core2.75 - 4.06 GHz11 / 11 cores
Apple M3 « 2.75 - 4.06 GHz8 / 8 cores
Clock2500 - 4800 MHz2748 - 4056 MHz2748 - 4056 MHz
L2 Cache11.5 MB4 MB
L3 Cache24 MB
Cores / Threads14 / 20
6 x 4.8 GHz Intel Raptor Cove P-Core
8 x 3.5 GHz Intel Gracemont E-Core
14 / 14
10 x 4.1 GHz Apple M3 P-Core
4 x 2.7 GHz Apple M3 E-Core
8 / 8
4 x 4.1 GHz Apple M3 P-Core
4 x 2.7 GHz Apple M3 E-Core
TDP65 Watt78 Watt
TDP Turbo PL2154 Watt
Technology10 nm3 nm3 nm
Die Size215 mm2
max. Temp.100 °C
SocketLGA 1700
FeaturesIntel UHD Graphics 770, DDR5 4800 MT/s, DDR4 3200 MT/sARMv8 Instruction SetARMv8 Instruction Set
iGPUIntel UHD Graphics 770 (300 - 1550 MHz)Apple M3 Max 30-Core GPUApple M3 10-Core GPU
Architecturex86ARMARM
Announced
Manufacturerwww.intel.dewww.apple.comwww.apple.com
Transistors92000 Million25000 Million

Benchmarks

Performance Rating - CB R15 + R20 + 7-Zip + X265 + Blender + 3DM11 CPU - i5-13500
42.6 pt (59%)
Cinebench 2024 - Cinebench 2024 CPU Single Core
107 Points (74%)
132%
1 M3 +
min: 140     avg: 141     median: 141 (98%)     max: 142 Points
Cinebench 2024 - Cinebench 2024 CPU Multi Core
822 Points (15%)
73%
1 M3 +
min: 576     avg: 622     median: 599.5 (11%)     max: 712 Points
Cinebench R23 - Cinebench R23 Multi Core
14573 Points (14%)
71%
1 M3 +
min: 10074     avg: 10275     median: 10298 (10%)     max: 10454 Points
Cinebench R23 - Cinebench R23 Single Core
1780 Points (76%)
107%
1 M3 +
min: 1900     avg: 1901     median: 1900 (81%)     max: 1904 Points
Cinebench R20 - Cinebench R20 CPU (Single Core)
685 Points (76%)
74%
1 M3 +
504 Points (56%)
Cinebench R20 - Cinebench R20 CPU (Multi Core)
5633 Points (14%)
50%
1 M3 +
2818 Points (7%)
Cinebench R15 - Cinebench R15 CPU Multi 64 Bit
2405 Points (15%)
62%
1 M3 +
1499 Points (9%)
Cinebench R15 - Cinebench R15 CPU Single 64 Bit
256 Points (77%)
106%
1 M3 +
271 Points (82%)
Cinebench R11.5 - Cinebench R11.5 CPU Multi 64 Bit
28.4 Points (37%)
Cinebench R11.5 - Cinebench R11.5 CPU Single 64 Bit
3.1 Points (77%)
Cinebench R10 - Cinebench R10 Rend. Single (32bit)
8875 Points (54%)
Cinebench R10 - Cinebench R10 Rend. Multi (32bit)
49300 Points (36%)
Cinebench R10 - Cinebench R10 Rend. Multi (64bit)
79625 Points (55%)
Cinebench R10 - Cinebench R10 Rend. Single (64bit)
14282 Points (17%)
wPrime 2.10 - wPrime 2.0 1024m *
100.7 s (1%)
wPrime 2.10 - wPrime 2.0 32m *
4 s (1%)
WinRAR - WinRAR 4.0
7704 Points (12%)
7-Zip 18.03 - 7-Zip 18.03 Multli Thread 4 runs
55528 MIPS (32%)
7-Zip 18.03 - 7-Zip 18.03 Single Thread 4 runs
5887 MIPS (70%)
X264 HD Benchmark 4.0 - x264 Pass 2
134.6 fps (47%)
X264 HD Benchmark 4.0 - x264 Pass 1
306 fps (71%)
HWBOT x265 Benchmark v2.2 - HWBOT x265 4k Preset
16.3 fps (29%)
TrueCrypt - TrueCrypt Serpent
1.3 GB/s (0%)
TrueCrypt - TrueCrypt Twofish
2.3 GB/s (40%)
TrueCrypt - TrueCrypt AES
12 GB/s (31%)
Blender - Blender 3.3 Classroom CPU *
399 Seconds (5%)
98%
1 M3 +
min: 491     avg: 590     median: 517 (7%)     max: 761 Seconds
Blender - Blender 2.79 BMW27 CPU *
223 Seconds (2%)
98%
1 M3 +
min: 474     avg: 509     median: 494 (3%)     max: 558 Seconds
R Benchmark 2.5 - R Benchmark 2.5 *
0.4 sec (10%)
3DMark 06 - CPU - 3DMark 06 - CPU
14875 Points (32%)
Super Pi mod 1.5 XS 1M - Super Pi mod 1.5 XS 1M *
7.8 s (2%)
Super Pi mod 1.5 XS 2M - Super Pi mod 1.5 XS 2M *
17.2 s (1%)
3DMark Vantage - 3DM Vant. Perf. CPU no Physx
69725 Points (61%)
3DMark 11 - 3DM11 Performance Physics
18026 Points (49%)
3DMark - 3DMark Ice Storm Physics
84456 Points (69%)
3DMark - 3DMark Ice Storm Extreme Physics
83392 Points (68%)
3DMark - 3DMark Ice Storm Unlimited Physics
81778 Points (69%)
3DMark - 3DMark Cloud Gate Physics
17891 Points (45%)
3DMark - 3DMark Fire Strike Standard Physics
26263 Points (47%)
3DMark - 3DMark Time Spy CPU
9655 Points (41%)
Geekbench 6.2 - Geekbench 6.2 Single-Core
2483 Points (67%)
124%
1 M3 +
min: 3026     avg: 3077     median: 3076 (83%)     max: 3130 Points
Geekbench 6.2 - Geekbench 6.2 Multi-Core
10348 Points (41%)
116%
1 M3 +
min: 11863     avg: 11984     median: 11992 (47%)     max: 12066 Points
Geekbench 5.5 - Geekbench 5.1 - 5.4 64 Bit Single-Core
1805 Points (76%)
130%
1 M3 +
min: 2256     avg: 2316     median: 2342 (99%)     max: 2350 Points
Geekbench 5.5 - Geekbench 5.1 - 5.4 64 Bit Multi-Core
10322 Points (18%)
104%
1 M3 +
min: 10570     avg: 10697     median: 10748 (19%)     max: 10774 Points
Geekbench 5.0 - Geekbench 5.0 64 Bit Single-Core
1749 Points (8%)
Geekbench 5.0 - Geekbench 5.0 64 Bit Multi-Core
10213 Points (32%)
Geekbench 4.4 - Geekbench 4.1 - 4.4 64 Bit Single-Core
7379 Points (74%)
Geekbench 4.4 - Geekbench 4.1 - 4.4 64 Bit Multi-Core
39094 Points (43%)
Mozilla Kraken 1.1 - Kraken 1.1 Total Score *
519 ms (1%)
100%
1 M3 +
min: 362.8     avg: 366.4     median: 363.1 (0%)     max: 373.2 ms
Octane V2 - Octane V2 Total Score
100%
1 M3 +
min: 96622     avg: 97216     median: 96933 (85%)     max: 98093 Points
WebXPRT 4 - WebXPRT 4 Score
254 Points (73%)
124%
1 M3 +
min: 313     avg: 314     median: 314 (90%)     max: 315 Points
WebXPRT 3 - WebXPRT 3 Score
266 Points (55%)
167%
1 M3 +
min: 423     avg: 438.7     median: 445 (93%)     max: 448 Points
CrossMark - CrossMark Overall
1549 Points (59%)
119%
1 M3 +
min: 1847     avg: 1850     median: 1847 (71%)     max: 1857 Points
Power Consumption - Prime95 Power Consumption - external Monitor *
98.7 Watt (17%)
Power Consumption - Cinebench R15 Multi Power Consumption - external Monitor *
121 Watt (22%)
Power Consumption - Idle Power Consumption - external Monitor *
7.9 Watt (5%)
104%
1 M3 +
min: 2.63     avg: 2.8     median: 2.8 (2%)     max: 2.87 Watt
Power Consumption - Idle Power Consumption 150cd 1min *
100%
1 M3 +
min: 3.94     avg: 4.4     median: 4.4 (5%)     max: 4.7 Watt
Power Consumption - Cinebench R15 Multi Power Efficiency - external Monitor
19.9 Points per Watt (15%)

Average Benchmarks Intel Core i5-13500 → 0% n=

Average Benchmarks Apple M3 → 0% n=

- Range of benchmark values for this graphics card
- Average benchmark values for this graphics card
* Smaller numbers mean a higher performance
1 This benchmark is not used for the average calculation

v1.28
log 02. 14:30:05

#0 checking url part for id 17901 +0s ... 0s

#1 checking url part for id 16356 +0s ... 0s

#2 checking url part for id 15110 +0s ... 0s

#3 redirected to Ajax server, took 1719923405 +0s ... 0s

#4 did not recreate cache, as it is less than 5 days old! Created at Mon, 01 Jul 2024 05:15:43 +0200 +0s ... 0s

#5 composed specs +0.007s ... 0.007s

#6 did output specs +0s ... 0.007s

#7 getting avg benchmarks for device 17901 +0.004s ... 0.012s

#8 got single benchmarks 17901 +0.005s ... 0.016s

#9 getting avg benchmarks for device 16356 +0.001s ... 0.017s

#10 got single benchmarks 16356 +0s ... 0.017s

#11 getting avg benchmarks for device 15110 +0.001s ... 0.018s

#12 got single benchmarks 15110 +0.005s ... 0.023s

#13 got avg benchmarks for devices +0s ... 0.023s

#14 min, max, avg, median took s +0.037s ... 0.06s

#15 return log +0s ... 0.06s

Please share our article, every link counts!
> Expert Reviews and News on Laptops, Smartphones and Tech Innovations > Benchmarks / Tech > Processor Comparison - Head 2 Head
Redaktion, 2017-09- 8 (Update: 2023-07- 1)