Notebookcheck Logo

Intel Core i5-13400F vs Intel Core i7-1370P vs Intel Core i5-13400

Intel Core i5-13400F

► remove from comparison Intel i5-13400F

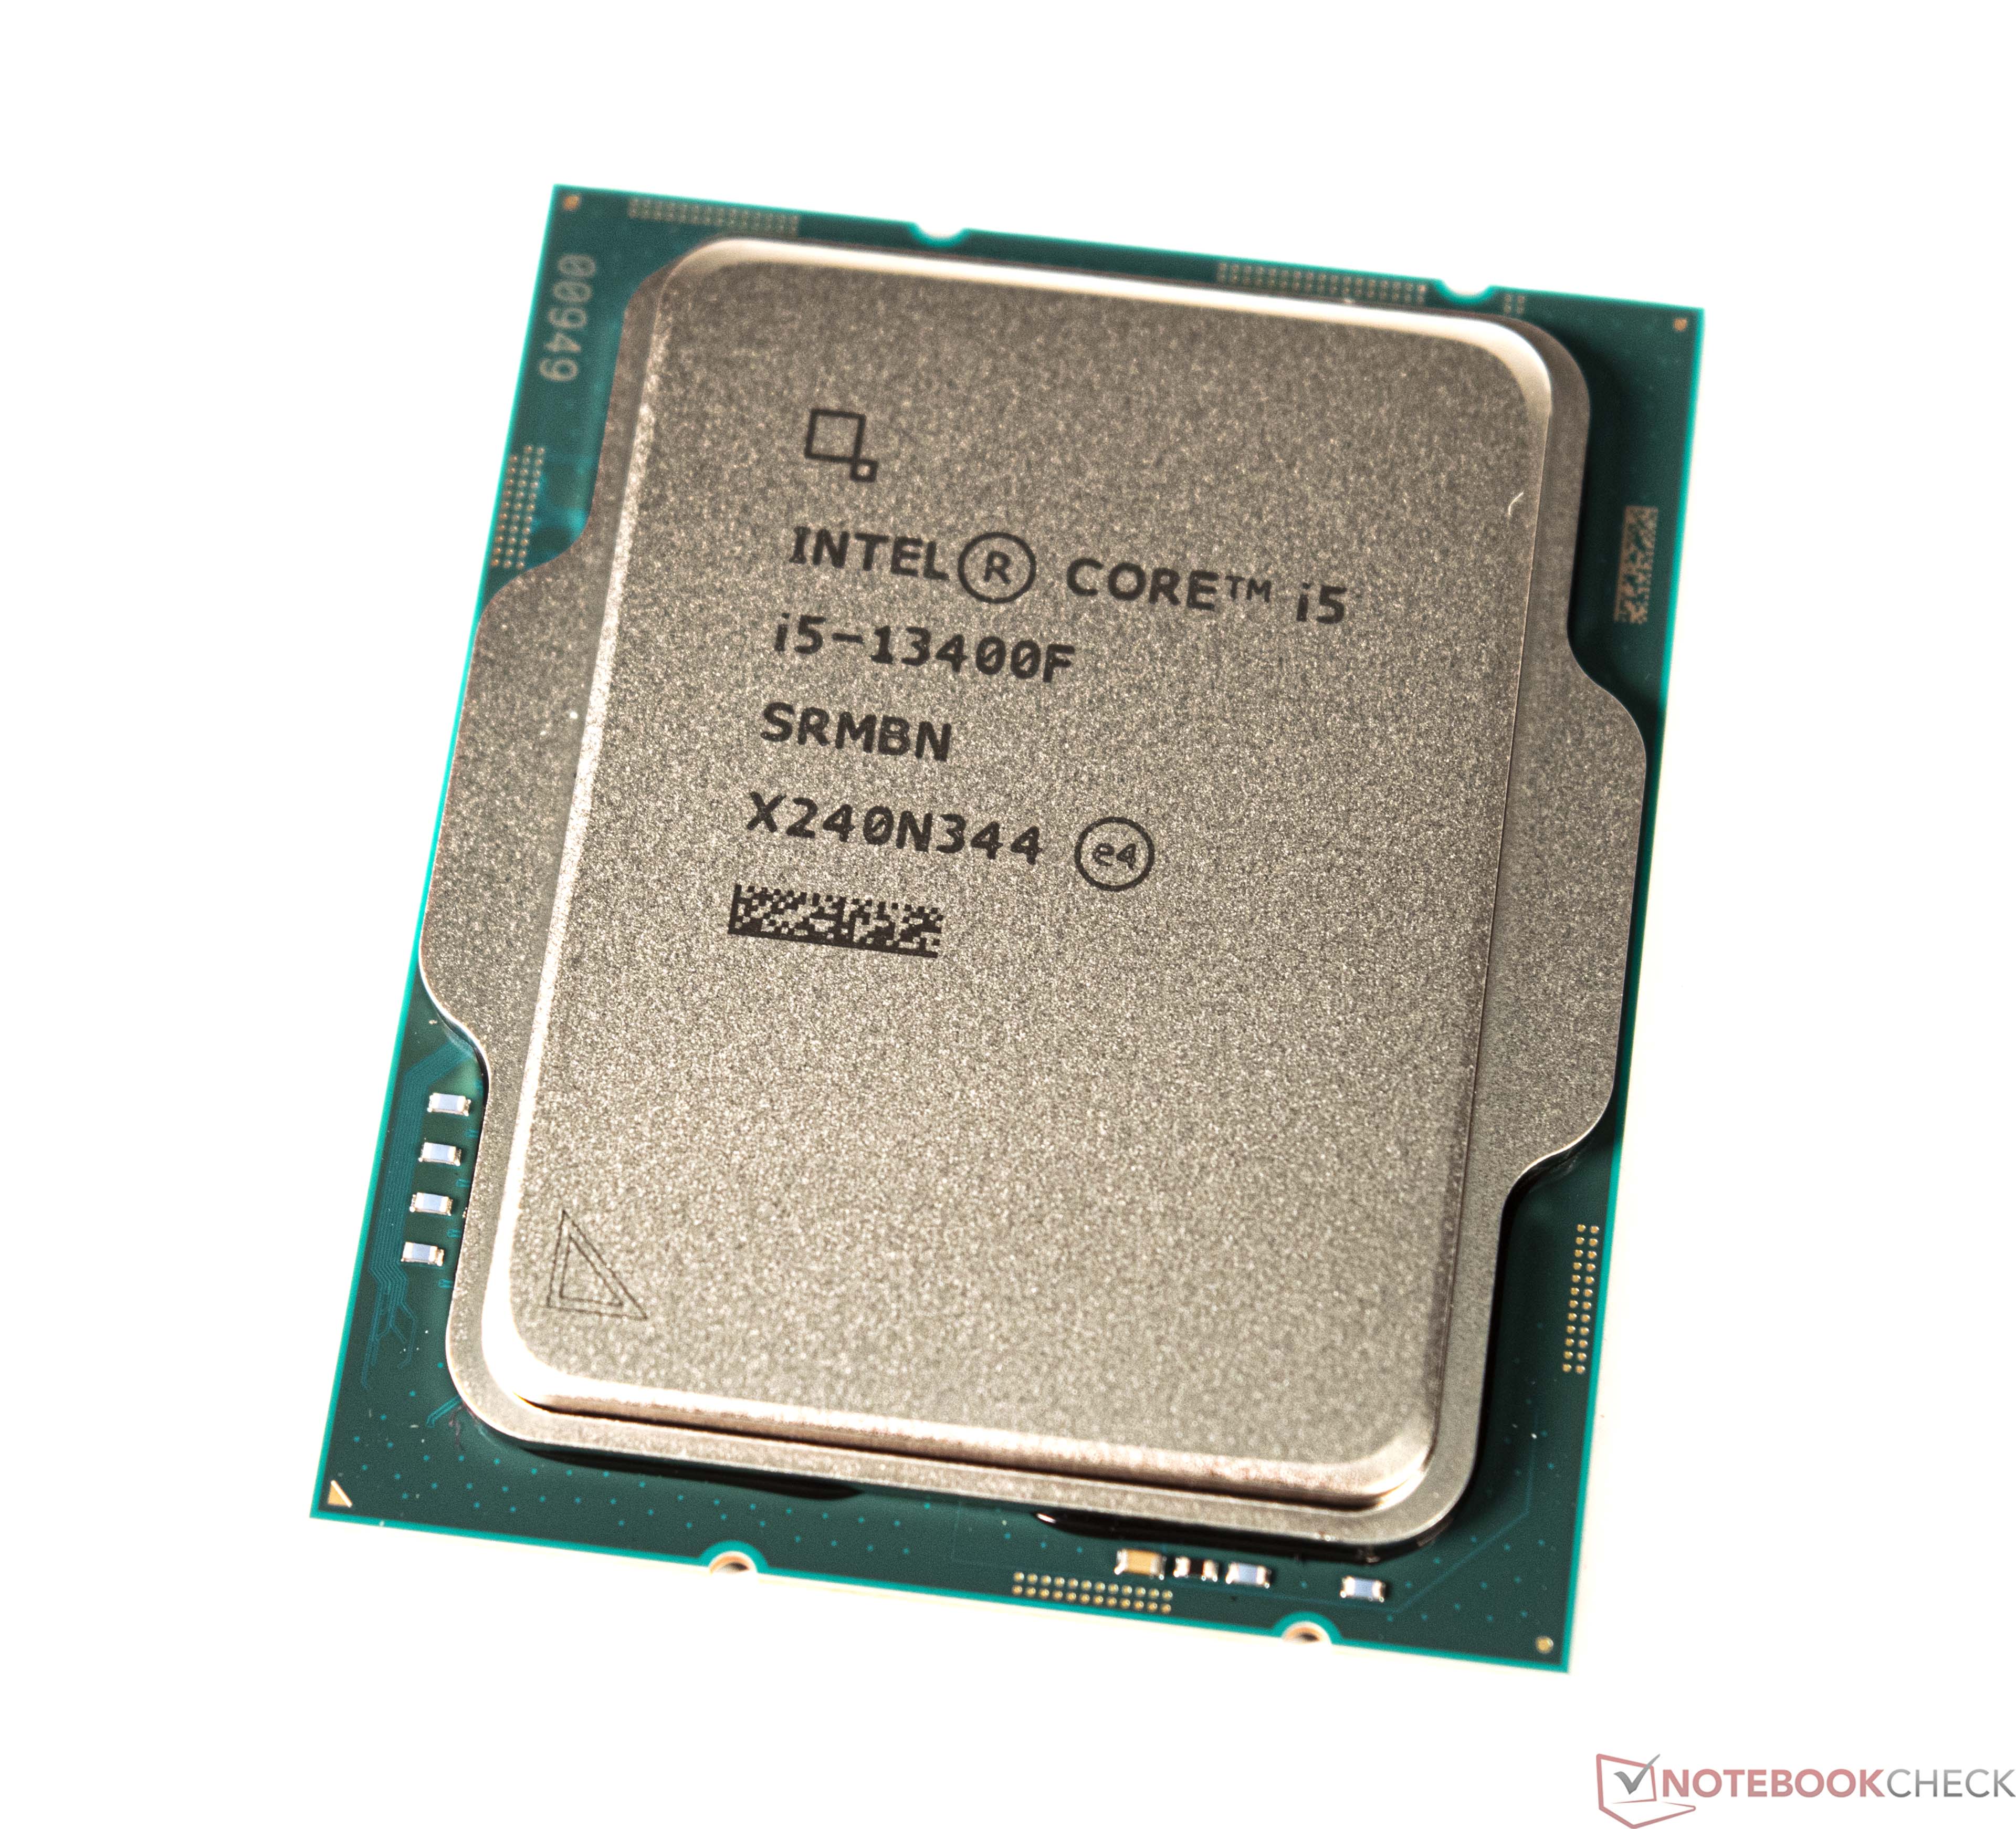
The Intel Core i5-13400F is a mid-range desktop processor of the Raptor Lake series. It includes a hybrid architecture for the CPU cores with combined 10 cores. Six fast Golden Cove / Raptor Cove performance cores (P-cores) with HyperThreading and a clock speed of 3.5 - 5.1 GHz and four Gracemont efficiency cores without HyperThreading and a clock speed of 2.6 - 3.9 GHz. The 13400F can be based on the older Alder Lake chips (at least for early models) or the newer Raptor Lake chips. The F-series of CPUs do not integrate a iGPU.

The performance is clearly higher than the old Core i5-12400F due to the additional four E-cores. These help in multi-threaded workloads and the higher boost core of the p-cores help for single threaded workloads.

The power consumption of the 13400F is rated at 65 Watt for sustained workloads (PL1) and 148 Watt for short bursts (PL2).

Intel Core i7-1370P

► remove from comparison Intel i7-1370P

The Intel Core i7-1370P is the flagship Alder Lake-P CPU, which is to say, an expensive 28 W part meant for use in ultra-light (yet actively cooled) laptops. This CPU will probably be announced in early 2023 and it has 6 performance cores (P-cores, Golden Cove architecture) mated to 8 efficient cores (E-cores, Gracemont architecture) according to a leak on Geekbench. The P-cores are Hyper-Threading-enabled for whopping 20 threads when combined with the E-cores. The clock speeds can reach up to 5.2 GHz for the performance cluster (1.9 GHz base speed) and 1.4 GHz to 3.9 GHz for the efficiency cluster. The CPU is quite similar to the older Core i7-1280P but probably offers higher clock speeds.

Full vPro feature set is supported by this Core i7 ("Enterprise" tier, allowing for remote device management).

Architecture

The i7 is a continuation of Intel's efforts to use the ARM-developed big.LITTLE technology for its own benefit. A single "little" Alder Lake core is supposed to be just as fast as a Skylake core (as found in the venerable Core i7-6700HQ among other options) which is six years old at this point. All of a Core i7-1280P's CPU cores enjoy access to 24 MB of L3 cache. The integrated memory controller supports up to 64 GB of LPDDR5-5200, DDR5-4800, LPDDR4x-4267 or DDR4-3200 RAM. Just like the other 12th Gen Intel Core processors, Core i7-1280P comes with Thread Director which is a new functionality designed to help Windows 11 decide which cores to use for what workload for best performance and efficiency possible. Hardware acceleration of AI algorithms is supported via GNA 3.0 and DL Boost (via AVX2). PCI-Express 5.0 support has not found its way into Alder Lake P processors, so users will have to be content with PCI-Express 4.0 for the time being. The CPU still only supports PCIe 4.0 x8 for a GPU and two PCIe 4.0 x4 for SSDs.

Please note this is not a user-replaceable CPU. It gets soldered permanently on to the motherboard (BGA1744 socket interface).

Performance

Multi-thread performance is most comparable to AMD Ryzen 9 5900HS, Ryzen 9 PRO 6950HS, Intel Core i9-11980HK. Which is impressive but comes with a catch; long-term performance sustainability will be rather poor unless the Power Limits are very high and the cooling solution is a truly capable one.

Graphics

The built-in graphics adapter in the form of the 96 EU Iris Xe running at up to 1.5 GHz has seen no change from what was built into the 11th Gen Tiger Lake-UP3 processors, like a i7-1165G7, which is hardly a downside as this iGPU is loaded with modern features such as AV1 video decoding capability and SUHD 4320p monitor support. 

Power Consumption

The i7's base power consumption (also known as the default TDP value or PL1) is 28 W, with 64 W being its maximum Intel-recommended Turbo power consumption (also known as the PL2). The "Minimum Assured" power consumption is fairly high at 20 watts. All in all, an active cooling solution is nearly a must.

Core i7-1370P is built with Intel's third-gen 10 nm process marketed as Intel 7.

Intel Core i5-13400

► remove from comparison Intel i5-13400

The Intel Core i5-13400 is a top modern and fast desktop processor and belongs to the current Raptor Lake series. The processor was introduced early 2023 and offers a base clock of 2.5 GHz. It reaches up to 4.6 GHz in Turbo mode. As with Alder Lake-S, Raptor Lake-S is also based on a hybrid design that combines P and E cores. The Intel Core i5-13400 therefore offers 6 P-cores and 4 E-cores, which can process a total of up to 16 threads in parallel. The processor continues to be manufactured using the 10 nm production process (called "Intel 7"). The Intel Core i5-13400 does not have a freely selectable multiplier. The LGA 1700 socket introduced with the Alder Lake series serves as the basis. The Intel Core i5-13400 can be based on either a Raptor Lake or Alder Lake chip. Initially, however, Alder Lake chips will be supplied.

Performance

Compared to the Intel Core i5-12400, the IPC of the new Core i5-13400 has been increased slightly. Nevertheless, there are now also 4 e-cores, which support the processor in terms of multi-thread performance. This puts the Intel Core i5-13400 at the level of an Intel Core i5-12600K, which also offers a total of 16 threads.

Graphics unit

The Intel Core i5-13400 is a processor with an integrated graphics unit, but it is only suited for office use or very old and low demanding games.

Power consumption

The TDP of the Intel Core i5-13400 is 65 watts in PL1. Intel defines the PL2 limit at 148 watts. If the restrictions regarding power consumption are deactivated in the BIOS, the PL2 value can be reached permanently. However, a high-quality and powerful cooling unit should be used for this.

ModelIntel Core i5-13400FIntel Core i7-1370PIntel Core i5-13400
SeriesIntel Raptor Lake-SIntel Raptor Lake-PIntel Raptor Lake-S
CodenameRaptor Lake-SRaptor Lake-PRaptor Lake-S
Series: Raptor Lake-S Raptor Lake-S
Intel Core i7-137002.1 - 5.2 GHz16 / 24 cores30 MB L3
Intel Core i5-13400F « 2.5 - 4.6 GHz10 / 16 cores20 MB L3
Intel Core i5-134002.5 - 4.6 GHz10 / 16 cores20 MB L3
Intel Core i7-1370P « 1.4 - 5.2 GHz14 / 20 cores24 MB L3
Intel Core i7-1360P1.6 - 5 GHz12 / 16 cores18 MB L3
Intel Core i5-1350P1.4 - 4.7 GHz12 / 16 cores18 MB L3
Intel Core i5-1340P1.4 - 4.6 GHz12 / 16 cores12 MB L3
Intel Core i7-137002.1 - 5.2 GHz16 / 24 cores30 MB L3
Intel Core i5-13400F2.5 - 4.6 GHz10 / 16 cores20 MB L3
Intel Core i5-13400 « 2.5 - 4.6 GHz10 / 16 cores20 MB L3
Clock2500 - 4600 MHz1400 - 5200 MHz2500 - 4600 MHz
L1 Cache0.1 MB1.2 MB0.1 MB
L2 Cache9.5 MB11.5 MB9.5 MB
L3 Cache20 MB24 MB20 MB
Cores / Threads10 / 1614 / 20
6 x 5.2 GHz Intel Golden Cove P-Core
8 x 3.9 GHz Intel Gracemont E-Core
10 / 16
TDP65 Watt28 Watt65 Watt
Technology10 nm10 nm10 nm
Die Size257 mm2257 mm2
max. Temp.100 °C100 °C100 °C
SocketLGA 1700FCBGA1744LGA 1700
FeaturesIntel SSE4.1, Intel SSE4.2, Intel AVX2Thread DirectorIntel SSE4.1, Intel SSE4.2, Intel AVX2
Architecturex86x86x86
$196 U.S.$221 U.S.
Announced
Manufacturerark.intel.comark.intel.comwww.intel.de
iGPUIntel Iris Xe Graphics G7 96EUs ( - 1500 MHz)Intel UHD Graphics 730 (Rocket Lake) (300 - 1550 MHz)

Benchmarks

Performance Rating - CB R15 + R20 + 7-Zip + X265 + Blender + 3DM11 CPU - i5-13400F
42.5 pt (59%)
Performance Rating - CB R15 + R20 + 7-Zip + X265 + Blender + 3DM11 CPU - i7-1370P
43.5 pt (60%)
Performance Rating - CB R15 + R20 + 7-Zip + X265 + Blender + 3DM11 CPU - i5-13400
42.9 pt (60%)
Cinebench 2024 - Cinebench 2024 CPU Single Core
90 Points (63%)
Cinebench 2024 - Cinebench 2024 CPU Multi Core
366 Points (7%)
Cinebench R23 - Cinebench R23 Multi Core
15911 Points (15%)
min: 12778     avg: 13559     median: 13159 (12%)     max: 14741 Points
15953 Points (15%)
Cinebench R23 - Cinebench R23 Single Core
1744 Points (74%)
min: 1750     avg: 1887     median: 1915 (81%)     max: 1995 Points
1786 Points (76%)
Cinebench R20 - Cinebench R20 CPU (Single Core)
672 Points (75%)
min: 675     avg: 723     median: 729 (81%)     max: 764 Points
688 Points (76%)
Cinebench R20 - Cinebench R20 CPU (Multi Core)
6091 Points (15%)
min: 5079     avg: 5293     median: 5148 (13%)     max: 5651 Points
6135 Points (15%)
Cinebench R15 - Cinebench R15 CPU Multi 64 Bit
2364 Points (15%)
min: 2052     avg: 2316     median: 2404 (15%)     max: 2492 Points
2358 Points (15%)
Cinebench R15 - Cinebench R15 CPU Single 64 Bit
252 Points (76%)
min: 258     avg: 268.7     median: 264 (80%)     max: 284 Points
257 Points (77%)
Cinebench R11.5 - Cinebench R11.5 CPU Multi 64 Bit
27.5 Points (36%)
27.4 Points (36%)
Cinebench R11.5 - Cinebench R11.5 CPU Single 64 Bit
3.1 Points (76%)
3.1 Points (77%)
Cinebench R10 - Cinebench R10 Rend. Single (32bit)
8689 Points (52%)
8721 Points (53%)
Cinebench R10 - Cinebench R10 Rend. Multi (32bit)
51113 Points (37%)
51095 Points (37%)
Cinebench R10 - Cinebench R10 Rend. Multi (64bit)
82988 Points (58%)
83214 Points (58%)
Cinebench R10 - Cinebench R10 Rend. Single (64bit)
13947 Points (17%)
14142 Points (17%)
wPrime 2.10 - wPrime 2.0 1024m *
367.9 s (4%)
452.3 s (5%)
wPrime 2.10 - wPrime 2.0 32m *
3.3 s (1%)
3.5 s (1%)
WinRAR - WinRAR 4.0
8602 Points (14%)
7979 Points (13%)
7-Zip 18.03 - 7-Zip 18.03 Multli Thread 4 runs
60048 MIPS (34%)
min: 48229     avg: 52228     median: 53407 (31%)     max: 55049 MIPS
59510 MIPS (34%)
7-Zip 18.03 - 7-Zip 18.03 Single Thread 4 runs
5743 MIPS (69%)
min: 6140     avg: 6334     median: 6176 (74%)     max: 6687 MIPS
5829 MIPS (70%)
X264 HD Benchmark 4.0 - x264 Pass 2
136.9 fps (48%)
135.8 fps (47%)
X264 HD Benchmark 4.0 - x264 Pass 1
314.5 fps (73%)
311 fps (72%)
HWBOT x265 Benchmark v2.2 - HWBOT x265 4k Preset
19.2 fps (34%)
min: 9.65     avg: 13.2     median: 14.5 (25%)     max: 15.5 fps
19.1 fps (34%)
TrueCrypt - TrueCrypt Serpent
1.1 GB/s (0%)
1.2 GB/s (0%)
TrueCrypt - TrueCrypt Twofish
2 GB/s (34%)
2 GB/s (34%)
TrueCrypt - TrueCrypt AES
12.2 GB/s (32%)
11.8 GB/s (31%)
Blender - Blender 3.3 Classroom CPU *
336 Seconds (4%)
min: 444     avg: 563     median: 472 (6%)     max: 774 Seconds
336 Seconds (4%)
Blender - Blender 2.79 BMW27 CPU *
206 Seconds (1%)
min: 246     avg: 297.7     median: 258 (2%)     max: 389 Seconds
206 Seconds (1%)
R Benchmark 2.5 - R Benchmark 2.5 *
0.5 sec (10%)
min: 0.4244     avg: 0.4     median: 0.4 (9%)     max: 0.4649 sec
0.5 sec (10%)
3DMark 06 - CPU - 3DMark 06 - CPU
13989 Points (30%)
10031 Points (21%)
13632 Points (29%)
Super Pi mod 1.5 XS 1M - Super Pi mod 1.5 XS 1M *
8 s (2%)
8 s (2%)
Super Pi mod 1.5 XS 2M - Super Pi mod 1.5 XS 2M *
17.9 s (1%)
18 s (1%)
Super Pi Mod 1.5 XS 32M - Super Pi mod 1.5 XS 32M *
420.5 s (2%)
427.2 s (2%)
3DMark Vantage - 3DM Vant. Perf. CPU no Physx
77937 Points (68%)
46629 Points (41%)
79573 Points (70%)
3DMark 11 - 3DM11 Performance Physics
23820 Points (64%)
min: 13806     avg: 15963     median: 16281 (44%)     max: 17803 Points
23120 Points (63%)
3DMark - 3DMark Ice Storm Physics
77765 Points (63%)
73456 Points (60%)
83302 Points (68%)
3DMark - 3DMark Ice Storm Extreme Physics
76636 Points (62%)
82671 Points (67%)
3DMark - 3DMark Ice Storm Unlimited Physics
80273 Points (68%)
89999 Points (76%)
3DMark - 3DMark Cloud Gate Physics
19846 Points (50%)
min: 7878     avg: 11614     median: 11614 (29%)     max: 15350 Points
19608 Points (50%)
3DMark - 3DMark Fire Strike Standard Physics
28087 Points (50%)
min: 12349     avg: 17027     median: 15761 (28%)     max: 22970 Points
27135 Points (48%)
3DMark - 3DMark Time Spy CPU
12669 Points (53%)
min: 4929     avg: 6752     median: 6281 (26%)     max: 9045 Points
12948 Points (55%)
Geekbench 6.2 - Geekbench 6.2 Single-Core
min: 2639     avg: 2642     median: 2641.5 (71%)     max: 2644 Points
Geekbench 6.2 - Geekbench 6.2 Multi-Core
min: 12497     avg: 12694     median: 12694 (50%)     max: 12891 Points
Geekbench 5.5 - Geekbench 5.1 - 5.4 64 Bit Single-Core
1792 Points (76%)
min: 1655     avg: 1843     median: 1871.5 (79%)     max: 1974 Points
1795 Points (76%)
Geekbench 5.5 - Geekbench 5.1 - 5.4 64 Bit Multi-Core
12095 Points (22%)
min: 10184     avg: 11028     median: 11048.5 (20%)     max: 11832 Points
12107 Points (22%)
Geekbench 5.0 - Geekbench 5.0 64 Bit Single-Core
1721 Points (7%)
1939 Points (8%)
1706 Points (7%)
Geekbench 5.0 - Geekbench 5.0 64 Bit Multi-Core
12009 Points (38%)
11474 Points (36%)
11801 Points (37%)
Geekbench 4.4 - Geekbench 4.1 - 4.4 64 Bit Single-Core
7684 Points (77%)
7683 Points (77%)
Geekbench 4.4 - Geekbench 4.1 - 4.4 64 Bit Multi-Core
43856 Points (48%)
42509 Points (47%)
Mozilla Kraken 1.1 - Kraken 1.1 Total Score *
535 ms (1%)
min: 479     avg: 484     median: 485 (1%)     max: 487 ms
535 ms (1%)
WebXPRT 4 - WebXPRT 4 Score
254 Points (73%)
285 Points (82%)
251 Points (72%)
WebXPRT 3 - WebXPRT 3 Score
294 Points (61%)
min: 288     avg: 302     median: 296.5 (62%)     max: 327 Points
306 Points (64%)
CrossMark - CrossMark Overall
1941 Points (74%)
min: 1728     avg: 1795     median: 1827 (70%)     max: 1830 Points
1877 Points (72%)
Power Consumption - Prime95 Power Consumption - external Monitor *
214 Watt (37%)
min: 36.7     avg: 53     median: 60.3 (10%)     max: 62.1 Watt
229 Watt (39%)
Power Consumption - Cinebench R15 Multi Power Consumption - external Monitor *
184.2 Watt (34%)
60.6 Watt (11%)
196.6 Watt (36%)
Power Consumption - Idle Power Consumption - external Monitor *
76.3 Watt (50%)
min: 3.23     avg: 6.9     median: 5.9 (4%)     max: 12.5 Watt
Power Consumption - Idle Power Consumption 150cd 1min *
min: 8.39     avg: 9.8     median: 9.8 (11%)     max: 11.3 Watt
82.8 Watt (92%)

Average Benchmarks Intel Core i5-13400F → 100% n=27

Average Benchmarks Intel Core i7-1370P → 90% n=27

Average Benchmarks Intel Core i5-13400 → 100% n=27

- Range of benchmark values for this graphics card
- Average benchmark values for this graphics card
* Smaller numbers mean a higher performance
1 This benchmark is not used for the average calculation

v1.28
log 30. 19:46:40

#0 checking url part for id 14966 +0s ... 0s

#1 checking url part for id 14657 +0s ... 0s

#2 checking url part for id 14996 +0s ... 0s

#3 redirected to Ajax server, took 1719769599 +0s ... 0s

#4 did not recreate cache, as it is less than 5 days old! Created at Fri, 28 Jun 2024 05:15:21 +0200 +0s ... 0s

#5 composed specs +0.007s ... 0.007s

#6 did output specs +0s ... 0.007s

#7 getting avg benchmarks for device 14966 +0.004s ... 0.011s

#8 got single benchmarks 14966 +0.004s ... 0.015s

#9 getting avg benchmarks for device 14657 +0.004s ... 0.019s

#10 got single benchmarks 14657 +0.007s ... 0.026s

#11 getting avg benchmarks for device 14996 +0.003s ... 0.029s

#12 got single benchmarks 14996 +0.004s ... 0.033s

#13 got avg benchmarks for devices +0s ... 0.033s

#14 No cached benchmark found, getting uncached values +0.032s ... 0.065s

#15 No cached benchmark found, getting uncached values +0.004s ... 0.07s

#16 No cached benchmark found, getting uncached values +0.003s ... 0.072s

#17 min, max, avg, median took s +0.026s ... 0.098s

#18 return log +0s ... 0.098s

Please share our article, every link counts!
> Expert Reviews and News on Laptops, Smartphones and Tech Innovations > Benchmarks / Tech > Processor Comparison - Head 2 Head
Redaktion, 2017-09- 8 (Update: 2023-07- 1)