Notebookcheck Logo

Intel Core i5-11320H vs AMD Ryzen 5 5600U

Intel Core i5-11320H

► remove from comparison Intel i5-11320H

The Intel Core i5-11320H is a mid range SoC for thin and light gaming laptops and mobile workstations. It is based on the Tiger Lake H35 refresh generation and will be announced in Q3 2021. It integrates four Willow Cove processor cores (8 threads thanks to HyperThreading). The base clock speed depends on the TDP setting and can vary from 2.5 (28 W TDP) to 3.2 GHz (35 W). The boost of a single and two cores under load can reach up to 4.5 GHz. All four cores can reach up to 4.3 GHz. The L3 cache is reduced to 8 MB compared to the 12 MB of the higher end i7 models.

Thanks to the improved clock speeds, the performance gap to the faster i7-11370H should be quite small. The i7 still offers higher single and dual core Turbo speeds and more L3 cache.

The SoC also included the improved Xe graphics card with 96 CUs clocked at up to 1350 MHz.

Furthermore, Tiger Lake SoCs add PCIe 4 support (four lanes), AI hardware acceleration, and the partial integration of Thunderbolt 4/USB 4 and Wi-Fi 6 in the chip.

The chip is produced on the improved 10nm process (called 10nm SuperFin) at Intel, which should be comparable to the 7nm process at TSMC (e.g. Ryzen 4000 series).

All articles on Tiger Lake can be found on our Tiger Lake architecture hub.


AMD Ryzen 5 5600U

► remove from comparison AMD R5 5600U

The AMD Ryzen 5 5600U, not to be confused with Intel's Core i7-5600U, is a fairly fast Cezanne family processor designed for use in thinner, lighter laptops. The R5 5600U integrates six of the eight cores based on the Zen 3 microarchitecture and is the third fastest U-series processor at launch. The cores are clocked at 2.3 (guaranteed base clock) to 4.2 GHz (Turbo) and support SMT for a total of 12 threads. The chip is manufactured on the modern 7 nm TSMC process.

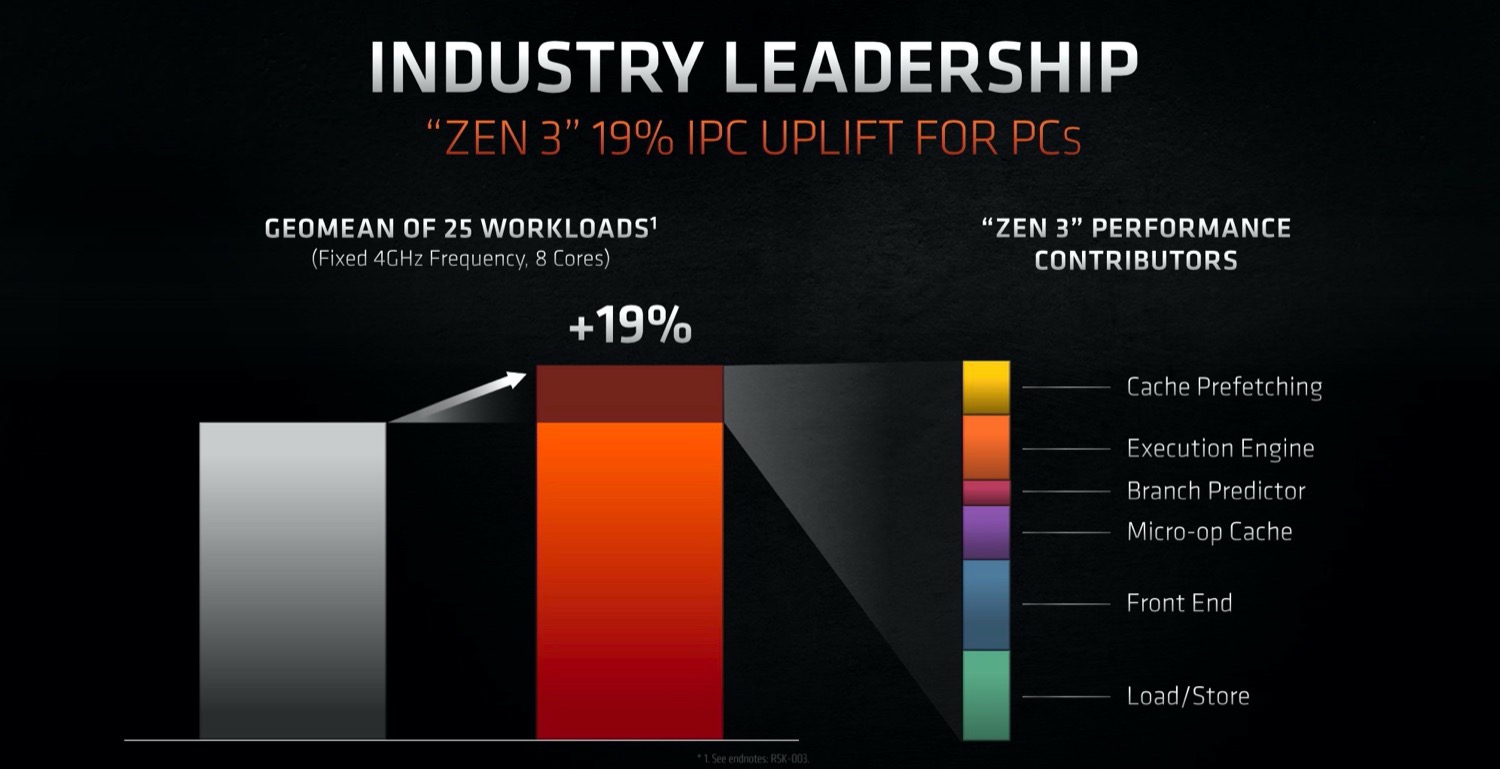
The new Zen 3 microarchitecture offers a significantly higher IPC (instructions per clock) compared to Zen 2. For desktop processors AMD claims 19 percent on average and in applications reviews showed around 12% gains at the same clock speed.

In addition to the six CPU cores, the APU also integrates a Radeon RX Vega 7 integrated graphics card with 7 CUs at up to 1800 MHz. The dual channel memory controller supports DDR4-3200 and energy efficient LPDDR4-4266 RAM. Furthermore, 16 MB level 3 cache (up from 8 MB at the 4800U) can be found on the chip.

Performance

This Ryzen 5 series chip is a solid mid-range CPU, as of early 2022. Its multi-thread benchmark scores nearly match those of the Intel Core i5-11400H (a much more power-hungry hexa-core chip designed for use in gaming laptops). While not nearly as fast as 12th generation Alder Lake-P processors, the 5600U should be good enough for the vast majority of users.

Thanks to its decent cooling solution and a long-term CPU power limit of 30 W, the IdeaPad 5 Pro 14ACN6 is among the fastest laptops powered by the 5600U that we know of. It can be more than 30% faster in CPU-bound workloads than the slowest system featuring the same chip in our database, as of August 2023.

Power consumption

This Ryzen 5 has a default TDP of 15 W, a value that laptop makers are allowed to change to anything between 10 W and 25 W with clock speeds and performance changing accordingly as a result. By going for the lowest value possible, it is possible to build a passively cooled system around this chip. Most laptop makers, however, will do the opposite to maximize performance.

The AMD Ryzen 5 5600U is built with TSMC's 7 nm manufacturing process for average, as of mid 2023, energy efficiency.

ModelIntel Core i5-11320HAMD Ryzen 5 5600U
SeriesIntel Tiger LakeAMD Cezanne (Zen 3, Ryzen 5000)
CodenameTiger Lake-H35Cezanne-U (Zen 3)
Series: Cezanne (Zen 3, Ryzen 5000) Cezanne-U (Zen 3)
Intel Core i7-11390H compare3.4 - 5 GHz4 / 8 cores12 MB L3
Intel Core i7-11375H compare3.3 - 5 GHz4 / 8 cores12 MB L3
Intel Core i7-11370H compare3.3 - 4.8 GHz4 / 8 cores12 MB L3
Intel Core i5-11320H « 3.2 - 4.5 GHz4 / 8 cores8 MB L3
Intel Core i5-11300H compare3.1 - 4.4 GHz4 / 8 cores8 MB L3
AMD Ryzen 7 5800U compare1.9 - 4.4 GHz8 / 16 cores16 MB L3
AMD Ryzen 5 5600U « 2.3 - 4.2 GHz6 / 12 cores16 MB L3
AMD Ryzen 5 5560U compare2.3 - 4 GHz6 / 12 cores16 MB L3
AMD Ryzen 3 5400U compare2.6 - 4 GHz4 / 8 cores8 MB L3
Clock3200 - 4500 MHz2300 - 4200 MHz
L1 Cache320 KB384 KB
L2 Cache5 MB3 MB
L3 Cache8 MB16 MB
Cores / Threads4 / 86 / 12
TDP35 Watt25 Watt
Technology10 nm7 nm
max. Temp.100 °C105 °C
SocketBGA1449FP6
FeaturesDDR4-3200/LPDDR4x-4266 RAM, PCIe 4, 4 GT/s bus, DL Boost, GNA, MMX, SSE, SSE2, SSE3, SSSE3, SSE4.1, SSE4.2, AVX, AVX2, AVX-512, BMI2, ABM, FMA, ADX, VMX, SMEP, SMAP, EIST, TM1, TM2, HT, Turbo, SST, AES-NI, RDRAND, RDSEED, SHADDR4-3200/LPDDR4-4266 RAM, PCIe 3, MMX, SSE, SSE2, SSE3, SSSE3, SSE4A, SSE4.1, SSE4.2, AVX, AVX2, BMI2, ABM, FMA, ADX, SMEP, SMAP, SMT, CPB, AES-NI, RDRAND, RDSEED, SHA, SME
iGPUIntel Iris Xe Graphics G7 96EUs (400 - 1350 MHz)AMD Radeon RX Vega 7 ( - 1800 MHz)
Architecturex86x86
Announced
Manufacturerark.intel.comwww.amd.com

Benchmarks

Performance Rating - CB R15 + R20 + 7-Zip + X265 + Blender + 3DM11 CPU - i5-11320H
34.3 pt (48%)
Performance Rating - CB R15 + R20 + 7-Zip + X265 + Blender + 3DM11 CPU - R5 5600U
36 pt (50%)
Cinebench 2024 - Cinebench 2024 CPU Single Core
82 Points (57%)
Cinebench 2024 - Cinebench 2024 CPU Multi Core
388 Points (7%)
Cinebench R23 - Cinebench R23 Multi Core
min: 5720     avg: 5869     median: 5852 (5%)     max: 6051 Points
min: 6871     avg: 7929     median: 7792.5 (7%)     max: 9345 Points
Cinebench R23 - Cinebench R23 Single Core
min: 1341     avg: 1432     median: 1460.5 (62%)     max: 1467 Points
min: 1345     avg: 1365     median: 1371 (58%)     max: 1376 Points
Cinebench R20 - Cinebench R20 CPU (Single Core)
min: 557     avg: 561     median: 560.5 (62%)     max: 567 Points
min: 532     avg: 534     median: 534 (59%)     max: 536 Points
Cinebench R20 - Cinebench R20 CPU (Multi Core)
min: 2208     avg: 2273     median: 2267.5 (6%)     max: 2349 Points
min: 2345     avg: 3036     median: 3067 (7%)     max: 3632 Points
Cinebench R15 - Cinebench R15 CPU Multi 64 Bit
min: 857     avg: 922     median: 905.5 (6%)     max: 1019 Points
min: 1265     avg: 1347     median: 1321 (8%)     max: 1546 Points
Cinebench R15 - Cinebench R15 CPU Single 64 Bit
min: 212     avg: 213.8     median: 214 (64%)     max: 215 Points
min: 220     avg: 222     median: 223 (67%)     max: 223 Points
Cinebench R11.5 - Cinebench R11.5 CPU Multi 64 Bit
10.8 Points (14%)
min: 14.5     avg: 15.1     median: 14.8 (19%)     max: 15.96 Points
Cinebench R11.5 - Cinebench R11.5 CPU Single 64 Bit
2.5 Points (62%)
min: 2.61     avg: 2.6     median: 2.6 (65%)     max: 2.64 Points
Cinebench R10 - Cinebench R10 Rend. Single (32bit)
8767 Points (53%)
min: 58.49     avg: 2866     median: 2866.3 (17%)     max: 5674 Points
Cinebench R10 - Cinebench R10 Rend. Multi (32bit)
32576 Points (24%)
min: 27130     avg: 28347     median: 28347 (21%)     max: 29564 Points
Cinebench R10 - Cinebench R10 Rend. Multi (64bit)
42350 Points (29%)
min: 45363     avg: 47704     median: 46918 (33%)     max: 50831 Points
Cinebench R10 - Cinebench R10 Rend. Single (64bit)
11457 Points (14%)
min: 11098     avg: 11124     median: 11132 (14%)     max: 11143 Points
wPrime 2.10 - wPrime 2.0 1024m *
191.4 s (2%)
min: 147.807     avg: 193.8     median: 156.3 (2%)     max: 277.4 s
wPrime 2.10 - wPrime 2.0 32m *
5.9 s (1%)
min: 4.848     avg: 6.3     median: 5.4 (1%)     max: 8.78 s
WinRAR - WinRAR 4.0
5481 Points (9%)
min: 6346     avg: 6694     median: 6858 (11%)     max: 6877 Points
7-Zip 18.03 - 7-Zip 18.03 Multli Thread 4 runs
min: 24718     avg: 25274     median: 24760 (14%)     max: 26858 MIPS
min: 32052     avg: 37855     median: 37815.5 (22%)     max: 43071 MIPS
7-Zip 18.03 - 7-Zip 18.03 Single Thread 4 runs
min: 4813     avg: 4996     median: 5025 (60%)     max: 5119 MIPS
min: 5118     avg: 5198     median: 5204.5 (62%)     max: 5260 MIPS
X264 HD Benchmark 4.0 - x264 Pass 2
min: 76     avg: 78.5     median: 78.5 (27%)     max: 80.95 fps
X264 HD Benchmark 4.0 - x264 Pass 1
min: 234     avg: 235     median: 235 (54%)     max: 236 fps
HWBOT x265 Benchmark v2.2 - HWBOT x265 4k Preset
min: 7.25     avg: 7.6     median: 7.6 (13%)     max: 7.91 fps
min: 7.31     avg: 9.7     median: 9.8 (17%)     max: 11.8 fps
TrueCrypt - TrueCrypt Serpent
0.5 GB/s (0%)
min: 0.7     avg: 0.8     median: 0.8 (0%)     max: 0.796 GB/s
TrueCrypt - TrueCrypt Twofish
0.9 GB/s (16%)
min: 1.1     avg: 1.1     median: 1.1 (19%)     max: 1.2 GB/s
TrueCrypt - TrueCrypt AES
6.1 GB/s (16%)
min: 5.1     avg: 7     median: 7.7 (20%)     max: 8.3 GB/s
Blender - Blender 3.3 Classroom CPU *
min: 937     avg: 981     median: 995 (13%)     max: 1010 Seconds
min: 781     avg: 798     median: 798 (10%)     max: 815 Seconds
Blender - Blender 2.79 BMW27 CPU *
min: 507     avg: 527     median: 528.5 (4%)     max: 543 Seconds
min: 328     avg: 412.8     median: 412.5 (3%)     max: 481 Seconds
R Benchmark 2.5 - R Benchmark 2.5 *
min: 0.581     avg: 0.6     median: 0.6 (13%)     max: 0.622 sec
min: 0.537     avg: 0.6     median: 0.6 (12%)     max: 0.59 sec
3DMark 06 - CPU - 3DMark 06 - CPU
10886 Points (23%)
min: 10261     avg: 10973     median: 11308 (24%)     max: 11349 Points
Super Pi mod 1.5 XS 1M - Super Pi mod 1.5 XS 1M *
7.5 s (2%)
min: 8.417     avg: 8.6     median: 8.7 (2%)     max: 8.767 s
Super Pi mod 1.5 XS 2M - Super Pi mod 1.5 XS 2M *
16.8 s (1%)
min: 18.25     avg: 18.8     median: 18.9 (1%)     max: 19.23 s
Super Pi Mod 1.5 XS 32M - Super Pi mod 1.5 XS 32M *
389.7 s (2%)
min: 39.78     avg: 333.6     median: 454.6 (2%)     max: 506.532 s
3DMark Vantage - 3DM Vant. Perf. CPU no Physx
33603 Points (29%)
min: 39453     avg: 40516     median: 40516 (35%)     max: 41579 Points
3DMark 11 - 3DM11 Performance Physics
min: 10666     avg: 11575     median: 11487 (31%)     max: 12778 Points
min: 7823     avg: 11018     median: 11465.5 (31%)     max: 13130 Points
3DMark - 3DMark Ice Storm Physics
min: 66612     avg: 66703     median: 66702.5 (54%)     max: 66793 Points
min: 70486     avg: 72645     median: 72645 (59%)     max: 74804 Points
3DMark - 3DMark Ice Storm Extreme Physics
min: 66629     avg: 67222     median: 67221.5 (55%)     max: 67814 Points
min: 70573     avg: 71966     median: 71965.5 (58%)     max: 73358 Points
3DMark - 3DMark Ice Storm Unlimited Physics
min: 70639     avg: 70683     median: 70683 (60%)     max: 70727 Points
min: 80047     avg: 81270     median: 81269.5 (68%)     max: 82492 Points
3DMark - 3DMark Cloud Gate Physics
min: 8860     avg: 9380     median: 9363 (24%)     max: 10187 Points
min: 9144     avg: 10893     median: 10921 (28%)     max: 13033 Points
3DMark - 3DMark Fire Strike Standard Physics
min: 13123     avg: 13891     median: 13763 (25%)     max: 14950 Points
min: 14756     avg: 17757     median: 17787.5 (32%)     max: 20872 Points
3DMark - 3DMark Time Spy CPU
min: 4803     avg: 5132     median: 5199 (22%)     max: 5637 Points
min: 3820     avg: 4931     median: 4984 (21%)     max: 5685 Points
Geekbench 6.2 - Geekbench 6.2 Single-Core
1885 Points (51%)
Geekbench 6.2 - Geekbench 6.2 Multi-Core
7232 Points (29%)
Geekbench 5.5 - Geekbench 5.1 - 5.4 64 Bit Single-Core
min: 1453     avg: 1497     median: 1505 (64%)     max: 1523 Points
min: 1334     avg: 1388     median: 1391 (59%)     max: 1430 Points
Geekbench 5.5 - Geekbench 5.1 - 5.4 64 Bit Multi-Core
min: 4927     avg: 5375     median: 5308 (10%)     max: 5955 Points
min: 4506     avg: 5611     median: 5773 (10%)     max: 6523 Points
Geekbench 5.0 - Geekbench 5.0 64 Bit Single-Core
min: 1453     avg: 1488     median: 1493.5 (6%)     max: 1510 Points
min: 1340     avg: 1365     median: 1371 (6%)     max: 1383 Points
Geekbench 5.0 - Geekbench 5.0 64 Bit Multi-Core
min: 4864     avg: 5318     median: 5259 (17%)     max: 5890 Points
min: 5031     avg: 5876     median: 6117 (19%)     max: 6479 Points
Geekbench 4.4 - Geekbench 4.1 - 4.4 64 Bit Single-Core
6238 Points (62%)
min: 5553     avg: 5775     median: 5854 (58%)     max: 5918 Points
Geekbench 4.4 - Geekbench 4.1 - 4.4 64 Bit Multi-Core
22045 Points (24%)
min: 21830     avg: 24021     median: 24495 (27%)     max: 25738 Points
Mozilla Kraken 1.1 - Kraken 1.1 Total Score *
min: 662     avg: 669     median: 666.5 (1%)     max: 680 ms
min: 646     avg: 656     median: 654.5 (1%)     max: 667 ms
Octane V2 - Octane V2 Total Score
67714 Points (59%)
min: 64294     avg: 65787     median: 65343 (57%)     max: 67723 Points
WebXPRT 4 - WebXPRT 4 Score
min: 202     avg: 204.7     median: 206 (59%)     max: 206 Points
min: 198.4     avg: 200.8     median: 200 (57%)     max: 204 Points
WebXPRT 3 - WebXPRT 3 Score
min: 243     avg: 258.3     median: 260.5 (54%)     max: 269 Points
min: 243     avg: 254.5     median: 255.5 (53%)     max: 265 Points
CrossMark - CrossMark Overall
min: 1300     avg: 1331     median: 1326 (51%)     max: 1371 Points
min: 1164     avg: 1255     median: 1241.5 (48%)     max: 1373 Points
Power Consumption - Prime95 Power Consumption - external Monitor *
min: 52.5     avg: 54.2     median: 52.8 (9%)     max: 58.6 Watt
min: 22.5     avg: 38     median: 34.5 (6%)     max: 64.9 Watt
Power Consumption - Cinebench R15 Multi Power Consumption - external Monitor *
min: 47.3     avg: 53.5     median: 51 (9%)     max: 64.5 Watt
min: 27.6     avg: 40.9     median: 39.3 (7%)     max: 59.8 Watt
Power Consumption - Idle Power Consumption - external Monitor *
min: 8.12     avg: 8.1     median: 8.1 (5%)     max: 8.16 Watt
min: 3.5     avg: 6.4     median: 6.4 (4%)     max: 9.27 Watt
Power Consumption - Idle Power Consumption 150cd 1min *
6.4 Watt (7%)
5.2 Watt (6%)
Power Consumption - Cinebench R15 Multi Power Efficiency - external Monitor
min: 15.8     avg: 17.4     median: 17.3 (13%)     max: 19.2 Points per Watt
min: 25.9     avg: 34.8     median: 33.6 (25%)     max: 49 Points per Watt

Average Benchmarks Intel Core i5-11320H → 100% n=47

Average Benchmarks AMD Ryzen 5 5600U → 108% n=47

- Range of benchmark values for this graphics card
- Average benchmark values for this graphics card
* Smaller numbers mean a higher performance
1 This benchmark is not used for the average calculation

Add one or more devices and compare

In the following list you can select (and also search for) devices that should be added to the comparison. You can select more than one device.

restrict list:

show all (including archived), 2024, 2023
v1.28
log 04. 20:18:25

#0 checking url part for id 13169 +0s ... 0s

#1 checking url part for id 12983 +0s ... 0s

#2 redirected to Ajax server, took 1720117105 +0s ... 0s

#3 did not recreate cache, as it is less than 5 days old! Created at Thu, 04 Jul 2024 05:15:21 +0200 +0s ... 0s

#4 composed specs +0.006s ... 0.006s

#5 did output specs +0s ... 0.006s

#6 getting avg benchmarks for device 13169 +0.003s ... 0.01s

#7 got single benchmarks 13169 +0.009s ... 0.019s

#8 getting avg benchmarks for device 12983 +0.003s ... 0.022s

#9 got single benchmarks 12983 +0.01s ... 0.032s

#10 got avg benchmarks for devices +0s ... 0.032s

#11 min, max, avg, median took s +0.053s ... 0.085s

#12 return log +0.002s ... 0.087s

Please share our article, every link counts!
> Expert Reviews and News on Laptops, Smartphones and Tech Innovations > Benchmarks / Tech > Processor Comparison - Head 2 Head
Redaktion, 2017-09- 8 (Update: 2023-07- 1)