Notebookcheck Logo

Intel Core i5-11320H vs Apple M2 Pro vs Apple M3

Intel Core i5-11320H

► remove from comparison Intel i5-11320H

The Intel Core i5-11320H is a mid range SoC for thin and light gaming laptops and mobile workstations. It is based on the Tiger Lake H35 refresh generation and will be announced in Q3 2021. It integrates four Willow Cove processor cores (8 threads thanks to HyperThreading). The base clock speed depends on the TDP setting and can vary from 2.5 (28 W TDP) to 3.2 GHz (35 W). The boost of a single and two cores under load can reach up to 4.5 GHz. All four cores can reach up to 4.3 GHz. The L3 cache is reduced to 8 MB compared to the 12 MB of the higher end i7 models.

Thanks to the improved clock speeds, the performance gap to the faster i7-11370H should be quite small. The i7 still offers higher single and dual core Turbo speeds and more L3 cache.

The SoC also included the improved Xe graphics card with 96 CUs clocked at up to 1350 MHz.

Furthermore, Tiger Lake SoCs add PCIe 4 support (four lanes), AI hardware acceleration, and the partial integration of Thunderbolt 4/USB 4 and Wi-Fi 6 in the chip.

The chip is produced on the improved 10nm process (called 10nm SuperFin) at Intel, which should be comparable to the 7nm process at TSMC (e.g. Ryzen 4000 series).

All articles on Tiger Lake can be found on our Tiger Lake architecture hub.


Apple M2 Pro

► remove from comparison Apple M2 Pro

The Apple M2 Pro is a System on a Chip (SoC) from Apple that is found in the early 2023 MacBook Pro 14 and 16-inch models. It offers all 12 cores available in the chip divided in eight performance cores (P-cores) and four power-efficiency cores (E-cores). The E-cores clock with up to 3.4 GHz, the P-Cores up to 3.7 GHz (mostly 3.3 GHz in multi-threaded workloads and 3.4 GHz in single threaded).

The big cores (codename Avalanche) offer 192 KB instruction cache, 128 KB data cache, and 36 MB shared L2 cache (up from 24 MB in the M1 Pro). The four efficiency cores (codename Blizzard) are a lot smaller and offer only 128 KB instruction cache, 64 KB data cache, and 4 MB shared cache. CPU and GPU can both use the 24 MB SLC (System Level Cache). 

The unified memory (16 or 32 GB LPDDR5-6400) next to the chip is connected by a 256 Bit memory controller (200 GB/s bandwidth) and can be used by the GPU and CPU.

Apple states that the M2 Pro has a 25% higher performance than the M1 Pro in Xcode compiling.

The integrated graphics card in the M1 Pro offers all 19 cores.

Furthermore, the SoC integrates a fast 16 core neural engine (faster than M1 Pro), a secure enclave (e.g., for encryption), a unified memory architecture, Thunderbolt 4 controller, an ISP, and media de- and encoders (including ProRes).

The M2 Pro is manufactured in 5 nm at TSMC (second generation) and integrates 40 billion transistors. 

Apple M3

► remove from comparison Apple M3

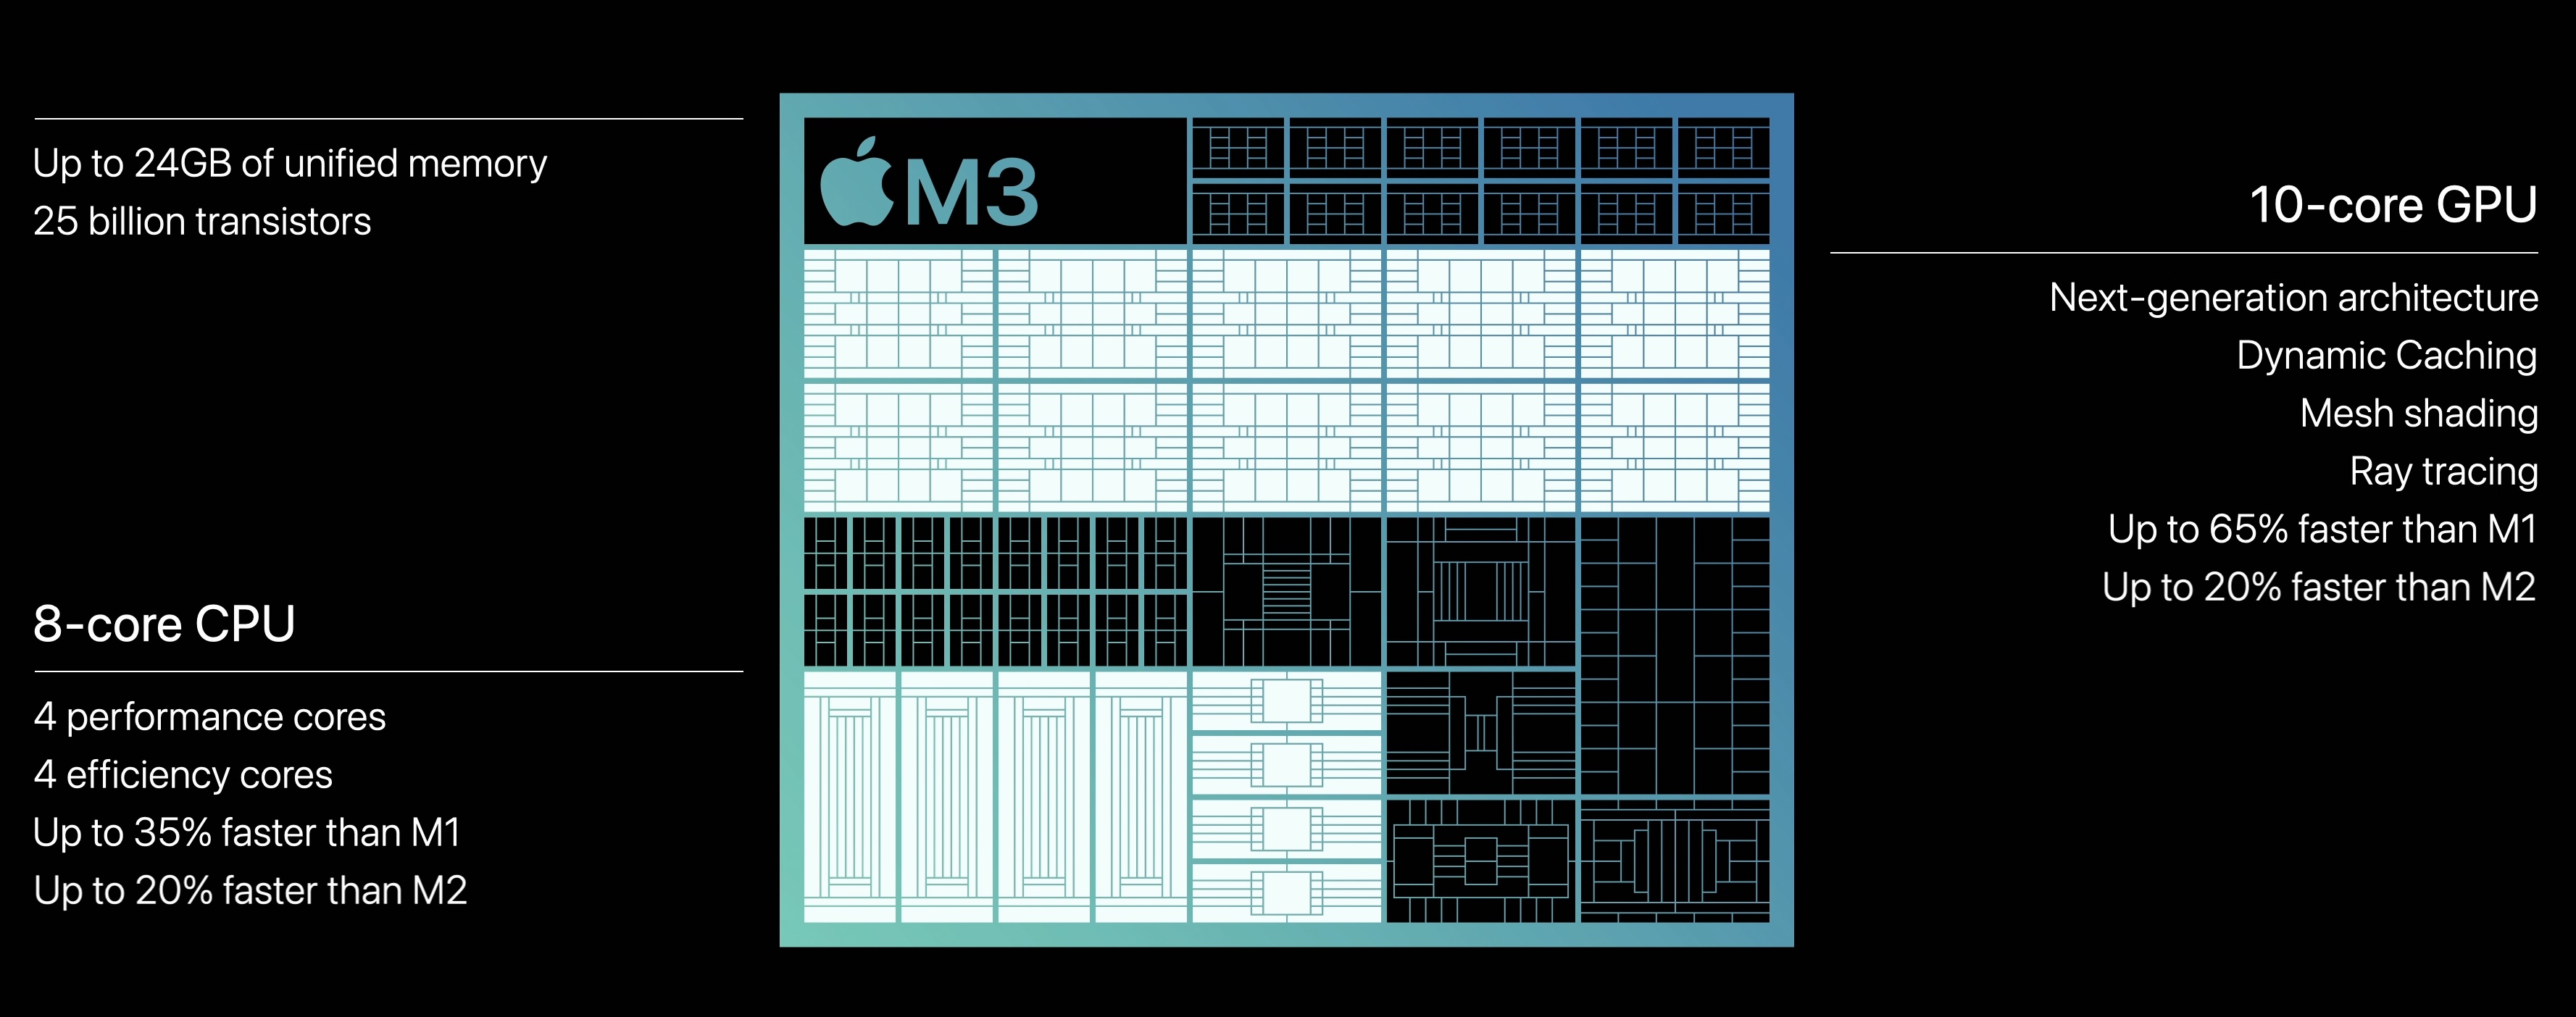
The Apple M3 is a system on a chip (SoC) from Apple for notebooks that was introduced in late 2023. It integrates a new 8-core CPU with 4 performance cores with up to 4.06 GHz and 4 efficiency cores running at up to 2.75 GHz. Apple claims that the CPU is up to 20% faster than in the old Apple M2 (3.5 GHz)

Due to the higher clock speeds and architecture improvements, the processor performance is also significantly better than the M2 in benchmarks (see e.g. Geekbench below) and can keep up with the fastest CPUs in short single-core tests (like the Raptor Lake i9-13950HX).

The M3 also integrates a new graphics adapter with dynamic caching, mesh shading and ray tracing acceleration. According to Apple, it is 20% faster than the GPU in the M2. The chip integrates again 10 GPU cores, but the cheaper variant only offers 8 cores (e.g. in the entry iMac). Furthermore, the GPU only supports 2 displays (an additional 6K60 display to the internal one).

Both GPU and CPU can access the unified memory on the package together. It is still available in 8, 16 and 24 GB variants and offers the same 100 GB/s maximum bandwidth (unlike the Pro models that feature a reduced memory bandwidth). 

The integrated 16-core Neural Engine has also been revised and now offers 18 TOPS peak performance (versus 15.8 TOPS in the M2 but 35 TOPS in the new A17 Pro). The video engine now supports AV1 decoding in hardware. H.264, HEVC and ProRes (RAW) can still be decoded and encoded.

Unfortunately, the integrated wireless network module only supports Wi-Fi 6E (no Wi-Fi 7) and due to the support of only a single external monitor, the chip also has to make do with no Thunderbolt 4 (Thunderbolt 3 / USB 4 support only for up to 40 Gbit/s).

The chip is manufactured on the current 3nm TSMC process (N3B most likely) and contains 25 billion transistors (+25% vs. Apple M2). The 3nm process should also contribute to the excellent efficiency of the chip. Under load, the M3 CPU consumes approximately 20 Watt.

ModelIntel Core i5-11320HApple M2 ProApple M3
SeriesIntel Tiger LakeApple Apple M2Apple Apple M3
CodenameTiger Lake-H35
Series: Apple M3
Intel Core i7-11390H3.4 - 5 GHz4 / 8 cores12 MB L3
Intel Core i7-11375H3.3 - 5 GHz4 / 8 cores12 MB L3
Intel Core i7-11370H3.3 - 4.8 GHz4 / 8 cores12 MB L3
Intel Core i5-11320H « 3.2 - 4.5 GHz4 / 8 cores8 MB L3
Intel Core i5-11300H3.1 - 4.4 GHz4 / 8 cores8 MB L3
Apple M2 Max2.42 - 3.7 GHz12 / 12 cores48 MB L3
Apple M2 Pro « 2.42 - 3.5 GHz12 / 12 cores24 MB L3
Apple M2 Pro 10-Core2.42 - 3.7 GHz10 / 10 cores24 MB L3
Apple M22.42 - 3.48 GHz8 / 8 cores8 MB L3
Apple M3 Max 16-Core2.75 - 4.06 GHz16 / 16 cores
Apple M3 Max 14-Core2.75 - 4.06 GHz14 / 14 cores
Apple M3 Pro 12-Core2.75 - 4.06 GHz12 / 12 cores
Apple M3 Pro 11-Core2.75 - 4.06 GHz11 / 11 cores
Apple M3 « 2.75 - 4.06 GHz8 / 8 cores
Clock3200 - 4500 MHz2424 - 3504 MHz2748 - 4056 MHz
L1 Cache320 KB3.3 MB
L2 Cache5 MB36 MB4 MB
L3 Cache8 MB24 MB
Cores / Threads4 / 812 / 128 / 8
4 x 4.1 GHz Apple M3 P-Core
4 x 2.7 GHz Apple M3 E-Core
TDP35 Watt
Technology10 nm5 nm3 nm
max. Temp.100 °C
SocketBGA1449
FeaturesDDR4-3200/LPDDR4x-4266 RAM, PCIe 4, 4 GT/s bus, DL Boost, GNA, MMX, SSE, SSE2, SSE3, SSSE3, SSE4.1, SSE4.2, AVX, AVX2, AVX-512, BMI2, ABM, FMA, ADX, VMX, SMEP, SMAP, EIST, TM1, TM2, HT, Turbo, SST, AES-NI, RDRAND, RDSEED, SHAARMv8 Instruction SetARMv8 Instruction Set
iGPUIntel Iris Xe Graphics G7 96EUs (400 - 1350 MHz)Apple M2 Pro 19-Core GPUApple M3 10-Core GPU
Architecturex86ARMARM
Announced
Manufacturerark.intel.comwww.apple.com
Transistors40000 Million25000 Million

Benchmarks

Performance Rating - CB R15 + R20 + 7-Zip + X265 + Blender + 3DM11 CPU - i5-11320H
34.3 pt (48%)
Cinebench 2024 - Cinebench 2024 CPU Single Core
100%
1 M2 Pro +
123 Points (85%)
115%
1 M3 +
min: 140     avg: 141     median: 141 (98%)     max: 142 Points
Cinebench 2024 - Cinebench 2024 CPU Multi Core
100%
1 M2 Pro +
1030 Points (19%)
58%
1 M3 +
min: 576     avg: 622     median: 599.5 (11%)     max: 712 Points
Cinebench R23 - Cinebench R23 Multi Core
min: 5720     avg: 5869     median: 5852 (5%)     max: 6051 Points
min: 14787     avg: 14795     median: 14794.5 (14%)     max: 14802 Points
176%
M3 +
min: 10074     avg: 10275     median: 10298 (10%)     max: 10454 Points
Cinebench R23 - Cinebench R23 Single Core
min: 1341     avg: 1432     median: 1460.5 (62%)     max: 1467 Points
min: 1647     avg: 1648     median: 1647.5 (70%)     max: 1648 Points
130%
M3 +
min: 1900     avg: 1901     median: 1900 (81%)     max: 1904 Points
Cinebench R20 - Cinebench R20 CPU (Single Core)
min: 557     avg: 561     median: 560.5 (62%)     max: 567 Points
min: 446     avg: 446.5     median: 446.5 (50%)     max: 447 Points
90%
M3 +
504 Points (56%)
Cinebench R20 - Cinebench R20 CPU (Multi Core)
min: 2208     avg: 2273     median: 2267.5 (6%)     max: 2349 Points
min: 4018     avg: 4031     median: 4031 (10%)     max: 4044 Points
124%
M3 +
2818 Points (7%)
Cinebench R15 - Cinebench R15 CPU Multi 64 Bit
min: 857     avg: 922     median: 905.5 (6%)     max: 1019 Points
2069 Points (13%)
166%
M3 +
1499 Points (9%)
Cinebench R15 - Cinebench R15 CPU Single 64 Bit
min: 212     avg: 213.8     median: 214 (64%)     max: 215 Points
230 Points (69%)
127%
M3 +
271 Points (82%)
Cinebench R11.5 - Cinebench R11.5 CPU Multi 64 Bit
10.8 Points (14%)
Cinebench R11.5 - Cinebench R11.5 CPU Single 64 Bit
2.5 Points (62%)
Cinebench R10 - Cinebench R10 Rend. Single (32bit)
8767 Points (53%)
Cinebench R10 - Cinebench R10 Rend. Multi (32bit)
32576 Points (24%)
Cinebench R10 - Cinebench R10 Rend. Multi (64bit)
42350 Points (29%)
Cinebench R10 - Cinebench R10 Rend. Single (64bit)
11457 Points (14%)
wPrime 2.10 - wPrime 2.0 1024m *
191.4 s (2%)
wPrime 2.10 - wPrime 2.0 32m *
5.9 s (1%)
WinRAR - WinRAR 4.0
5481 Points (9%)
7-Zip 18.03 - 7-Zip 18.03 Multli Thread 4 runs
min: 24718     avg: 25274     median: 24760 (14%)     max: 26858 MIPS
7-Zip 18.03 - 7-Zip 18.03 Single Thread 4 runs
min: 4813     avg: 4996     median: 5025 (60%)     max: 5119 MIPS
HWBOT x265 Benchmark v2.2 - HWBOT x265 4k Preset
min: 7.25     avg: 7.6     median: 7.6 (13%)     max: 7.91 fps
TrueCrypt - TrueCrypt Serpent
0.5 GB/s (0%)
TrueCrypt - TrueCrypt Twofish
0.9 GB/s (16%)
TrueCrypt - TrueCrypt AES
6.1 GB/s (16%)
Blender - Blender 3.3 Classroom CPU *
min: 937     avg: 981     median: 995 (13%)     max: 1010 Seconds
331 Seconds (4%)
107%
M3 +
min: 491     avg: 590     median: 517 (7%)     max: 761 Seconds
Blender - Blender 2.79 BMW27 CPU *
min: 507     avg: 527     median: 528.5 (4%)     max: 543 Seconds
100%
1 M3 +
min: 474     avg: 509     median: 494 (3%)     max: 558 Seconds
R Benchmark 2.5 - R Benchmark 2.5 *
min: 0.581     avg: 0.6     median: 0.6 (13%)     max: 0.622 sec
104%
1 M2 Pro +
0.4 sec (9%)
3DMark 06 - CPU - 3DMark 06 - CPU
10886 Points (23%)
Super Pi mod 1.5 XS 1M - Super Pi mod 1.5 XS 1M *
7.5 s (2%)
Super Pi mod 1.5 XS 2M - Super Pi mod 1.5 XS 2M *
16.8 s (1%)
Super Pi Mod 1.5 XS 32M - Super Pi mod 1.5 XS 32M *
389.7 s (2%)
3DMark Vantage - 3DM Vant. Perf. CPU no Physx
33603 Points (29%)
3DMark 11 - 3DM11 Performance Physics
min: 10666     avg: 11575     median: 11487 (31%)     max: 12778 Points
3DMark - 3DMark Ice Storm Physics
min: 66612     avg: 66703     median: 66702.5 (54%)     max: 66793 Points
3DMark - 3DMark Ice Storm Extreme Physics
min: 66629     avg: 67222     median: 67221.5 (55%)     max: 67814 Points
3DMark - 3DMark Ice Storm Unlimited Physics
min: 70639     avg: 70683     median: 70683 (60%)     max: 70727 Points
3DMark - 3DMark Cloud Gate Physics
min: 8860     avg: 9380     median: 9363 (24%)     max: 10187 Points
3DMark - 3DMark Fire Strike Standard Physics
min: 13123     avg: 13891     median: 13763 (25%)     max: 14950 Points
3DMark - 3DMark Time Spy CPU
min: 4803     avg: 5132     median: 5199 (22%)     max: 5637 Points
Geekbench 6.2 - Geekbench 6.2 Single-Core
100%
1 M2 Pro +
2663 Points (72%)
116%
1 M3 +
min: 3026     avg: 3077     median: 3076 (83%)     max: 3130 Points
Geekbench 6.2 - Geekbench 6.2 Multi-Core
100%
1 M2 Pro +
14568 Points (57%)
82%
1 M3 +
min: 11863     avg: 11984     median: 11992 (47%)     max: 12066 Points
Geekbench 5.5 - Geekbench 5.1 - 5.4 64 Bit Single-Core
min: 1453     avg: 1497     median: 1505 (64%)     max: 1523 Points
min: 1952     avg: 1957     median: 1957 (83%)     max: 1961 Points
156%
M3 +
min: 2256     avg: 2316     median: 2342 (99%)     max: 2350 Points
Geekbench 5.5 - Geekbench 5.1 - 5.4 64 Bit Multi-Core
min: 4927     avg: 5375     median: 5308 (10%)     max: 5955 Points
min: 14859     avg: 14961     median: 15010 (27%)     max: 15013 Points
202%
M3 +
min: 10570     avg: 10697     median: 10748 (19%)     max: 10774 Points
Geekbench 5.0 - Geekbench 5.0 64 Bit Single-Core
min: 1453     avg: 1488     median: 1493.5 (6%)     max: 1510 Points
Geekbench 5.0 - Geekbench 5.0 64 Bit Multi-Core
min: 4864     avg: 5318     median: 5259 (17%)     max: 5890 Points
Geekbench 4.4 - Geekbench 4.1 - 4.4 64 Bit Single-Core
6238 Points (62%)
Geekbench 4.4 - Geekbench 4.1 - 4.4 64 Bit Multi-Core
22045 Points (24%)
Mozilla Kraken 1.1 - Kraken 1.1 Total Score *
min: 662     avg: 669     median: 666.5 (1%)     max: 680 ms
443.8 ms (1%)
100%
M3 +
min: 362.8     avg: 366.4     median: 363.1 (0%)     max: 373.2 ms
Octane V2 - Octane V2 Total Score
67714 Points (59%)
76205 Points (67%)
143%
M3 +
min: 96622     avg: 97216     median: 96933 (85%)     max: 98093 Points
WebXPRT 4 - WebXPRT 4 Score
min: 202     avg: 204.7     median: 206 (59%)     max: 206 Points
253 Points (73%)
152%
M3 +
min: 313     avg: 314     median: 314 (90%)     max: 315 Points
WebXPRT 3 - WebXPRT 3 Score
min: 243     avg: 258.3     median: 260.5 (54%)     max: 269 Points
386 Points (80%)
171%
M3 +
min: 423     avg: 438.7     median: 445 (93%)     max: 448 Points
CrossMark - CrossMark Overall
min: 1300     avg: 1331     median: 1326 (51%)     max: 1371 Points
min: 1797     avg: 1805     median: 1804.5 (69%)     max: 1812 Points
139%
M3 +
min: 1847     avg: 1850     median: 1847 (71%)     max: 1857 Points
Power Consumption - Prime95 Power Consumption - external Monitor *
min: 52.5     avg: 54.2     median: 52.8 (9%)     max: 58.6 Watt
Power Consumption - Cinebench R15 Multi Power Consumption - external Monitor *
min: 47.3     avg: 53.5     median: 51 (9%)     max: 64.5 Watt
Power Consumption - Idle Power Consumption - external Monitor *
min: 8.12     avg: 8.1     median: 8.1 (5%)     max: 8.16 Watt
104%
1 M3 +
min: 2.63     avg: 2.8     median: 2.8 (2%)     max: 2.87 Watt
Power Consumption - Idle Power Consumption 150cd 1min *
6.4 Watt (7%)
102%
1 M3 +
min: 3.94     avg: 4.4     median: 4.4 (5%)     max: 4.7 Watt
Power Consumption - Cinebench R15 Multi Power Efficiency - external Monitor
min: 15.8     avg: 17.4     median: 17.3 (13%)     max: 19.2 Points per Watt

Average Benchmarks Intel Core i5-11320H → 100% n=14

Average Benchmarks Apple M2 Pro → 150% n=14

Average Benchmarks Apple M3 → 142% n=14

- Range of benchmark values for this graphics card
- Average benchmark values for this graphics card
* Smaller numbers mean a higher performance
1 This benchmark is not used for the average calculation

v1.28
log 26. 23:43:06

#0 checking url part for id 13169 +0s ... 0s

#1 checking url part for id 14973 +0s ... 0s

#2 checking url part for id 15110 +0s ... 0s

#3 redirected to Ajax server, took 1719438186 +0s ... 0s

#4 did not recreate cache, as it is less than 5 days old! Created at Tue, 25 Jun 2024 05:15:18 +0200 +0s ... 0s

#5 composed specs +0.007s ... 0.007s

#6 did output specs +0s ... 0.007s

#7 getting avg benchmarks for device 13169 +0.004s ... 0.011s

#8 got single benchmarks 13169 +0.01s ... 0.021s

#9 getting avg benchmarks for device 14973 +0.001s ... 0.022s

#10 got single benchmarks 14973 +0.005s ... 0.027s

#11 getting avg benchmarks for device 15110 +0.001s ... 0.027s

#12 got single benchmarks 15110 +0.006s ... 0.034s

#13 got avg benchmarks for devices +0s ... 0.034s

#14 min, max, avg, median took s +0.046s ... 0.08s

#15 return log +0s ... 0.08s

Please share our article, every link counts!
> Expert Reviews and News on Laptops, Smartphones and Tech Innovations > Benchmarks / Tech > Processor Comparison - Head 2 Head
Redaktion, 2017-09- 8 (Update: 2023-07- 1)