Intel Core i5-11300H vs Apple M2 vs Intel Core i5-11320H
Intel Core i5-11300H ► remove from comparison
The Intel Core i5-11300H is a mid range SoC for thin and light gaming laptops and mobile workstations. It is based on the Tiger Lake H35 generation and was announced early 2021. It integrates four Willow Cove processor cores (8 threads thanks to Hyper-Threading). The base clock speed depends on the TDP setting and can vary from 2.6 (28 W TDP) to 3.1 GHz (35 W). The boost of a single and two cores under load can reach up to 4.4 GHz. All four cores can reach up to 4 GHz. The L3 cache is reduced to 8 MB compared to the 12 MB of the higher end i7 models.
The SoC also has the improved Xe graphics adapter with 80 CUs running at up to 1,300 MHz.
Furthermore, Tiger Lake SoCs add PCIe 4 support (four lanes), AI hardware acceleration, and the partial integration of Thunderbolt 4/USB 4 and Wi-Fi 6 in the chip.
All articles on Tiger Lake can be found on our Tiger Lake architecture hub .
Performance
The average 11300H in our database proves to be an OK lower mid-range CPU, as of early 2022, its multi-thread benchmark scores nearly matching those of the AMD Ryzen 3 5300U . The Core i5 will handle most day-to-day activities with ease, only sweating at the sight of latest triple-A games and similar tasks.
Thanks to its decent cooling solution and a long-term CPU power limit of 40 W, the Nitro 5 AN517-53 is among the fastest laptops built around the 11300H that we know of. It can be around 50% faster in CPU-bound workloads than the slowest system featuring the same chip in our database, as of August 2023.
Power consumption
This Core i5 series chip has a default TDP of 28 W to 35 W, the expectation being that laptop makers will go for a higher value in exchange for higher performance. Either way, these values are way too high to allow for passively cooled designs.
The i5-11300H is built with Intel's third-generation 10 nm process marketed as SuperFin for lower-than-average, as of mid 2023, energy efficiency.
Apple M2 ► remove from comparison
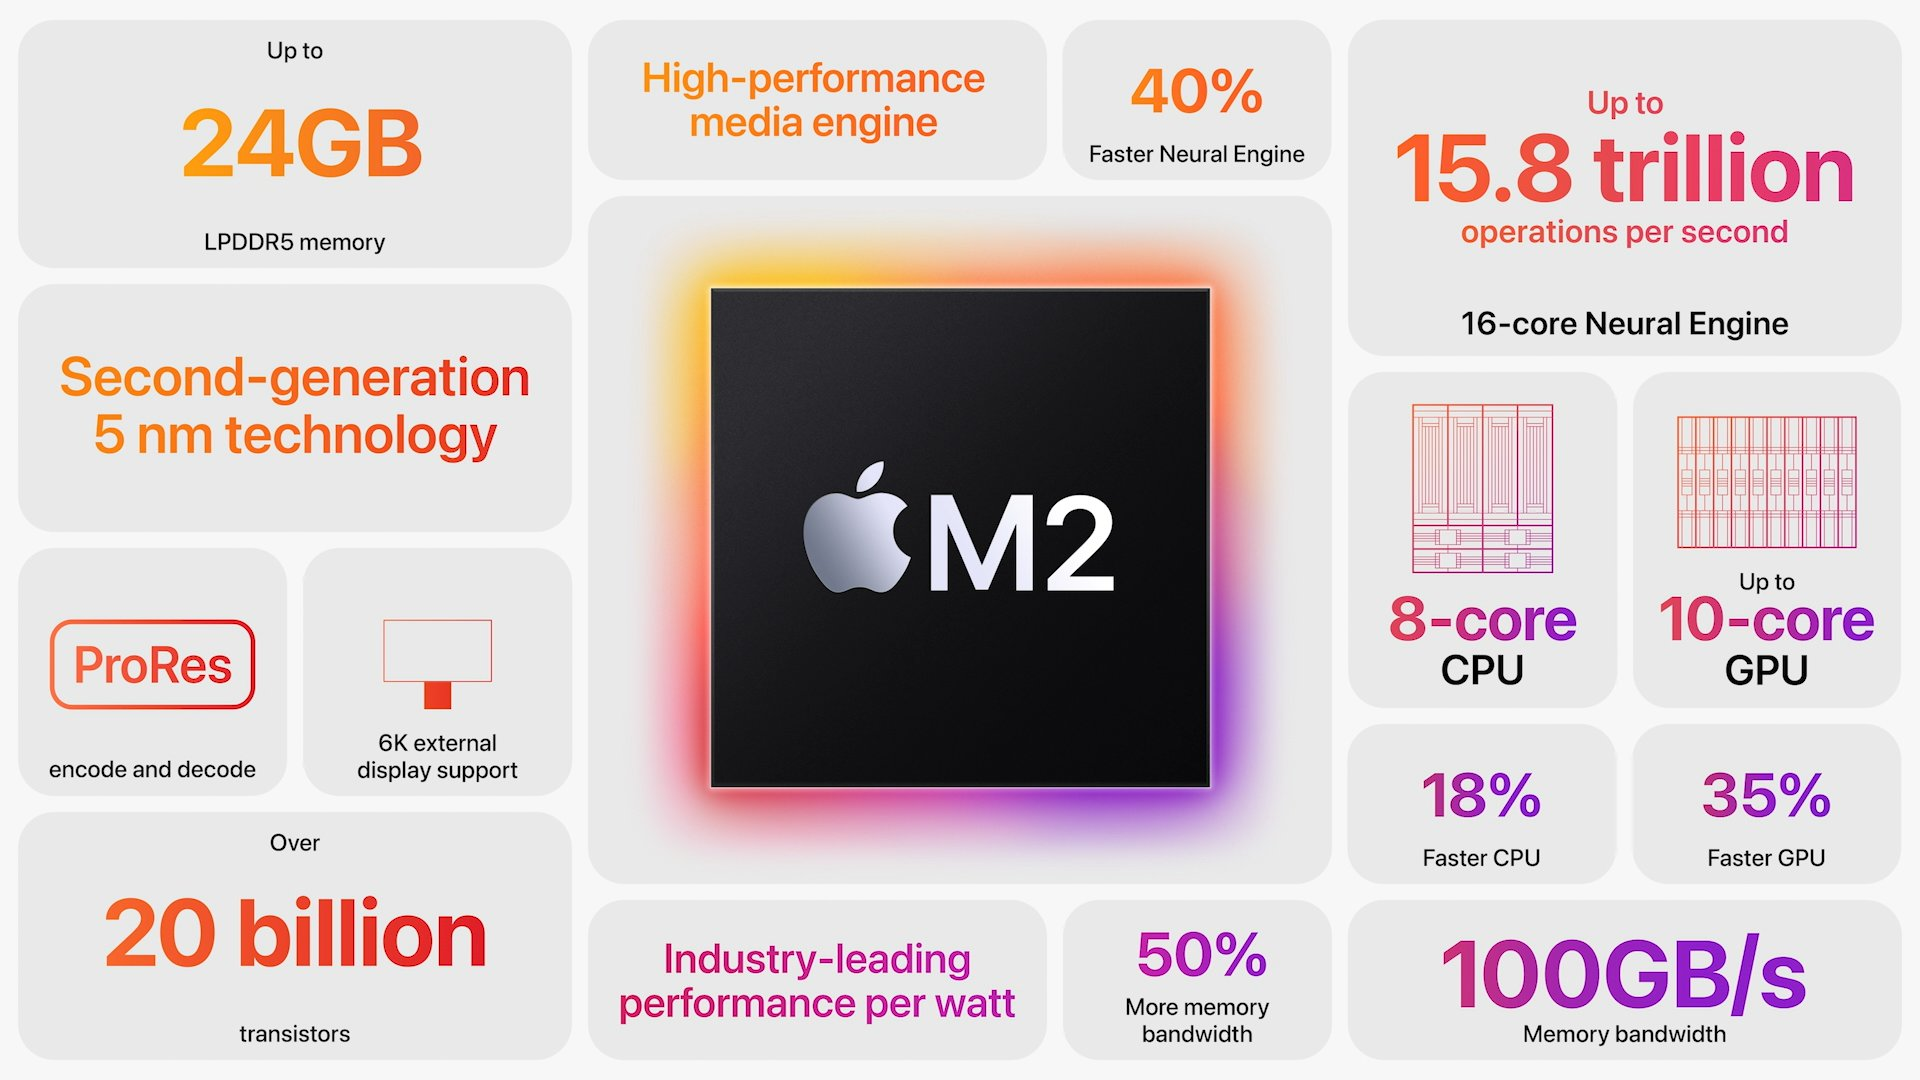
The Apple M2 is a System on a Chip (SoC) from Apple that is found in the late 2022 MacBook Air and, MacBook Pro 13. It offers 8 cores divided in four performance cores and four power-efficiency cores. The big cores offer 192 KB instruction cache, 128 KB data cache, and 16 MB shared L2 cache (up from 12 MB). The four efficiency cores are a lot smaller and offer only 128 KB instruction cache, 64 KB data cache, and 4 MB shared cache. The efficiency cores (E cluster) clock with up to 2,4 GHz, the performance cores (P cluster) with up to 3,5 GHz and therefore higher than the M1 cores. The architecture should be similar to the A15 (iPhone 13) with Avalanche and Blizzard cores.
The chip features a unified memory architecture for the CPU and GPU cores and supports up to 24 GB LPDDR5-6400 for a bandwidth of up to 100GB/s.
According to Apple, the M2 offers a 18% higher CPU performance at the same power consumption level compared to the Apple M1 . In our tests, the MacBook Pro 13 with active cooling was able to reach the 18% in Geekbench Multi. In other benchmarks we measured 12 to 15% gains compared to the M1. Therefore, the performance is now near the M1 Pro with 8 cores . The passively cooled MacBook Air may however suffer from throttling in longer load scenarios.
The integrated graphics card in the M2 offers 8 or 10 cores and a peak performance of 3.6 TFLOPs.
Furthermore, the SoC integrates a fast 16 core neural engine with a peak performance of 16 TOPS (for AI hardware acceleration), a secure enclave (e.g., for encryption), Thunderbolt / USB 4 controller, an ISP, and media de- and encoders.
The Apple M2 includes 20 billion transistors (up from the 16 billion of the M1) and is manufactured in the second generation 5nm process at TSMC (most likely N5P). The power consumption is rated at 20W what we also measured under CPU load.
Intel Core i5-11320H ► remove from comparison
The Intel Core i5-11320H is a mid range SoC for thin and light gaming laptops and mobile workstations. It is based on the Tiger Lake H35 refresh generation and will be announced in Q3 2021. It integrates four Willow Cove processor cores (8 threads thanks to HyperThreading). The base clock speed depends on the TDP setting and can vary from 2.5 (28 W TDP) to 3.2 GHz (35 W). The boost of a single and two cores under load can reach up to 4.5 GHz. All four cores can reach up to 4.3 GHz. The L3 cache is reduced to 8 MB compared to the 12 MB of the higher end i7 models.
Thanks to the improved clock speeds, the performance gap to the faster i7-11370H should be quite small. The i7 still offers higher single and dual core Turbo speeds and more L3 cache.
The SoC also included the improved Xe graphics card with 96 CUs clocked at up to 1350 MHz.
Furthermore, Tiger Lake SoCs add PCIe 4 support (four lanes), AI hardware acceleration, and the partial integration of Thunderbolt 4/USB 4 and Wi-Fi 6 in the chip.
The chip is produced on the improved 10nm process (called 10nm SuperFin) at Intel, which should be comparable to the 7nm process at TSMC (e.g. Ryzen 4000 series).
All articles on Tiger Lake can be found on our Tiger Lake architecture hub .
Model Intel Core i5-11300H Apple M2 Intel Core i5-11320H Series Intel Tiger Lake Apple Apple M2 Intel Tiger Lake Codename Tiger Lake-H35 Tiger Lake-H35 Series: Tiger Lake Tiger Lake-H35 Clock 3100 - 4400 MHz 2424 - 3480 MHz 3200 - 4500 MHz L1 Cache 320 KB 2 MB 320 KB L2 Cache 5 MB 20 MB 5 MB L3 Cache 8 MB 8 MB 8 MB Cores / Threads 4 / 8 8 / 8 4 / 8 TDP 35 Watt 20 Watt 35 Watt Technology 10 nm 5 nm 10 nm max. Temp. 100 °C 100 °C Socket BGA1449/LGA1449 BGA1449 Features DDR4-3200/LPDDR4x-4266 RAM, PCIe 4, 4 GT/s bus, DL Boost, GNA, MMX, SSE, SSE2, SSE3, SSSE3, SSE4.1, SSE4.2, AVX, AVX2, AVX-512, BMI2, ABM, FMA, ADX, VMX, SMEP, SMAP, EIST, TM1, TM2, Hyper-Threading, Turbo, SST, AES-NI, RDRAND, RDSEED, SHA ARMv8 Instruction Set DDR4-3200/LPDDR4x-4266 RAM, PCIe 4, 4 GT/s bus, DL Boost, GNA, MMX, SSE, SSE2, SSE3, SSSE3, SSE4.1, SSE4.2, AVX, AVX2, AVX-512, BMI2, ABM, FMA, ADX, VMX, SMEP, SMAP, EIST, TM1, TM2, HT, Turbo, SST, AES-NI, RDRAND, RDSEED, SHA iGPU Intel Iris Xe Graphics G7 80EUs (400 - 1300 MHz)Apple M2 10-Core GPU ( - 1398 MHz)Intel Iris Xe Graphics G7 96EUs (400 - 1350 MHz)Architecture x86 ARM x86 Announced Manufacturer ark.intel.com www.apple.com ark.intel.com Transistors 20000 Million
Benchmarks Performance Rating - CB R15 + R20 + 7-Zip + X265 + Blender + 3DM11 CPU - i5-11300H
32.9 pt (46%)
...
...
max:
Performance Rating - CB R15 + R20 + 7-Zip + X265 + Blender + 3DM11 CPU - i5-11320H
34.3 pt (48%)
...
...
max:
Cinebench 2024 - Cinebench 2024 CPU Single Core
121 Points (84%)
Cinebench 2024 - Cinebench 2024 CPU Multi Core
513 Points (10%)
Cinebench R23 - Cinebench R23 Multi Core
min: 3313 avg: 5564 median: 5702 (5%) max: 6581 Points
CPU TDP ? TDP 15 W TDP 25 W TDP 35 W TDP 40 W TDP 42 W TDP 45 W 76% 89% 75% 80% 100% 86% 97%
min: 8517 avg: 8654 median: 8667 (8%) max: 8772 Points
CPU TDP ? TDP 9 W TDP 15 W TDP 19 W TDP 20 W TDP 25 W TDP 35 W TDP 40 W TDP 42 W TDP 45 W 56% 98% 66% 100% 100% 56% 59% 74% 64% 72%
min: 5720 avg: 5869 median: 5852 (5%) max: 6051 Points
CPU TDP ? TDP 9 W TDP 15 W TDP 19 W TDP 20 W TDP 25 W TDP 35 W TDP 40 W TDP 42 W TDP 45 W 56% 98% 66% 100% 100% 56% 65% 74% 64% 72%
Cinebench R23 - Cinebench R23 Single Core
min: 1218 avg: 1373 median: 1378 (59%) max: 1431 Points
CPU TDP ? TDP 15 W TDP 25 W TDP 35 W TDP 40 W TDP 42 W TDP 45 W 97% 98% 96% 85% 100% 94% 96%
min: 1580 avg: 1595 median: 1585 (67%) max: 1638 Points
CPU TDP ? TDP 9 W TDP 15 W TDP 19 W TDP 20 W TDP 25 W TDP 35 W TDP 40 W TDP 42 W TDP 45 W 84% 97% 86% 100% 97% 83% 74% 87% 82% 83%
min: 1341 avg: 1432 median: 1460.5 (62%) max: 1467 Points
CPU TDP ? TDP 9 W TDP 15 W TDP 19 W TDP 20 W TDP 25 W TDP 35 W TDP 40 W TDP 42 W TDP 45 W 84% 97% 86% 100% 97% 83% 85% 87% 82% 83%
Cinebench R20 - Cinebench R20 CPU (Single Core)
min: 431 avg: 522 median: 529 (59%) max: 548 Points
CPU TDP ? TDP 15 W TDP 25 W TDP 35 W TDP 40 W TDP 42 W TDP 45 W 97% 99% 96% 79% 100% 90% 97%
min: 216 avg: 370.8 median: 381 (42%) max: 446 Points
CPU TDP ? TDP 9 W TDP 15 W TDP 19 W TDP 20 W TDP 25 W TDP 35 W TDP 40 W TDP 42 W TDP 45 W 97% 63% 99% 82% 70% 96% 79% 100% 90% 97%
min: 557 avg: 561 median: 560.5 (62%) max: 567 Points
CPU TDP ? TDP 9 W TDP 15 W TDP 19 W TDP 20 W TDP 25 W TDP 35 W TDP 40 W TDP 42 W TDP 45 W 97% 63% 99% 82% 70% 96% 98% 100% 90% 97%
Cinebench R20 - Cinebench R20 CPU (Multi Core)
min: 1300 avg: 2146 median: 2247.5 (5%) max: 2533 Points
CPU TDP ? TDP 15 W TDP 25 W TDP 35 W TDP 40 W TDP 42 W TDP 45 W 77% 91% 78% 81% 100% 92% 99%
min: 2231 avg: 2325 median: 2324 (6%) max: 2416 Points
CPU TDP ? TDP 9 W TDP 15 W TDP 19 W TDP 20 W TDP 25 W TDP 35 W TDP 40 W TDP 42 W TDP 45 W 77% 93% 91% 98% 96% 78% 81% 100% 92% 99%
min: 2208 avg: 2273 median: 2267.5 (6%) max: 2349 Points
CPU TDP ? TDP 9 W TDP 15 W TDP 19 W TDP 20 W TDP 25 W TDP 35 W TDP 40 W TDP 42 W TDP 45 W 77% 93% 91% 98% 96% 78% 90% 100% 92% 99%
Cinebench R15 - Cinebench R15 CPU Multi 64 Bit
min: 632 avg: 895 median: 961 (6%) max: 990 Points
CPU TDP ? TDP 15 W TDP 25 W TDP 35 W TDP 40 W TDP 42 W TDP 45 W 81% 83% 79% 98% 100% 97% 98%
min: 1209.9 avg: 1222 median: 1215 (8%) max: 1243 Points
CPU TDP ? TDP 9 W TDP 15 W TDP 19 W TDP 20 W TDP 25 W TDP 35 W TDP 40 W TDP 42 W TDP 45 W 65% 98% 66% 100% 99% 63% 78% 80% 77% 78%
min: 857 avg: 922 median: 905.5 (6%) max: 1019 Points
CPU TDP ? TDP 9 W TDP 15 W TDP 19 W TDP 20 W TDP 25 W TDP 35 W TDP 40 W TDP 42 W TDP 45 W 65% 98% 66% 100% 99% 63% 75% 80% 77% 78%
Cinebench R15 - Cinebench R15 CPU Single 64 Bit
min: 123 avg: 173.4 median: 187 (56%) max: 211 Points
CPU TDP 15 W TDP 25 W TDP 35 W TDP 40 W TDP 42 W TDP 45 W 59% 67% 100% 93% 100% 95%
min: 222 avg: 223.8 median: 223 (67%) max: 229 Points
CPU TDP 9 W TDP 15 W TDP 19 W TDP 20 W TDP 25 W TDP 35 W TDP 40 W TDP 42 W TDP 45 W 97% 54% 100% 97% 61% 91% 84% 91% 86%
min: 212 avg: 213.8 median: 214 (64%) max: 215 Points
CPU TDP 9 W TDP 15 W TDP 19 W TDP 20 W TDP 25 W TDP 35 W TDP 40 W TDP 42 W TDP 45 W 97% 54% 100% 97% 61% 93% 84% 91% 86%
Cinebench R11.5 - Cinebench R11.5 CPU Multi 64 Bit
11 Points (14%)
10.8 Points (14%)
CPU TDP 35 W TDP 40 W 98% 100%
Cinebench R11.5 - Cinebench R11.5 CPU Single 64 Bit
2.5 Points (62%)
2.5 Points (62%)
CPU TDP 35 W TDP 40 W 100% 99%
Cinebench R10 - Cinebench R10 Rend. Single (32bit)
8663 Points (52%)
8767 Points (53%)
CPU TDP 35 W TDP 40 W 100% 99%
Cinebench R10 - Cinebench R10 Rend. Multi (32bit)
30491 Points (22%)
32576 Points (24%)
CPU TDP 35 W TDP 40 W 100% 94%
Cinebench R10 - Cinebench R10 Rend. Multi (64bit)
42350 Points (29%)
Cinebench R10 - Cinebench R10 Rend. Single (64bit)
11457 Points (14%)
wPrime 2.10 - wPrime 2.0 1024m *
191.4 s (2%)
wPrime 2.10 - wPrime 2.0 32m *
5.9 s (1%)
4926 Points (8%)
5481 Points (9%)
CPU TDP 35 W TDP 40 W 100% 90%
7-Zip 18.03 - 7-Zip 18.03 Multli Thread 4 runs
min: 17573 avg: 23562 median: 24688.5 (14%) max: 26001 MIPS
CPU TDP ? TDP 15 W TDP 25 W TDP 35 W TDP 40 W TDP 42 W TDP 45 W 83% 95% 79% 100% 98% 95% 92%
min: 24718 avg: 25274 median: 24760 (14%) max: 26858 MIPS
CPU TDP ? TDP 15 W TDP 25 W TDP 35 W TDP 40 W TDP 42 W TDP 45 W 85% 97% 81% 100% 100% 97% 94%
7-Zip 18.03 - 7-Zip 18.03 Single Thread 4 runs
min: 4603 avg: 4872 median: 4930.5 (59%) max: 4969 MIPS
CPU TDP ? TDP 15 W TDP 25 W TDP 35 W TDP 40 W TDP 42 W TDP 45 W 100% 96% 100% 98% 100% 97% 93%
min: 4813 avg: 4996 median: 5025 (60%) max: 5119 MIPS
CPU TDP ? TDP 15 W TDP 25 W TDP 35 W TDP 40 W TDP 42 W TDP 45 W 99% 96% 99% 100% 100% 97% 93%
X264 HD Benchmark 4.0 - x264 Pass 2
58.9 fps (21%)
X264 HD Benchmark 4.0 - x264 Pass 1
215.6 fps (50%)
HWBOT x265 Benchmark v2.2 - HWBOT x265 4k Preset
min: 4.32 avg: 7 median: 7.3 (13%) max: 8.38 fps
CPU TDP ? TDP 15 W TDP 25 W TDP 35 W TDP 40 W TDP 42 W TDP 45 W 78% 87% 70% 94% 96% 100% 98%
min: 7.25 avg: 7.6 median: 7.6 (13%) max: 7.91 fps
CPU TDP ? TDP 15 W TDP 25 W TDP 35 W TDP 40 W TDP 42 W TDP 45 W 78% 87% 70% 94% 96% 100% 98%
TrueCrypt - TrueCrypt Serpent
0.5 GB/s (0%)
0.5 GB/s (0%)
CPU TDP 35 W TDP 40 W 100% 86%
TrueCrypt - TrueCrypt Twofish
0.8 GB/s (13%)
0.9 GB/s (16%)
CPU TDP 35 W TDP 40 W 100% 85%
TrueCrypt - TrueCrypt AES
5.3 GB/s (14%)
6.1 GB/s (16%)
CPU TDP 35 W TDP 40 W 100% 87%
Blender - Blender 3.3 Classroom CPU *
min: 540 avg: 620 median: 619.5 (8%) max: 702 Seconds
CPU TDP 9 W TDP 19 W 100% 101%
min: 937 avg: 981 median: 995 (13%) max: 1010 Seconds
CPU TDP 9 W TDP 19 W TDP 35 W 105% 106% 100%
Blender - Blender 2.79 BMW27 CPU *
min: 466 avg: 572 median: 530 (4%) max: 862 Seconds
CPU TDP ? TDP 15 W TDP 25 W TDP 35 W TDP 40 W TDP 42 W TDP 45 W 100% 100% 100% 101% 101% 101% 101%
min: 549 avg: 614 median: 597 (4%) max: 713 Seconds
CPU TDP ? TDP 9 W TDP 15 W TDP 19 W TDP 20 W TDP 25 W TDP 35 W TDP 40 W TDP 42 W TDP 45 W 100% 100% 100% 101% 100% 100% 101% 101% 101% 101%
min: 507 avg: 527 median: 528.5 (4%) max: 543 Seconds
CPU TDP ? TDP 9 W TDP 15 W TDP 19 W TDP 20 W TDP 25 W TDP 35 W TDP 40 W TDP 42 W TDP 45 W 100% 100% 100% 101% 100% 100% 101% 101% 101% 101%
R Benchmark 2.5 - R Benchmark 2.5 *
min: 0.6 avg: 0.6 median: 0.6 (13%) max: 0.644 sec
CPU TDP ? TDP 15 W TDP 25 W TDP 35 W TDP 40 W TDP 42 W TDP 45 W 101% 101% 100% 101% 101% 101% 100%
min: 0.581 avg: 0.6 median: 0.6 (13%) max: 0.622 sec
CPU TDP ? TDP 15 W TDP 25 W TDP 35 W TDP 40 W TDP 42 W TDP 45 W 101% 101% 100% 101% 101% 101% 100%
3DMark 06 - CPU - 3DMark 06 - CPU
10250 Points (22%)
10886 Points (23%)
CPU TDP 35 W TDP 40 W 100% 94%
Super Pi mod 1.5 XS 1M - Super Pi mod 1.5 XS 1M *
8 s (2%)
7.5 s (2%)
CPU TDP 35 W TDP 40 W 100% 100%
Super Pi mod 1.5 XS 2M - Super Pi mod 1.5 XS 2M *
16.9 s (1%)
16.8 s (1%)
CPU TDP 35 W TDP 40 W 100% 100%
Super Pi Mod 1.5 XS 32M - Super Pi mod 1.5 XS 32M *
404.7 s (2%)
389.7 s (2%)
CPU TDP 35 W TDP 40 W 100% 100%
3DMark Vantage - 3DM Vant. Perf. CPU no Physx
34470 Points (30%)
33603 Points (29%)
CPU TDP 35 W TDP 40 W 97% 100%
3DMark 11 - 3DM11 Performance Physics
min: 5383 avg: 9909 median: 10532 (28%) max: 12133 Points
CPU TDP ? TDP 15 W TDP 25 W TDP 35 W TDP 40 W TDP 42 W TDP 45 W 64% 100% 44% 97% 89% 83% 87%
min: 10666 avg: 11575 median: 11487 (31%) max: 12778 Points
CPU TDP ? TDP 15 W TDP 25 W TDP 35 W TDP 40 W TDP 42 W TDP 45 W 85% 100% 44% 94% 89% 83% 87%
3DMark - 3DMark Ice Storm Physics
min: 48608 avg: 55131 median: 55902.5 (45%) max: 60111 Points
CPU TDP 25 W TDP 40 W TDP 45 W 86% 90% 100%
min: 66612 avg: 66703 median: 66702.5 (54%) max: 66793 Points
CPU TDP 25 W TDP 35 W TDP 40 W TDP 45 W 78% 100% 81% 90%
3DMark - 3DMark Ice Storm Extreme Physics
min: 48519 avg: 49823 median: 49822.5 (40%) max: 51126 Points
CPU TDP 25 W TDP 40 W 100% 95%
min: 66629 avg: 67222 median: 67221.5 (55%) max: 67814 Points
CPU TDP 25 W TDP 35 W TDP 40 W 76% 100% 72%
3DMark - 3DMark Ice Storm Unlimited Physics
min: 57986 avg: 62641 median: 64261 (54%) max: 65675 Points
CPU TDP ? TDP 25 W TDP 40 W 98% 88% 100%
min: 70639 avg: 70683 median: 70683 (60%) max: 70727 Points
CPU TDP ? TDP 25 W TDP 35 W TDP 40 W 91% 82% 100% 93%
3DMark - 3DMark Cloud Gate Physics
min: 5577 avg: 8084 median: 8912 (23%) max: 9472 Points
CPU TDP ? TDP 25 W TDP 35 W TDP 40 W TDP 42 W TDP 45 W 74% 59% 100% 95% 94% 80%
min: 8860 avg: 9380 median: 9363 (24%) max: 10187 Points
CPU TDP ? TDP 25 W TDP 35 W TDP 40 W TDP 42 W TDP 45 W 75% 59% 100% 96% 95% 81%
3DMark - 3DMark Fire Strike Standard Physics
min: 6781 avg: 11660 median: 13112.5 (23%) max: 13901 Points
CPU TDP ? TDP 15 W TDP 25 W TDP 35 W TDP 40 W TDP 42 W TDP 45 W 49% 60% 80% 100% 97% 96% 93%
min: 13123 avg: 13891 median: 13763 (25%) max: 14950 Points
CPU TDP ? TDP 15 W TDP 25 W TDP 35 W TDP 40 W TDP 42 W TDP 45 W 49% 60% 80% 100% 97% 96% 93%
3DMark - 3DMark Time Spy CPU
min: 3124 avg: 4581 median: 4850 (20%) max: 5424 Points
CPU TDP ? TDP 15 W TDP 25 W TDP 35 W TDP 40 W TDP 42 W TDP 45 W 58% 96% 63% 100% 89% 87% 94%
min: 4803 avg: 5132 median: 5199 (22%) max: 5637 Points
CPU TDP ? TDP 15 W TDP 25 W TDP 35 W TDP 40 W TDP 42 W TDP 45 W 60% 100% 65% 100% 93% 91% 98%
Geekbench 6.2 - Geekbench 6.2 Single-Core
min: 2587 avg: 2609 median: 2599 (70%) max: 2650 Points
CPU TDP ? TDP 9 W TDP 19 W 98% 98% 100%
Geekbench 6.2 - Geekbench 6.2 Multi-Core
min: 10034 avg: 10083 median: 10089 (40%) max: 10120 Points
CPU TDP ? TDP 9 W TDP 19 W 100% 100% 99%
Geekbench 5.5 - Geekbench 5.1 - 5.4 64 Bit Single-Core
min: 1342 avg: 1410 median: 1415 (60%) max: 1462 Points
CPU TDP ? TDP 15 W TDP 25 W TDP 35 W TDP 40 W TDP 42 W TDP 45 W 98% 100% 93% 99% 99% 97% 97%
min: 1887 avg: 1914 median: 1915.5 (81%) max: 1953 Points
CPU TDP ? TDP 9 W TDP 15 W TDP 19 W TDP 20 W TDP 25 W TDP 35 W TDP 40 W TDP 42 W TDP 45 W 85% 98% 74% 100% 99% 69% 73% 73% 71% 72%
min: 1453 avg: 1497 median: 1505 (64%) max: 1523 Points
CPU TDP ? TDP 9 W TDP 15 W TDP 19 W TDP 20 W TDP 25 W TDP 35 W TDP 40 W TDP 42 W TDP 45 W 85% 98% 74% 100% 99% 69% 76% 73% 71% 72%
Geekbench 5.5 - Geekbench 5.1 - 5.4 64 Bit Multi-Core
min: 3631 avg: 4642 median: 4749 (9%) max: 5499 Points
CPU TDP ? TDP 15 W TDP 25 W TDP 35 W TDP 40 W TDP 42 W TDP 45 W 77% 100% 66% 98% 86% 82% 93%
min: 8491 avg: 8812 median: 8956 (16%) max: 8994 Points
CPU TDP ? TDP 9 W TDP 15 W TDP 19 W TDP 20 W TDP 25 W TDP 35 W TDP 40 W TDP 42 W TDP 45 W 71% 100% 61% 100% 100% 40% 60% 53% 50% 57%
min: 4927 avg: 5375 median: 5308 (10%) max: 5955 Points
CPU TDP ? TDP 9 W TDP 15 W TDP 19 W TDP 20 W TDP 25 W TDP 35 W TDP 40 W TDP 42 W TDP 45 W 71% 100% 61% 100% 100% 40% 60% 53% 50% 57%
Geekbench 5.0 - Geekbench 5.0 64 Bit Single-Core
min: 1453 avg: 1488 median: 1493.5 (6%) max: 1510 Points
Geekbench 5.0 - Geekbench 5.0 64 Bit Multi-Core
min: 4864 avg: 5318 median: 5259 (17%) max: 5890 Points
Geekbench 4.4 - Geekbench 4.1 - 4.4 64 Bit Single-Core
6019 Points (60%)
6238 Points (62%)
CPU TDP 35 W TDP 40 W 100% 96%
Geekbench 4.4 - Geekbench 4.1 - 4.4 64 Bit Multi-Core
18976 Points (21%)
22045 Points (24%)
CPU TDP 35 W TDP 40 W 100% 86%
Mozilla Kraken 1.1 - Kraken 1.1 Total Score *
min: 687 avg: 698 median: 697 (1%) max: 737 ms
CPU TDP ? TDP 15 W TDP 25 W TDP 35 W TDP 40 W TDP 42 W TDP 45 W 100% 100% 100% 100% 100% 100% 100%
min: 440 avg: 450.1 median: 449.2 (1%) max: 466.8 ms
CPU TDP ? TDP 9 W TDP 15 W TDP 19 W TDP 20 W TDP 25 W TDP 35 W TDP 40 W TDP 42 W TDP 45 W 100% 100% 100% 100% 100% 100% 100% 100% 100% 100%
min: 662 avg: 669 median: 666.5 (1%) max: 680 ms
CPU TDP ? TDP 9 W TDP 15 W TDP 19 W TDP 20 W TDP 25 W TDP 35 W TDP 40 W TDP 42 W TDP 45 W 100% 100% 100% 100% 100% 100% 100% 100% 100% 100%
Sunspider - Sunspider 1.0 Total Score *
163.2 ms (2%)
Octane V2 - Octane V2 Total Score
min: 60242 avg: 62203 median: 62911 (55%) max: 63457 Points
CPU TDP 25 W TDP 35 W TDP 42 W 95% 99% 100%
min: 72484 avg: 75019 median: 74878 (66%) max: 78736 Points
CPU TDP ? TDP 9 W TDP 19 W TDP 20 W TDP 25 W TDP 35 W TDP 42 W 100% 97% 100% 99% 79% 83% 84%
67714 Points (59%)
CPU TDP ? TDP 9 W TDP 19 W TDP 20 W TDP 25 W TDP 35 W TDP 42 W 100% 97% 100% 99% 79% 86% 84%
WebXPRT 4 - WebXPRT 4 Score
min: 223 avg: 237.8 median: 235 (68%) max: 256 Points
CPU TDP ? TDP 9 W TDP 19 W 92% 92% 100%
min: 202 avg: 204.7 median: 206 (59%) max: 206 Points
CPU TDP ? TDP 9 W TDP 19 W TDP 35 W 92% 92% 100% 80%
WebXPRT 3 - WebXPRT 3 Score
min: 227 avg: 236.5 median: 238 (50%) max: 241 Points
CPU TDP ? TDP 15 W TDP 25 W TDP 35 W TDP 40 W TDP 42 W TDP 45 W 98% 100% 96% 97% 99% 100% 94%
min: 342 avg: 366.5 median: 376 (78%) max: 387 Points
CPU TDP ? TDP 9 W TDP 15 W TDP 19 W TDP 20 W TDP 25 W TDP 35 W TDP 40 W TDP 42 W TDP 45 W 75% 98% 62% 100% 98% 60% 60% 62% 62% 59%
min: 243 avg: 258.3 median: 260.5 (54%) max: 269 Points
CPU TDP ? TDP 9 W TDP 15 W TDP 19 W TDP 20 W TDP 25 W TDP 35 W TDP 40 W TDP 42 W TDP 45 W 75% 98% 62% 100% 98% 60% 65% 62% 62% 59%
Antutu v9 - AnTuTu v9 Total Score
min: 1257990 avg: 1337360 median: 1337360 (81%) max: 1416730 Points
Antutu v9 - AnTuTu v9 CPU
min: 294643 avg: 298254 median: 298254 (82%) max: 301865 Points
CrossMark - CrossMark Overall
min: 1163 avg: 1258 median: 1257.5 (48%) max: 1352 Points
CPU TDP 35 W TDP 42 W 100% 86%
min: 1437 avg: 1515 median: 1507 (58%) max: 1585 Points
CPU TDP ? TDP 9 W TDP 19 W TDP 20 W TDP 35 W TDP 42 W 99% 98% 100% 98% 88% 76%
min: 1300 avg: 1331 median: 1326 (51%) max: 1371 Points
CPU TDP ? TDP 9 W TDP 19 W TDP 20 W TDP 35 W TDP 42 W 99% 98% 100% 98% 87% 76%
Power Consumption - Prime95 Power Consumption - external Monitor *
min: 26.4 avg: 57.8 median: 56.6 (10%) max: 79.2 Watt
CPU TDP 15 W TDP 25 W TDP 35 W TDP 40 W TDP 42 W TDP 45 W 107% 111% 105% 103% 100% 102%
min: 52.5 avg: 54.2 median: 52.8 (9%) max: 58.6 Watt
CPU TDP 15 W TDP 25 W TDP 35 W TDP 40 W TDP 42 W TDP 45 W 107% 111% 105% 103% 100% 102%
Power Consumption - Cinebench R15 Multi Power Consumption - external Monitor *
min: 31.5 avg: 57.8 median: 60.3 (11%) max: 66.2 Watt
CPU TDP 15 W TDP 25 W TDP 35 W TDP 40 W TDP 42 W TDP 45 W 102% 107% 101% 100% 100% 102%
29 Watt (5%)
CPU TDP 15 W TDP 20 W TDP 25 W TDP 35 W TDP 40 W TDP 42 W TDP 45 W 102% 108% 107% 101% 100% 100% 102%
min: 47.3 avg: 53.5 median: 51 (9%) max: 64.5 Watt
CPU TDP 15 W TDP 20 W TDP 25 W TDP 35 W TDP 40 W TDP 42 W TDP 45 W 102% 108% 107% 102% 100% 100% 102%
Power Consumption - Geekbench 5.5 Power Consumption 150cd *
min: 6.86 avg: 8.3 median: 8.4 (4%) max: 9.71 Watt
Power Consumption - Idle Power Consumption - external Monitor *
min: 2.03 avg: 2.6 median: 2.4 (2%) max: 3.98 Watt
CPU TDP 9 W TDP 19 W TDP 20 W 100% 100% 100%
min: 8.12 avg: 8.1 median: 8.1 (5%) max: 8.16 Watt
CPU TDP 9 W TDP 19 W TDP 20 W TDP 35 W 104% 104% 104% 100%
Power Consumption - Idle Power Consumption 150cd 1min *
min: 6.29 avg: 7.2 median: 7 (8%) max: 8.44 Watt
CPU TDP 15 W TDP 25 W TDP 40 W TDP 45 W 103% 102% 102% 100%
min: 1.631 avg: 3.5 median: 3.6 (4%) max: 5.32 Watt
CPU TDP ? TDP 9 W TDP 15 W TDP 25 W TDP 40 W TDP 45 W 107% 104% 103% 102% 102% 100%
6.4 Watt (7%)
CPU TDP ? TDP 9 W TDP 15 W TDP 25 W TDP 35 W TDP 40 W TDP 45 W 107% 104% 103% 102% 103% 102% 100%
Power Consumption - Cinebench R15 Multi Power Efficiency - external Monitor
min: 14.3 avg: 16.6 median: 15.2 (11%) max: 24.7 Points per Watt
CPU TDP 15 W TDP 25 W TDP 35 W TDP 40 W TDP 42 W TDP 45 W 58% 100% 65% 61% 59% 67%
42.4 Points per Watt (32%)
CPU TDP 15 W TDP 20 W TDP 25 W TDP 35 W TDP 40 W TDP 42 W TDP 45 W 34% 100% 58% 38% 35% 34% 39%
min: 15.8 avg: 17.4 median: 17.3 (13%) max: 19.2 Points per Watt
CPU TDP 15 W TDP 20 W TDP 25 W TDP 35 W TDP 40 W TDP 42 W TDP 45 W 34% 100% 58% 40% 35% 34% 39%
Average Benchmarks Intel Core i5-11300H → 100% n=13 Average Benchmarks Apple M2 → 124% n=13 Average Benchmarks Intel Core i5-11320H → 105% n=13
- Range of benchmark values for this graphics card
- Average benchmark values for this graphics card
* Smaller numbers mean a higher performance
1 This benchmark is not used for the average calculation
v1.28
log 04. 00:55:48
#0 checking url part for id 13058 +0s ... 0s
#1 checking url part for id 14521 +0s ... 0s
#2 checking url part for id 13169 +0s ... 0s
#3 redirected to Ajax server, took 1720047348 +0s ... 0s
#4 did not recreate cache, as it is less than 5 days old! Created at Mon, 01 Jul 2024 05:15:43 +0200 +0s ... 0s
#5 composed specs +0.007s ... 0.007s
#6 did output specs +0s ... 0.007s
#7 getting avg benchmarks for device 13058 +0.004s ... 0.011s
#8 got single benchmarks 13058 +0.014s ... 0.025s
#9 getting avg benchmarks for device 14521 +0.001s ... 0.026s
#10 got single benchmarks 14521 +0.008s ... 0.034s
#11 getting avg benchmarks for device 13169 +0.003s ... 0.037s
#12 got single benchmarks 13169 +0.008s ... 0.045s
#13 got avg benchmarks for devices +0s ... 0.045s
#14 min, max, avg, median took s +0.064s ... 0.109s
#15 return log +0s ... 0.109s
Please share our article, every link counts!
Redaktion, 2017-09- 8 (Update: 2023-07- 1)
 Deutsch
 English
 Español
 Français
 Italiano
 Nederlands
 Polski
 Português
 Русский
 Türkçe
 Svenska
 Chinese
 Magyar