 Deutsch
 English
 Español
 Français
 Italiano
 Nederlands
 Polski
 Português
 Русский
 Türkçe
 Svenska
 Chinese
 Magyar
Intel Core i5-10310Y vs Apple M1 vs Intel Core i3-10100Y
Intel Core i5-10310Y
► remove from comparisonThe Intel Core i5-10310Y is a extremely power efficient quad-core SoC for small laptops and tablets based on the Comet Lake (CML-Y) generation and was announced in August 2019. Compared to the similar Amber Lake processors (e.g. Core i7-8500Y), the only difference are two additional cores in the top models (except i3-10110Y). The processor cores are clocked between 1.1 and 4.1 GHz (all 4 cores 2.8 GHz max). Thanks to HyperThreading 8 threads can be used. Compared to the faster i7-10510Y, the level 3 cache is reduced to 6 MB and the clock rates are lower.
More information on Comet Lake and all the models and articles on it can be found here.
Performance
While we have not tested a single system built around the 10310Y as of August 2023, it's realistic to expect the chip to be about half as fast as the Core i5-10210U (Comet Lake, 4 cores, 8 threads, up to 4.2 GHz) in multi-thread workloads. Those 4 cores of the 10310Y are set to be very much constrained by the low TDP target leading to high DPC latencies and generally unresponsive system behaviour no matter the activity.
The integrated graphics adapter is still the same as in the previous generations. It should be still called Intel UHD Graphics 615 and clock from 300 - 1050 MHz in the i5. Furthermore, the SoC integrates a VP9 and H.265 de- and encoder.
The chip is now produced in the 14nm++ process (Amber Lake Y was 14nm+) but not 10nm like Ice Lake Y. The TDP is specified at 7 Watts but can be varied from 5.5 to 9 Watt from the manufacturer (cTDP up/down) resulting in different performance (especially Turbo durations).
Apple M1
► remove from comparison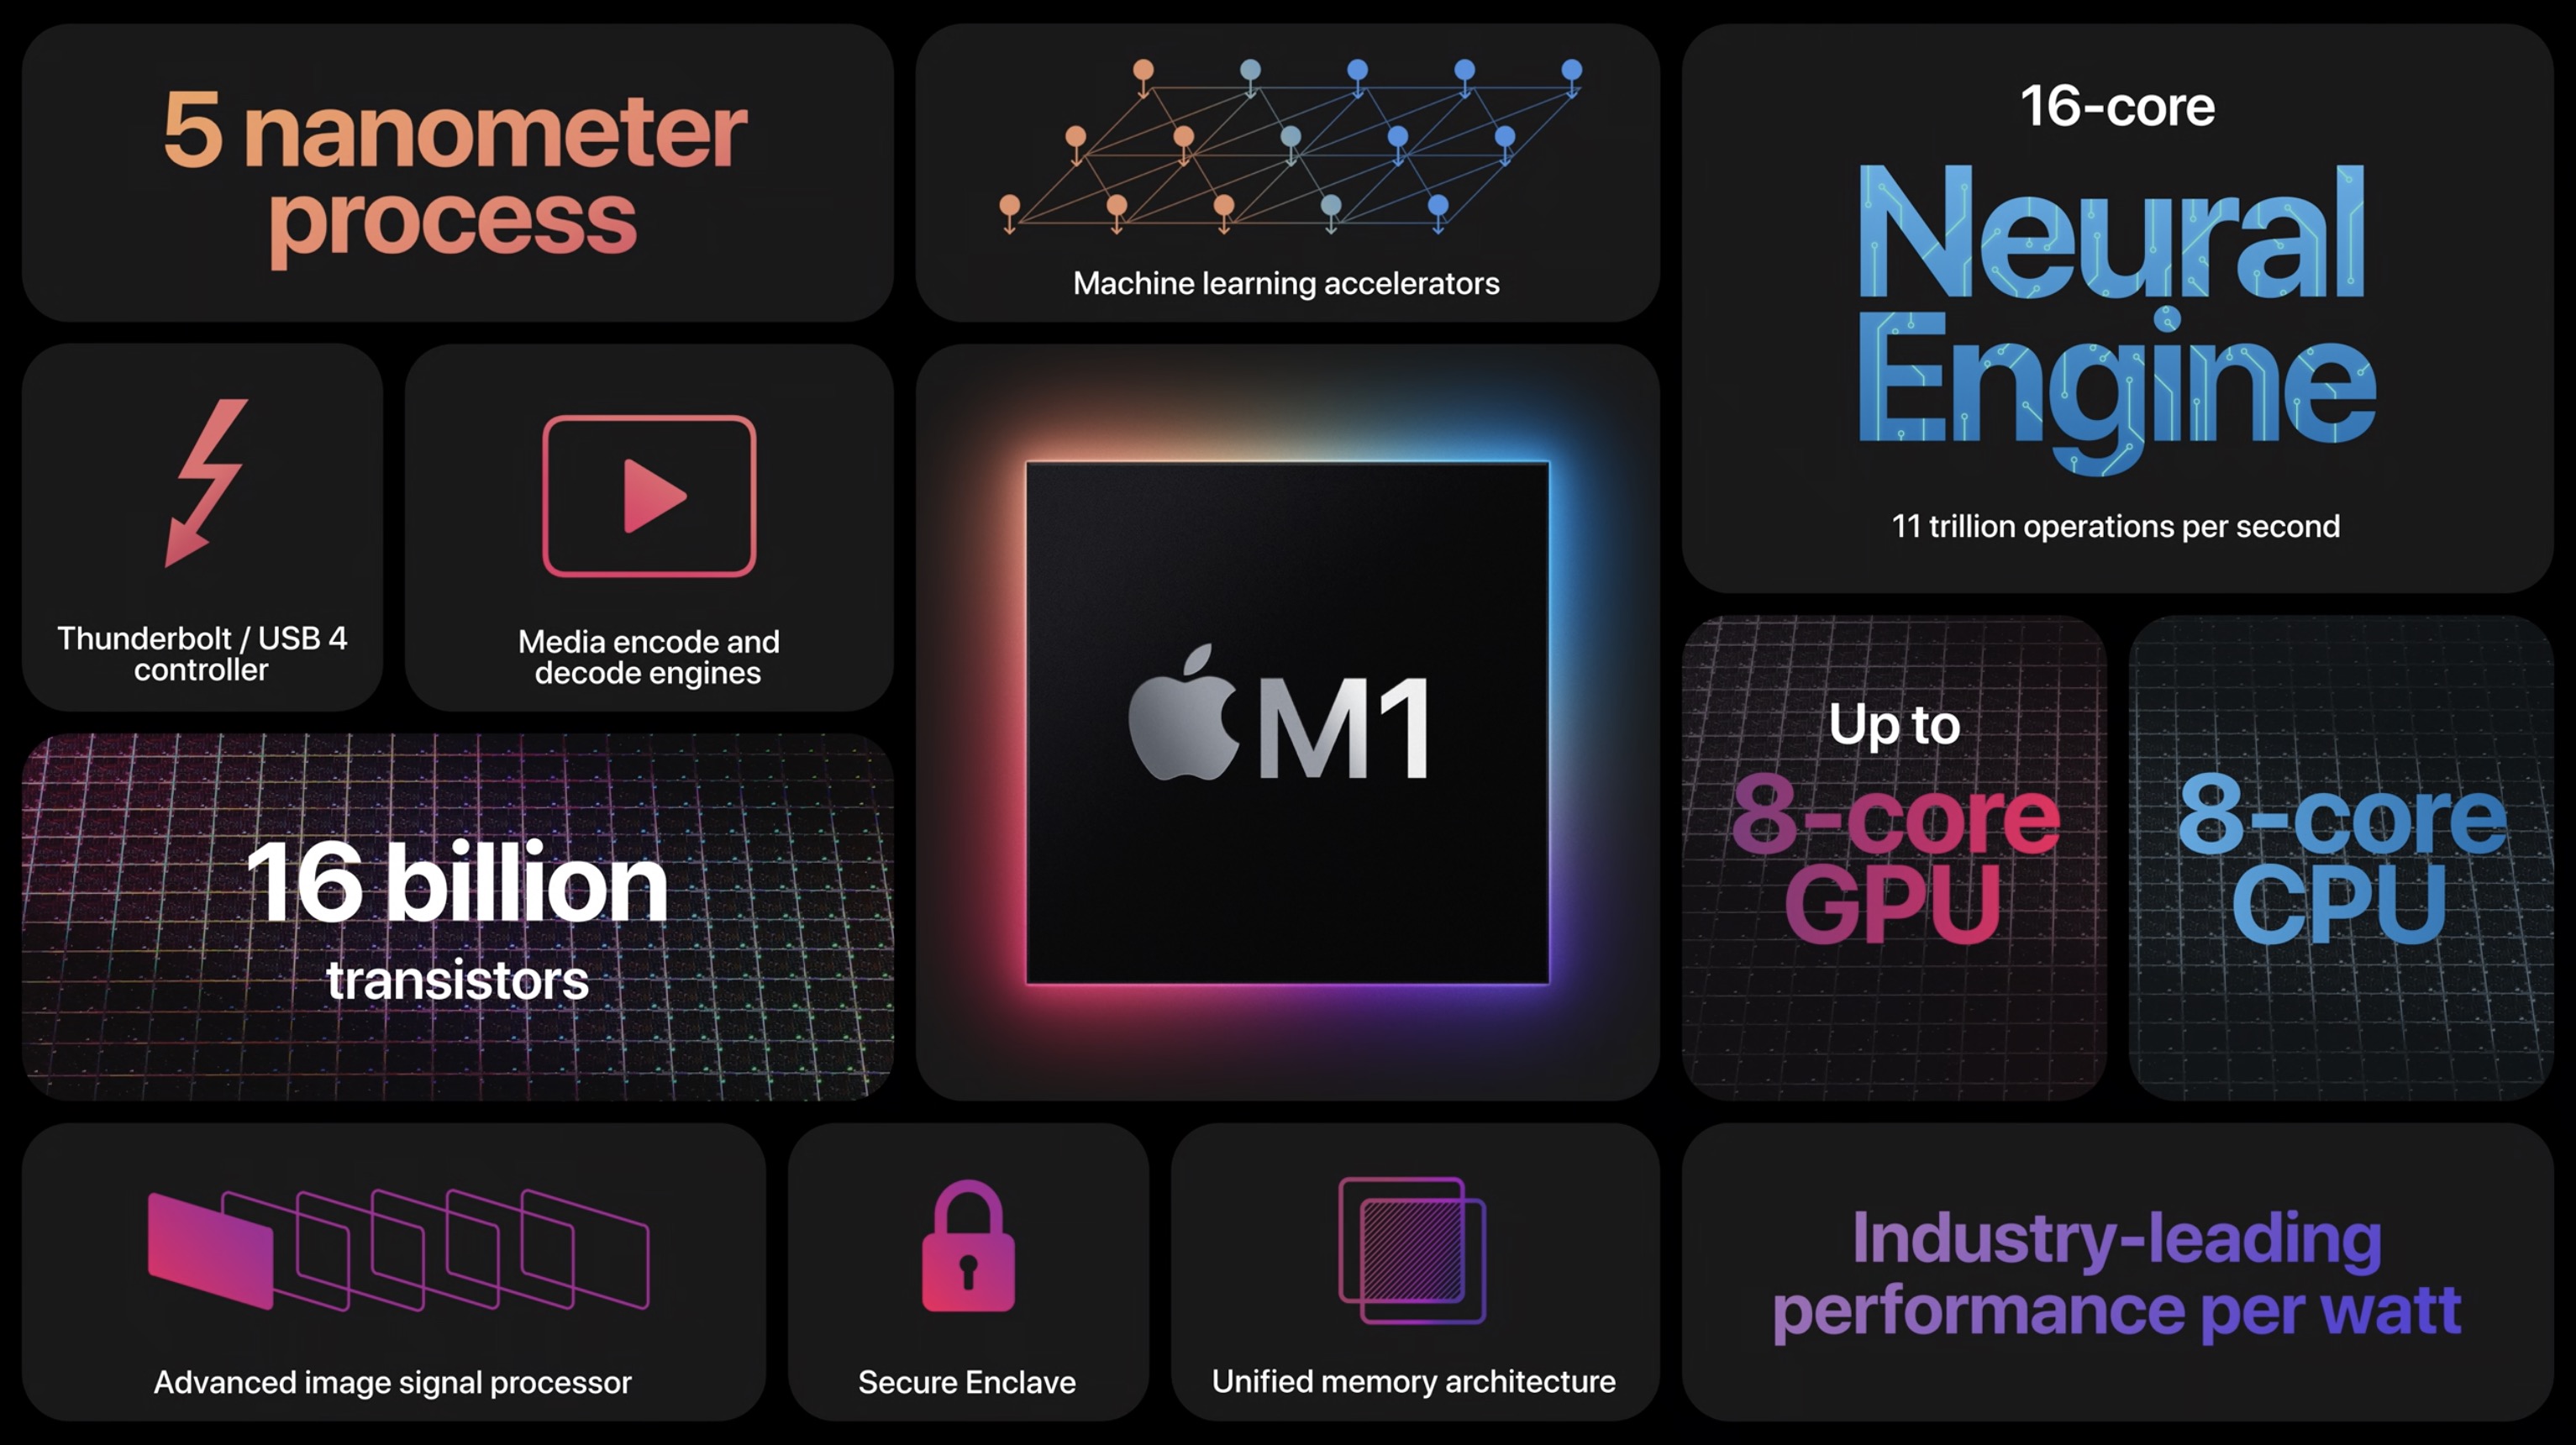
The Apple M1 is a System on a Chip (SoC) from Apple that is found in the late 2020 MacBook Air, MacBook Pro 13, and Mac Mini. It offers 8 cores divided in four performance cores and four power-efficiency cores. The big cores offer 192 KB instruction cache, 128 KB data cache, and 12 MB shared L2 cache. According to Apple the performance of these cores should be better than anything on the market (in late 2020). The four efficiency cores are a lot smaller and offer only 128 KB instruction cache, 64 KB data cache, and 4 MB shared cache. The efficiency cores (E cluster) clock with 600 - 2064 MHz, the performance cores (P cluster) with 600 - 3204 MHz.
The M1 is available in two TDP variants, a passive cooled 10 Watt variant for the MacBook Air and an active cooled faster variant for the MacBook Pro 13 and Mac Mini. Those should offer a better-sustained performance according to Apple.
The integrated graphics card in the M1 offers 8 cores (7 cores in the entry MacBook Air) and a peak performance of 2.6 teraflops. Apple claims that it is faster than any other iGPU at the time of announcement.
Furthermore, the SoC integrates a fast 16 core neural engine with a peak performance of 11 TOPS (for AI hardware acceleration), a secure enclave (e.g., for encryption), a unified memory architecture, Thunderbolt / USB 4 controller, an ISP, and media de- and encoders.
The Apple M1 includes 16 billion transistors (up from the 10 billion of the A12Z Bionic and therefore double the amount of a Tiger Lake-U chip like the i7-1185G7) and is manufactured in 5nm at TSMC.
Intel Core i3-10100Y
► remove from comparisonThe Intel Core i3-10100Y is a efficient dual-core SoC for tablets and passively cooled laptops based on the old Amber Lake generation from 2018. It was announced in Q1 2021 and is similar to the old Core i5-8200Y. The only difference is a slightly higher GPU clock (+50 MHz).
The CPU consists of two processor cores clocked at 1.3 - 3.9 GHz. Thanks to Hyper Threading, the processor can execute up to four threads simultaneously. The chips also includes the Intel HD Graphics 615 GPU, a dual-channel memory controller (DDR3L/LPDDR3) as well as VP9 and H.265 video de- and encoder.
Architecture
Intel basically used the familiar micro architecture from the Skylake / Kaby Lake generation, so the per-MHz performance is identical.
Performance
The average 10100Y in our database is just a little ahead of the AMD 3050e, as far as multi-thread benchmark scores are concerned, the latter being an entry-level, dual-core processor of the same energy efficiency based on the Zen architecture. This makes the Core i3 an OK option for basic day-to-day activities, as of mid 2022.
Your mileage may vary depending on how high the CPU power limits are.
Graphics
The integrated Intel UHD Graphics 615 iGPU has 24 Execution Units (EUs) not unlike the older HD Graphics 515 and runs at up to 1,000 MHz. The performance heavily depends on the TDP limit as well as the memory configuration; with fast LPDDR3-1866 RAM in dual-channel mode, the GPU should sometimes be able to compete with the HD Graphics 520, but can also be much slower in other scenarios. Modern games from 2016 will, if at all, only run smoothly in the lowest settings.
Contrary to Skylake, Kaby Lake and Amber Lake now also supports hardware decoding for H.265/HEVC Main10 with a 10-bit color depth as well as Google's VP9 codec.
Power consumption
This little Core i3 here has a default TDP, also known as the long-term power limit, of 5 W that laptop makers are free to change to anything between 3.5 W and 7 W with clock speeds and performance changing accordingly as a result. Either way, the values are low and thus good enough for passively cooled tablets, laptops, mini-PCs and handhelds.
The i3-10100Y is built with one of the old 14 nm Intel manufacturing processes for low, as of early 2023, energy efficiency.
| Model | Intel Core i5-10310Y | Apple M1 | Intel Core i3-10100Y | ||||||||||||||||||||||||||||||||||||||||||||||||||||||||||||||||||||||||||||||||||||||||
| Series | Intel Amber Lake | Apple Apple M-Series | Intel Amber Lake | ||||||||||||||||||||||||||||||||||||||||||||||||||||||||||||||||||||||||||||||||||||||||
| Codename | Amber Lake-Y | Amber Lake-Y | |||||||||||||||||||||||||||||||||||||||||||||||||||||||||||||||||||||||||||||||||||||||||
| Series: Amber Lake Amber Lake-Y |
|
|
| ||||||||||||||||||||||||||||||||||||||||||||||||||||||||||||||||||||||||||||||||||||||||
| Clock | 1100 - 4100 MHz | 2064 - 3220 MHz | 1300 - 3900 MHz | ||||||||||||||||||||||||||||||||||||||||||||||||||||||||||||||||||||||||||||||||||||||||
| L1 Cache | 128 KB | 2 MB | 128 KB | ||||||||||||||||||||||||||||||||||||||||||||||||||||||||||||||||||||||||||||||||||||||||
| L2 Cache | 512 KB | 16 MB | 512 KB | ||||||||||||||||||||||||||||||||||||||||||||||||||||||||||||||||||||||||||||||||||||||||
| L3 Cache | 6 MB | 8 MB | 4 MB | ||||||||||||||||||||||||||||||||||||||||||||||||||||||||||||||||||||||||||||||||||||||||
| Cores / Threads | 4 / 8 | 8 / 8 | 2 / 4 | ||||||||||||||||||||||||||||||||||||||||||||||||||||||||||||||||||||||||||||||||||||||||
| TDP | 7 Watt | 5 Watt | |||||||||||||||||||||||||||||||||||||||||||||||||||||||||||||||||||||||||||||||||||||||||
| Technology | 14 nm | 5 nm | 14 nm | ||||||||||||||||||||||||||||||||||||||||||||||||||||||||||||||||||||||||||||||||||||||||
| max. Temp. | 100 °C | 100 °C | |||||||||||||||||||||||||||||||||||||||||||||||||||||||||||||||||||||||||||||||||||||||||
| Socket | BGA1377 | BGA1377 | |||||||||||||||||||||||||||||||||||||||||||||||||||||||||||||||||||||||||||||||||||||||||
| Features | DDR3L-1600/LPDDR3-2133 RAM, PCIe 3, 4 GT/s bus, vPro, MMX, SSE, SSE2, SSE3, SSSE3, SSE4.1, SSE4.2, AVX, AVX2, BMI2, ABM, FMA, ADX, VMX, SMEP, SMAP, MPX, EIST, TM1, TM2, Hyper-Threading, Turbo, SST, AES-NI, RDRAND, RDSEED, SGX | ARMv8 Instruction Set | DDR3L-1600/LPDDR3-1866 RAM, PCIe 3, 4 GT/s bus, MMX, SSE, SSE2, SSE3, SSSE3, SSE4.1, SSE4.2, AVX, AVX2, BMI2, ABM, FMA, ADX, VMX, SMEP, SMAP, MPX, EIST, TM1, TM2, HT, Turbo, SST, AES-NI, RDRAND, RDSEED, SGX | ||||||||||||||||||||||||||||||||||||||||||||||||||||||||||||||||||||||||||||||||||||||||
| iGPU | Intel UHD Graphics 615 (300 - 1050 MHz) | Apple M1 8-Core GPU | Intel UHD Graphics 615 (300 - 1000 MHz) | ||||||||||||||||||||||||||||||||||||||||||||||||||||||||||||||||||||||||||||||||||||||||
| Architecture | x86 | ARM | x86 | ||||||||||||||||||||||||||||||||||||||||||||||||||||||||||||||||||||||||||||||||||||||||
| Announced | |||||||||||||||||||||||||||||||||||||||||||||||||||||||||||||||||||||||||||||||||||||||||||
| Manufacturer | ark.intel.com | ark.intel.com | |||||||||||||||||||||||||||||||||||||||||||||||||||||||||||||||||||||||||||||||||||||||||
| Transistors | 16000 Million |

