 Deutsch
 English
 Español
 Français
 Italiano
 Nederlands
 Polski
 Português
 Русский
 Türkçe
 Svenska
 Chinese
 Magyar
Intel Core i5-10310Y vs Apple M1 vs Apple M1 Max
Intel Core i5-10310Y
► remove from comparisonThe Intel Core i5-10310Y is a extremely power efficient quad-core SoC for small laptops and tablets based on the Comet Lake (CML-Y) generation and was announced in August 2019. Compared to the similar Amber Lake processors (e.g. Core i7-8500Y), the only difference are two additional cores in the top models (except i3-10110Y). The processor cores are clocked between 1.1 and 4.1 GHz (all 4 cores 2.8 GHz max). Thanks to HyperThreading 8 threads can be used. Compared to the faster i7-10510Y, the level 3 cache is reduced to 6 MB and the clock rates are lower.
More information on Comet Lake and all the models and articles on it can be found here.
Performance
While we have not tested a single system built around the 10310Y as of August 2023, it's realistic to expect the chip to be about half as fast as the Core i5-10210U (Comet Lake, 4 cores, 8 threads, up to 4.2 GHz) in multi-thread workloads. Those 4 cores of the 10310Y are set to be very much constrained by the low TDP target leading to high DPC latencies and generally unresponsive system behaviour no matter the activity.
The integrated graphics adapter is still the same as in the previous generations. It should be still called Intel UHD Graphics 615 and clock from 300 - 1050 MHz in the i5. Furthermore, the SoC integrates a VP9 and H.265 de- and encoder.
The chip is now produced in the 14nm++ process (Amber Lake Y was 14nm+) but not 10nm like Ice Lake Y. The TDP is specified at 7 Watts but can be varied from 5.5 to 9 Watt from the manufacturer (cTDP up/down) resulting in different performance (especially Turbo durations).
Apple M1
► remove from comparison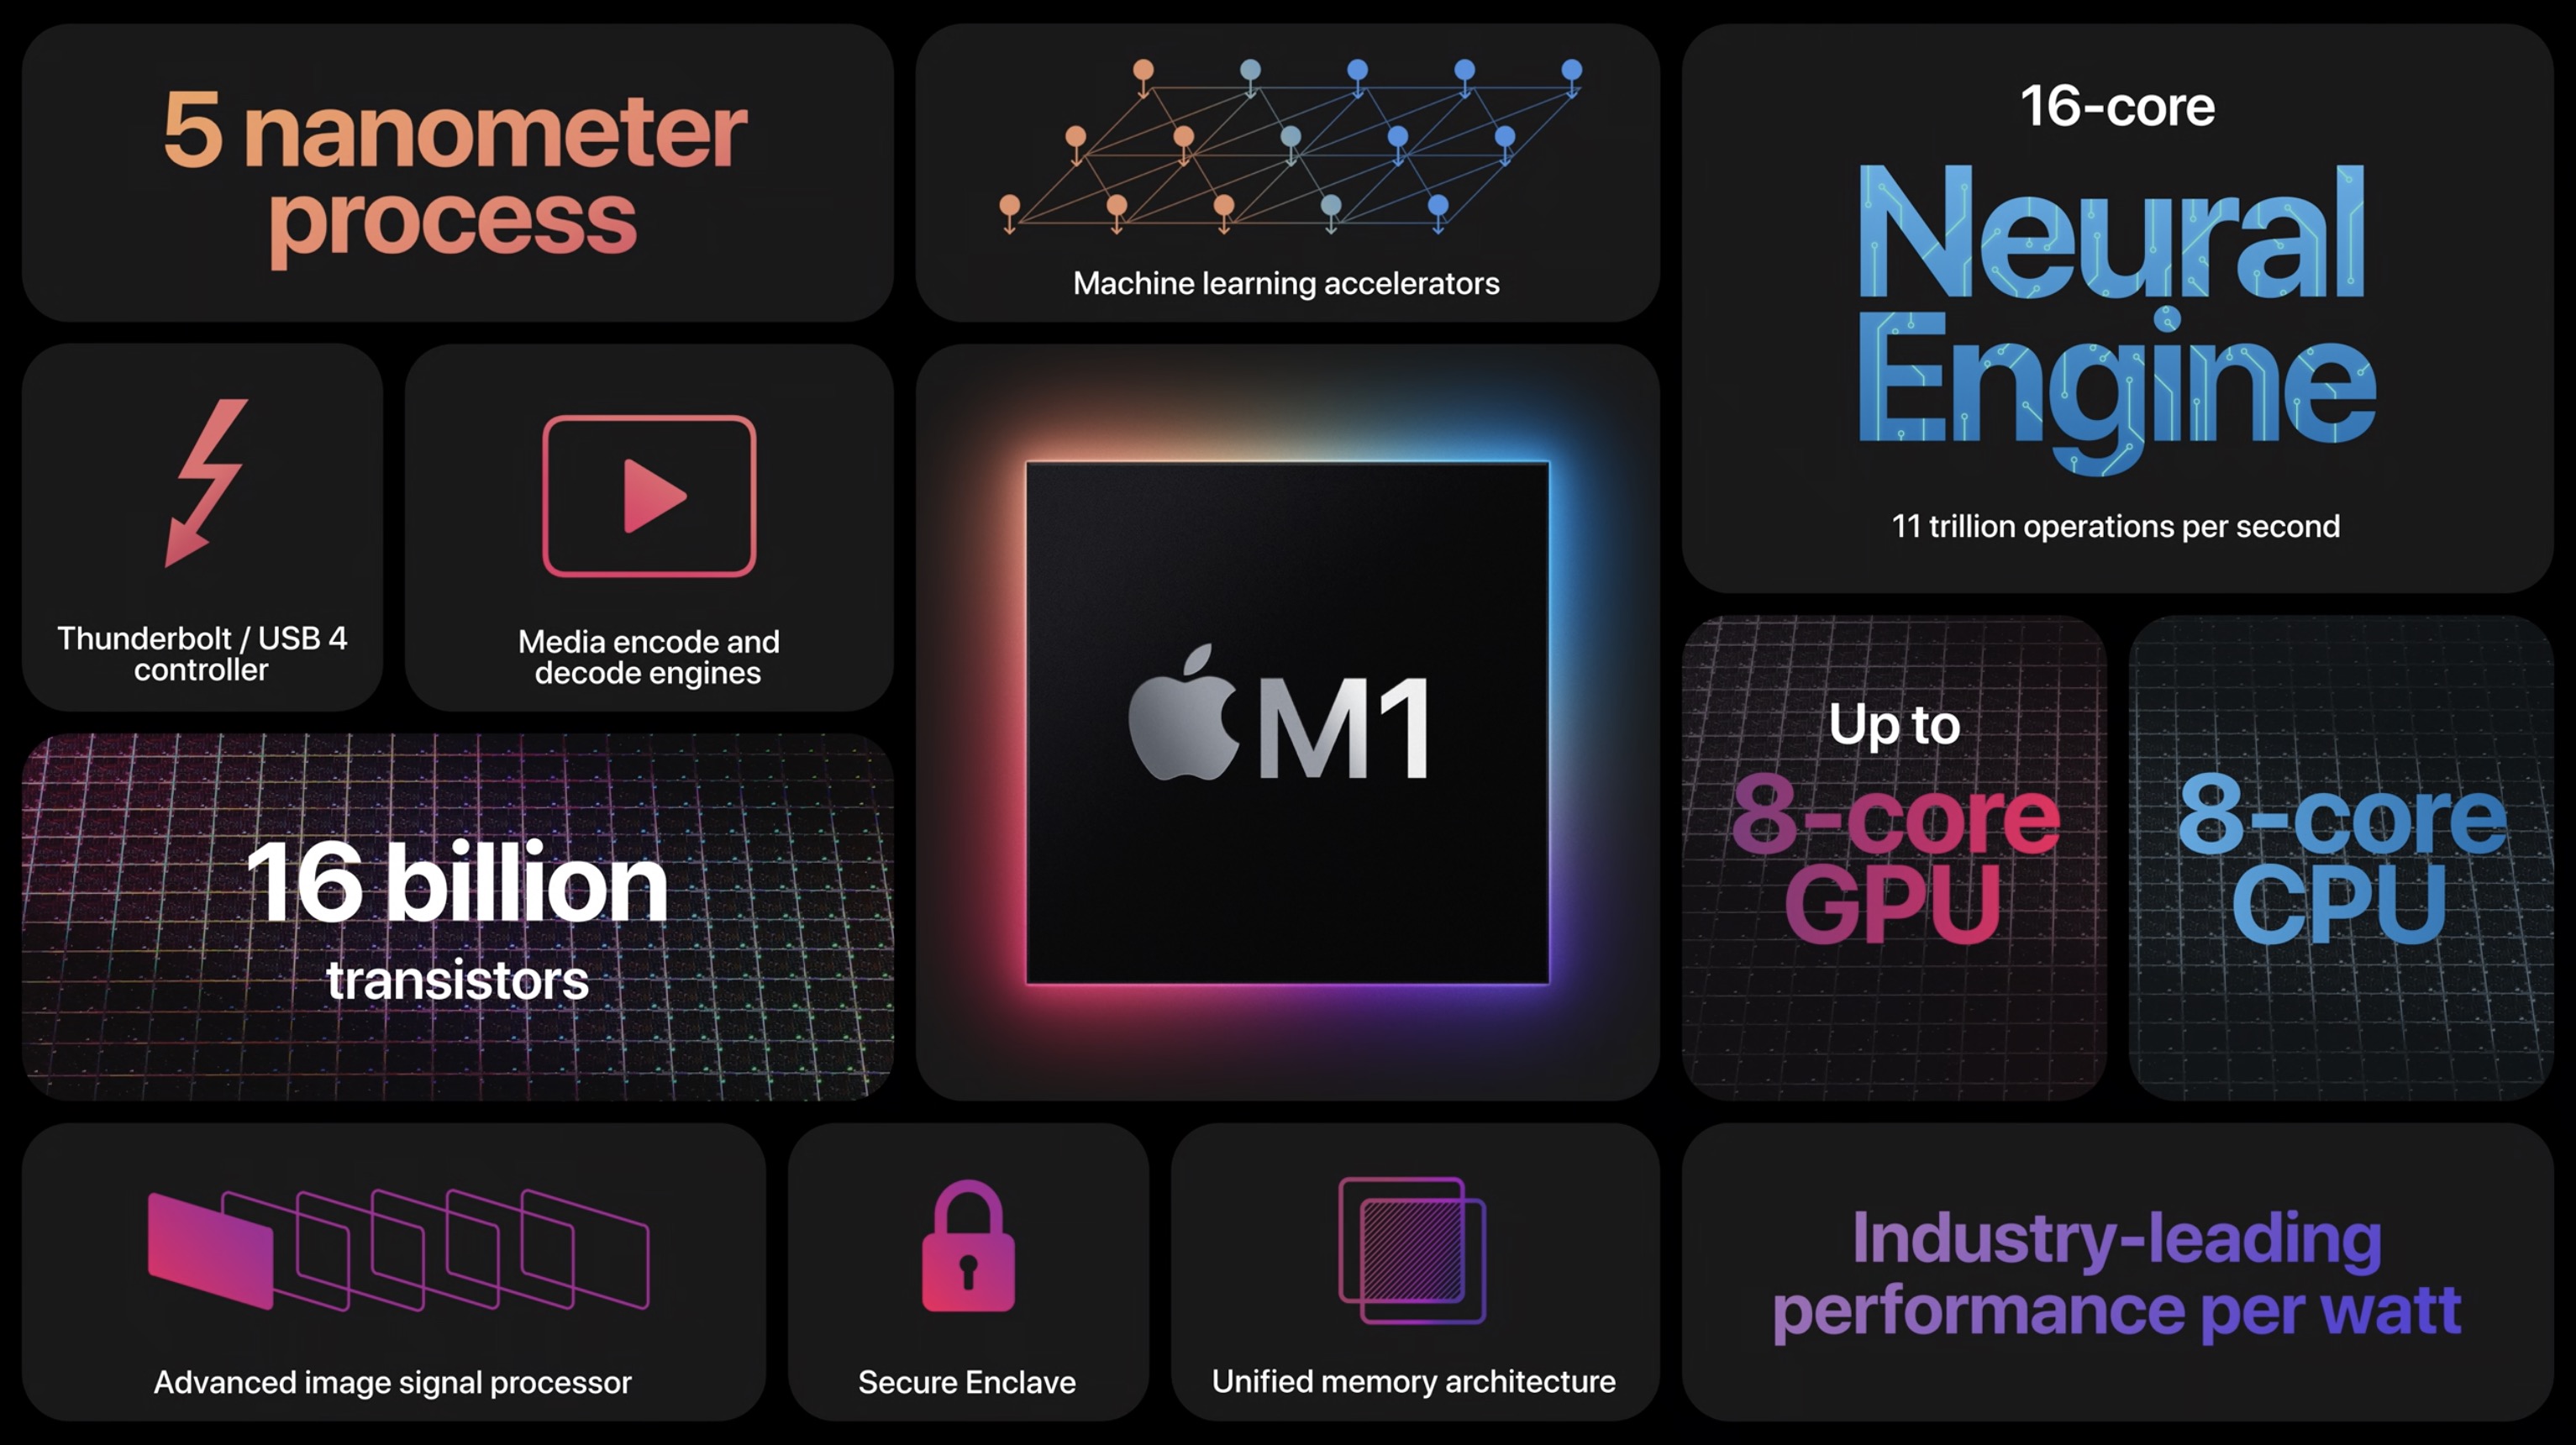
The Apple M1 is a System on a Chip (SoC) from Apple that is found in the late 2020 MacBook Air, MacBook Pro 13, and Mac Mini. It offers 8 cores divided in four performance cores and four power-efficiency cores. The big cores offer 192 KB instruction cache, 128 KB data cache, and 12 MB shared L2 cache. According to Apple the performance of these cores should be better than anything on the market (in late 2020). The four efficiency cores are a lot smaller and offer only 128 KB instruction cache, 64 KB data cache, and 4 MB shared cache. The efficiency cores (E cluster) clock with 600 - 2064 MHz, the performance cores (P cluster) with 600 - 3204 MHz.
The M1 is available in two TDP variants, a passive cooled 10 Watt variant for the MacBook Air and an active cooled faster variant for the MacBook Pro 13 and Mac Mini. Those should offer a better-sustained performance according to Apple.
The integrated graphics card in the M1 offers 8 cores (7 cores in the entry MacBook Air) and a peak performance of 2.6 teraflops. Apple claims that it is faster than any other iGPU at the time of announcement.
Furthermore, the SoC integrates a fast 16 core neural engine with a peak performance of 11 TOPS (for AI hardware acceleration), a secure enclave (e.g., for encryption), a unified memory architecture, Thunderbolt / USB 4 controller, an ISP, and media de- and encoders.
The Apple M1 includes 16 billion transistors (up from the 10 billion of the A12Z Bionic and therefore double the amount of a Tiger Lake-U chip like the i7-1185G7) and is manufactured in 5nm at TSMC.
Apple M1 Max
► remove from comparison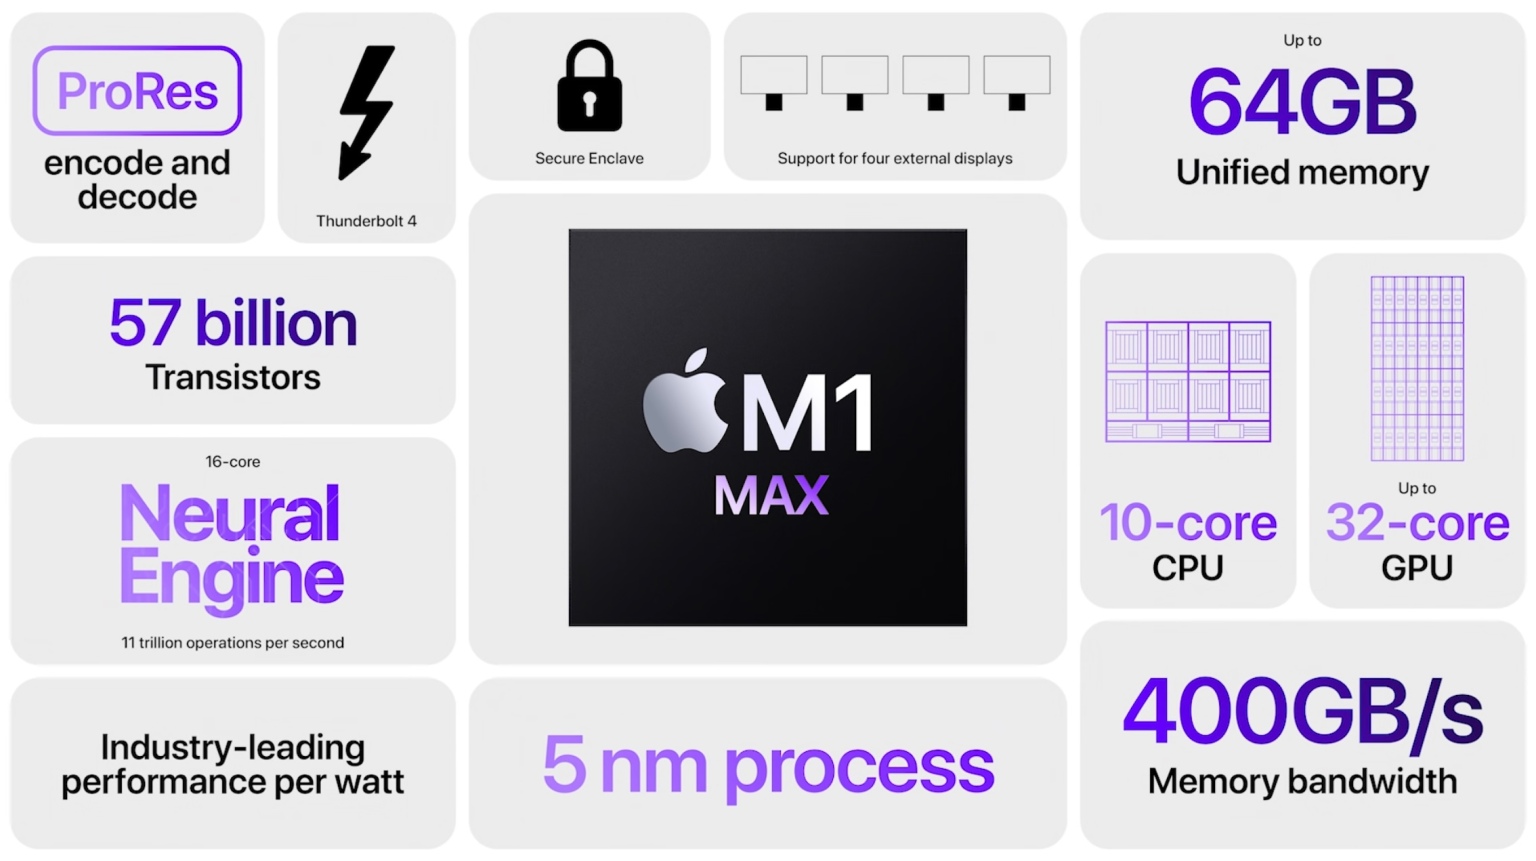
The Apple M1 Max is a System on a Chip (SoC) from Apple that is found in the late 2021 MacBook Pro 14 and 16-inch models. It offers all 10 cores available in the chip divided in eight performance cores (P-cores with 600 - 3220 MHz) and two power-efficiency cores (E-cores with 600 - 2064 MHz). There is no Turbo Boost for single cores or short burst periods. The cores are similar to the cores in the Apple M1.
The big cores (codename Firestorm) offer 192 KB instruction cache, 128 KB data cache, and 24 MB shared L2 cache (up from 12 MB in the M1). The four efficiency cores (codename Icestorm) are a lot smaller and offer only 128 KB instruction cache, 64 KB data cache, and 4 MB shared cache. CPU and GPU can both use the 48 MB SLC (System Level Cache). The efficiency cores (E cluster) clock with 600 - 2064 MHz, the performance cores (P cluster) with 600 - 3228 MHz.
The unified memory (32 or 64 GB LPDDR5-6400) next to the chip is connected by a 512 bit memory controller (200 GB/s bandwidth) and can be used by the GPU and CPU. This is the main difference to the M1 Pro and the CPU performance is quite similar.
The biggest difference to the M1 Pro is the bigger integrated GPU with 24 or 32 cores (up from 16).
Furthermore, the SoC integrates a fast 16 core neural engine, a secure enclave (e.g., for encryption), a unified memory architecture, Thunderbolt 4 controller, an ISP, and media de- and encoders (including two ProRes engines).
The M1 Pro is manufactured in 5 nm at TSMC and integrates 57 billion transistors. The peak power consumption of the chip was advertised around 30W for CPU intensive tasks.
| Model | Intel Core i5-10310Y | Apple M1 | Apple M1 Max | ||||||||||||||||||||||||||||||||||||||||||||||||||||||||||||||||||||
| Series | Intel Amber Lake | Apple Apple M-Series | Apple Apple M-Series | ||||||||||||||||||||||||||||||||||||||||||||||||||||||||||||||||||||
| Codename | Amber Lake-Y | ||||||||||||||||||||||||||||||||||||||||||||||||||||||||||||||||||||||
| Series: Apple M-Series |
|
|
| ||||||||||||||||||||||||||||||||||||||||||||||||||||||||||||||||||||
| Clock | 1100 - 4100 MHz | 2064 - 3220 MHz | 2060 - 3220 MHz | ||||||||||||||||||||||||||||||||||||||||||||||||||||||||||||||||||||
| L1 Cache | 128 KB | 2 MB | 2.9 MB | ||||||||||||||||||||||||||||||||||||||||||||||||||||||||||||||||||||
| L2 Cache | 512 KB | 16 MB | 28 MB | ||||||||||||||||||||||||||||||||||||||||||||||||||||||||||||||||||||
| L3 Cache | 6 MB | 8 MB | 48 MB | ||||||||||||||||||||||||||||||||||||||||||||||||||||||||||||||||||||
| Cores / Threads | 4 / 8 | 8 / 8 | 10 / 10 | ||||||||||||||||||||||||||||||||||||||||||||||||||||||||||||||||||||
| TDP | 7 Watt | ||||||||||||||||||||||||||||||||||||||||||||||||||||||||||||||||||||||
| Technology | 14 nm | 5 nm | 5 nm | ||||||||||||||||||||||||||||||||||||||||||||||||||||||||||||||||||||
| max. Temp. | 100 °C | ||||||||||||||||||||||||||||||||||||||||||||||||||||||||||||||||||||||
| Socket | BGA1377 | ||||||||||||||||||||||||||||||||||||||||||||||||||||||||||||||||||||||
| Features | DDR3L-1600/LPDDR3-2133 RAM, PCIe 3, 4 GT/s bus, vPro, MMX, SSE, SSE2, SSE3, SSSE3, SSE4.1, SSE4.2, AVX, AVX2, BMI2, ABM, FMA, ADX, VMX, SMEP, SMAP, MPX, EIST, TM1, TM2, Hyper-Threading, Turbo, SST, AES-NI, RDRAND, RDSEED, SGX | ARMv8 Instruction Set | ARMv8 Instruction Set | ||||||||||||||||||||||||||||||||||||||||||||||||||||||||||||||||||||
| iGPU | Intel UHD Graphics 615 (300 - 1050 MHz) | Apple M1 8-Core GPU | Apple M1 Max 32-Core GPU | ||||||||||||||||||||||||||||||||||||||||||||||||||||||||||||||||||||
| Architecture | x86 | ARM | ARM | ||||||||||||||||||||||||||||||||||||||||||||||||||||||||||||||||||||
| Announced | |||||||||||||||||||||||||||||||||||||||||||||||||||||||||||||||||||||||
| Manufacturer | ark.intel.com | ||||||||||||||||||||||||||||||||||||||||||||||||||||||||||||||||||||||
| Transistors | 16000 Million | 57000 Million |
