Notebookcheck Logo

Intel Core i3-1115G4 vs Apple M3 vs Intel Core i7-1185G7

Intel Core i3-1115G4

► remove from comparison Intel i3-1115G4

The Intel Core i3-1115G4 is a dual-core SoC for laptops and Ultrabooks based on the Tiger Lake-U generation (UP3) that was launched in September 2020. It integrates two Willow Cove processor cores (4 threads thanks to HyperThreading). Each core can clock from 3 GHz (base speed) to 4.1 GHz (single- and dual-core boost). The faster Core i5 and i7 models offer more cores and are therefore significantly faster.

Another novelty is the integrated Xe graphics card based on the completely new Gen 12 architecture. In the i3-1115G4 Intel is naming the GPU UHD Graphics and offers only 48 of the 96 EUs clocked at 400 - 1250 MHz. GPU and CPU can together use the 6 MB of L3 cache.

Furthermore, Tiger Lake SoCs add PCIe 4 support (four lanes), AI hardware acceleration, and the partial integration of Thunderbolt 4 / USB 4 and WiFi 6 in the chip.

The chip is produced on the second-gen 10 nm Intel SuperFin process that should be comparable to the 7 nm TSMC process (e.g. Ryzen 4000 series).

Performance

Multi-thread peformance is most comparable to what the Intel Core i5-8250U and the AMD Ryzen 5 3450U deliver. This makes the i3 a more than decent option for day-to-day tasks; that said, any workload of the more taxing kind (such as exporting a high-bitrate, hour long UHD video) will be enough to bring the i3 to its knees.

Thanks to its decent cooling solution and a long-term CPU power limit of 25 W, the ThinkPad L15 G2-20X4S0KU00 is one of the fastest laptops powered by the 1115G4 we know of. It can be more than 20% faster in CPU-bound workloads than the slowest system featuring the same chip in our database, as of August 2023.

Power consumption

This Core i3 series chip has a default TDP of 12 W to 28 W, the expectation being that laptop makers will go for a higher value in exchange for higher performance. Either way, that's a tad too high to allow for passively cooled laptops, tablets, mini-PCs.

The Core i3-1115G4 is built with Intel's third-gen 10 nm process marketed as SuperFin for decent, as of mid 2022, energy efficiency.

Apple M3

► remove from comparison Apple M3

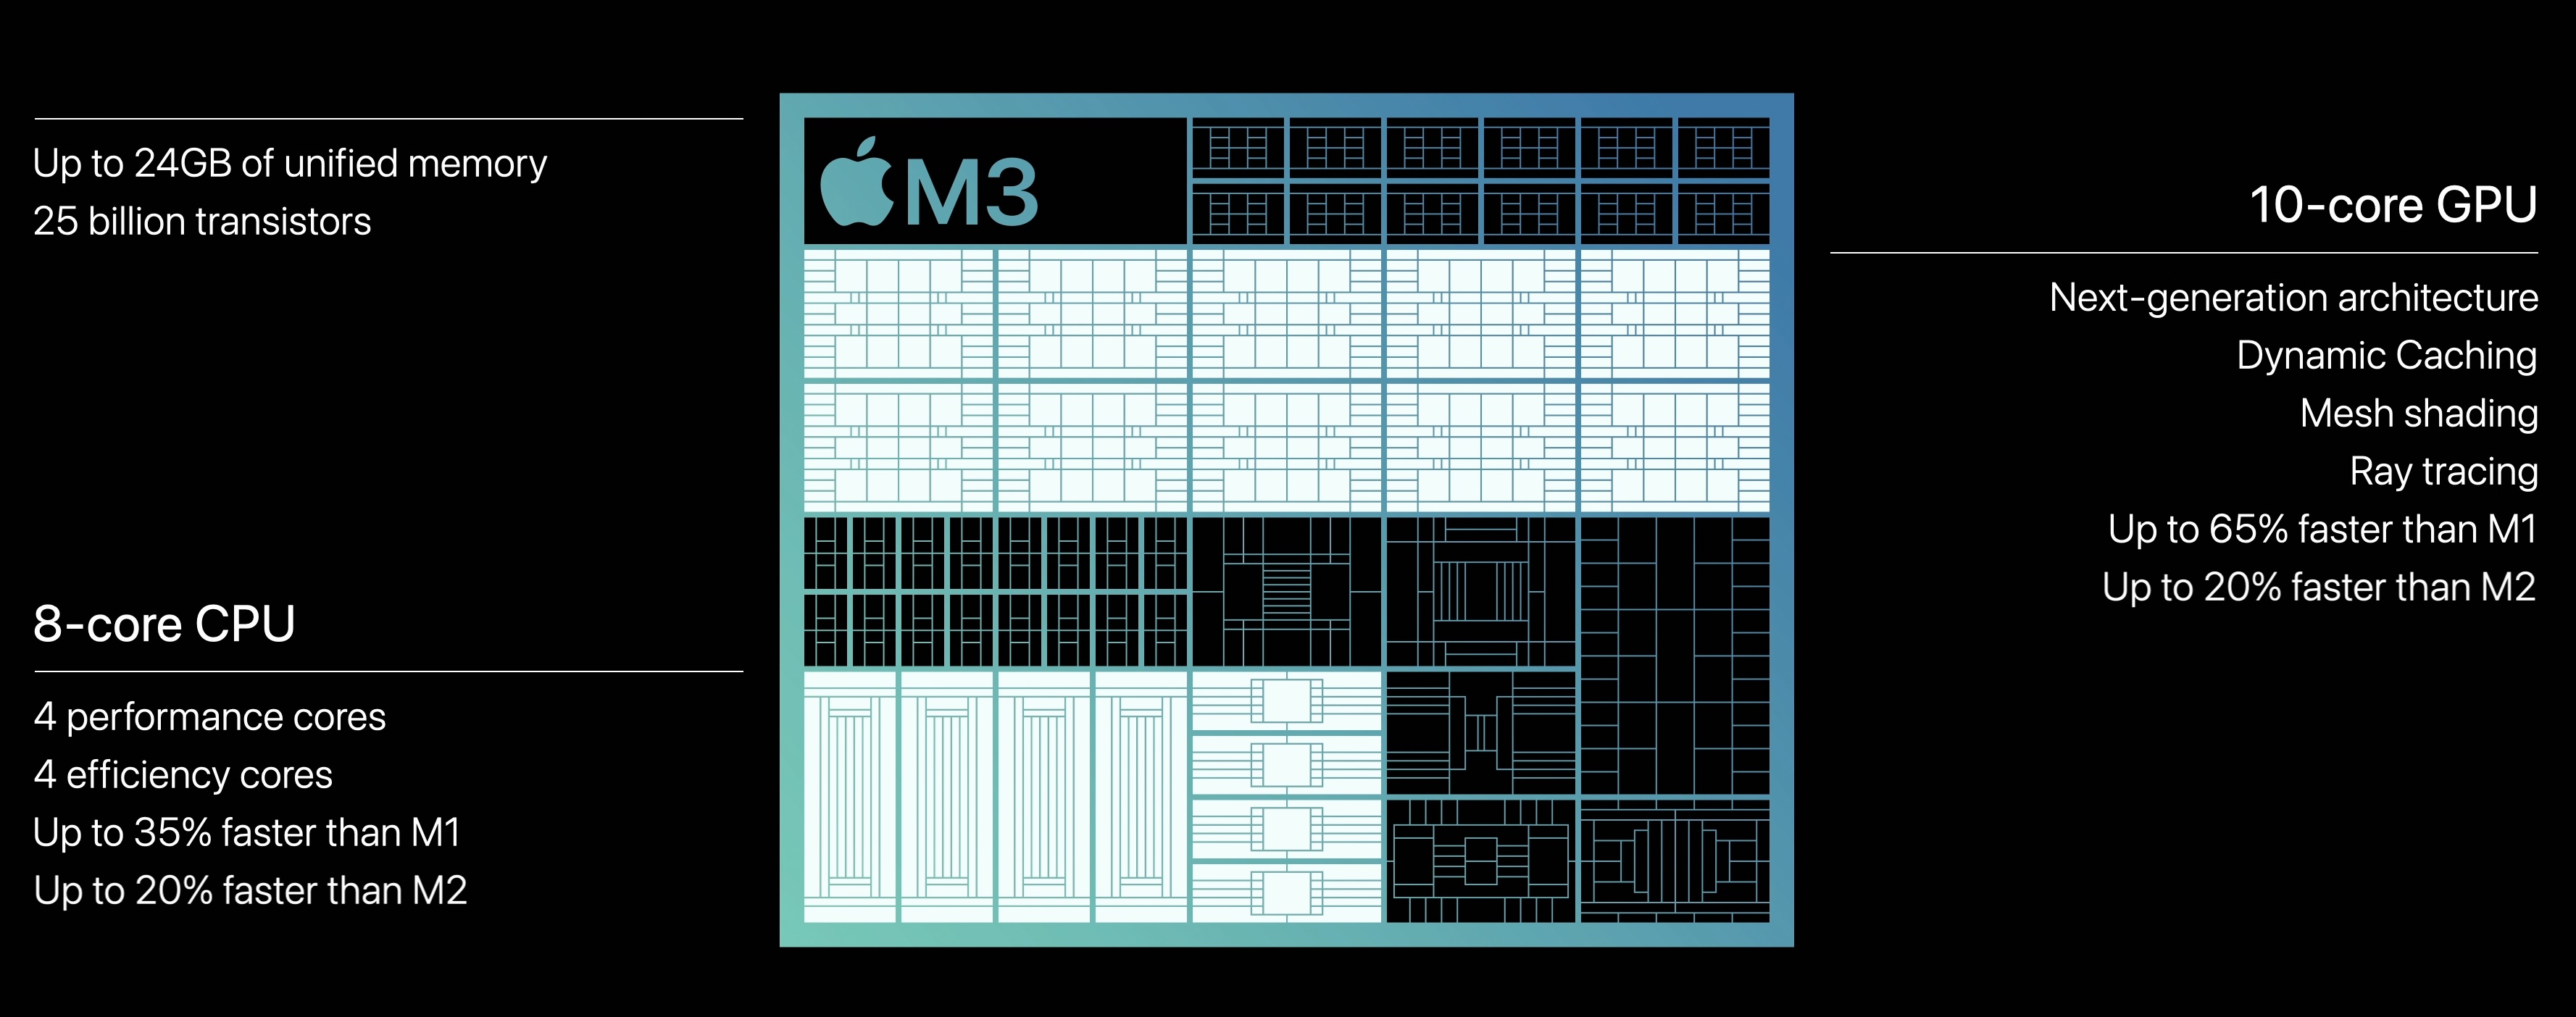
The Apple M3 is a system on a chip (SoC) from Apple for notebooks that was introduced in late 2023. It integrates a new 8-core CPU with 4 performance cores with up to 4.06 GHz and 4 efficiency cores running at up to 2.75 GHz. Apple claims that the CPU is up to 20% faster than in the old Apple M2 (3.5 GHz)

Due to the higher clock speeds and architecture improvements, the processor performance is also significantly better than the M2 in benchmarks (see e.g. Geekbench below) and can keep up with the fastest CPUs in short single-core tests (like the Raptor Lake i9-13950HX).

The M3 also integrates a new graphics adapter with dynamic caching, mesh shading and ray tracing acceleration. According to Apple, it is 20% faster than the GPU in the M2. The chip integrates again 10 GPU cores, but the cheaper variant only offers 8 cores (e.g. in the entry iMac). Furthermore, the GPU only supports 2 displays (an additional 6K60 display to the internal one).

Both GPU and CPU can access the unified memory on the package together. It is still available in 8, 16 and 24 GB variants and offers the same 100 GB/s maximum bandwidth (unlike the Pro models that feature a reduced memory bandwidth). 

The integrated 16-core Neural Engine has also been revised and now offers 18 TOPS peak performance (versus 15.8 TOPS in the M2 but 35 TOPS in the new A17 Pro). The video engine now supports AV1 decoding in hardware. H.264, HEVC and ProRes (RAW) can still be decoded and encoded.

Unfortunately, the integrated wireless network module only supports Wi-Fi 6E (no Wi-Fi 7) and due to the support of only a single external monitor, the chip also has to make do with no Thunderbolt 4 (Thunderbolt 3 / USB 4 support only for up to 40 Gbit/s).

The chip is manufactured on the current 3nm TSMC process (N3B most likely) and contains 25 billion transistors (+25% vs. Apple M2). The 3nm process should also contribute to the excellent efficiency of the chip. Under load, the M3 CPU consumes approximately 20 Watt.

Intel Core i7-1185G7

► remove from comparison Intel i7-1185G7

The Intel Core i7-1185G7 is a power-efficient quad-core SoC for laptops and Ultrabooks based on the Tiger Lake-U generation (UP3) that was introduced September 2020. It integrates four Willow Cove processor cores (8 threads thanks to Hyper-Threading). Each core can clock from 1.2 GHz (12 W base clock speed), 3 GHz (28 W base clock speed) to 4.8 GHz (single-core boost). All cores at once can clock at up to 4.3 GHz. At the time of announcement, the i7-1185G7 is the fastest model of the line-up. Since early 2021, the i7-1185G7 supports management features like vPro.

Another novelty is the integrated Iris Xe iGPU based on the completely new Gen 12 architecture. It should offer a significantly higher performance compared to the older Iris Plus G7 (Ice Lake). In the i7-1185G7 it uses 96 EUs and clocks between 400 - 1,350 MHz. The GPU and CPU can together use the 12 MB of L3 cache.

Furthermore, Tiger Lake SoCs add PCIe 4 support (four lanes), AI hardware acceleration, and the partial integration of Thunderbolt 4/USB 4 and Wi-Fi 6 in the chip.

Performance

The average 1185G7 in our database is just as fast as AMD's hexa-core Ryzen 5 4500U, as far as multi-thread benchmark scores are concerned. While the i7 is not the fastest Tiger Lake chip by any stretch of imagination, it's more than usable for your productivity and creative apps, with a bit of gaming possible as well.

Thanks to its decent cooling solution and a long-term CPU power limit of 55 W, the Stealth 15M A11SEK is among the fastest laptops powered by the 1185G7 that we know of. It can be almost twice as fast in CPU-bound workloads as the slowest system featuring the same chip in our database, as of August 2023.

Power consumption

This little Core i7 here has a default TDP of 12 W to 28 W, the expectation being that laptop manufacturers will go for a higher value in exchange for higher performance. Either way, that's a tad too high to allow for passively cooled designs.

The chip is manufactured on Intel's third-gen 10 nm process marketed as SuperFin for average, as of late 2022, energy efficiency.

ModelIntel Core i3-1115G4Apple M3Intel Core i7-1185G7
SeriesIntel Tiger LakeApple Apple M3Intel Tiger Lake
CodenameTiger Lake-UP3Tiger Lake-UP3
Series: Tiger Lake Tiger Lake-UP3
Intel Core i7-1195G72.9 - 5 GHz4 / 8 cores12 MB L3
Intel Core i7-1185G73 - 4.8 GHz4 / 8 cores12 MB L3
Intel Core i7-1165G72.8 - 4.7 GHz4 / 8 cores12 MB L3
Intel Core i5-1155G72.5 - 4.5 GHz4 / 8 cores8 MB L3
Intel Core i5-1145G72.6 - 4.4 GHz4 / 8 cores8 MB L3
Intel Core i5-1135G72.4 - 4.2 GHz4 / 8 cores8 MB L3
Intel Core i3-1125G42 - 3.7 GHz4 / 8 cores8 MB L3
Intel Core i3-1115G4 « 3 - 4.1 GHz2 / 4 cores6 MB L3
Apple M3 Max 16-Core2.75 - 4.06 GHz16 / 16 cores
Apple M3 Max 14-Core2.75 - 4.06 GHz14 / 14 cores
Apple M3 Pro 12-Core2.75 - 4.06 GHz12 / 12 cores
Apple M3 Pro 11-Core2.75 - 4.06 GHz11 / 11 cores
Apple M3 « 2.75 - 4.06 GHz8 / 8 cores
Intel Core i7-1195G72.9 - 5 GHz4 / 8 cores12 MB L3
Intel Core i7-1185G7 « 3 - 4.8 GHz4 / 8 cores12 MB L3
Intel Core i7-1165G72.8 - 4.7 GHz4 / 8 cores12 MB L3
Intel Core i5-1155G72.5 - 4.5 GHz4 / 8 cores8 MB L3
Intel Core i5-1145G72.6 - 4.4 GHz4 / 8 cores8 MB L3
Intel Core i5-1135G72.4 - 4.2 GHz4 / 8 cores8 MB L3
Intel Core i3-1125G42 - 3.7 GHz4 / 8 cores8 MB L3
Intel Core i3-1115G43 - 4.1 GHz2 / 4 cores6 MB L3
Clock3000 - 4100 MHz2748 - 4056 MHz3000 - 4800 MHz
L1 Cache160 KB320 KB
L2 Cache2.5 MB4 MB5 MB
L3 Cache6 MB12 MB
Cores / Threads2 / 48 / 8
4 x 4.1 GHz Apple M3 P-Core
4 x 2.7 GHz Apple M3 E-Core
4 / 8
TDP28 Watt28 Watt
Technology10 nm3 nm10 nm
max. Temp.100 °C100 °C
SocketBGA1449BGA1449
FeaturesDDR4-3200/LPDDR4x-3733 RAM, PCIe 4, 4 GT/s bus, DL Boost, GNA, MMX, SSE, SSE2, SSE3, SSSE3, SSE4.1, SSE4.2, AVX, AVX2, AVX-512, BMI2, ABM, FMA, ADX, VMX, SMEP, SMAP, EIST, TM1, TM2, HT, Turbo, SST, AES-NI, RDRAND, RDSEED, SHAARMv8 Instruction SetDDR4-3200/LPDDR4x-4266 RAM, PCIe 4, 4 GT/s bus, DL Boost, GNA, MMX, SSE, SSE2, SSE3, SSSE3, SSE4.1, SSE4.2, AVX, AVX2, AVX-512, BMI2, ABM, FMA, ADX, VMX, SMX, SMEP, SMAP, EIST, TM1, TM2, HT, Turbo, SST, AES-NI, RDRAND, RDSEED, SHA, TME
iGPUIntel UHD Graphics Xe G4 48EUs (400 - 1250 MHz)Apple M3 10-Core GPUIntel Iris Xe Graphics G7 96EUs (400 - 1350 MHz)
Architecturex86ARMx86
Announced
Manufacturerark.intel.comwww.apple.comark.intel.com
Transistors25000 Million

Benchmarks

Performance Rating - CB R15 + R20 + 7-Zip + X265 + Blender + 3DM11 CPU - i3-1115G4
30.5 pt (42%)
Performance Rating - CB R15 + R20 + 7-Zip + X265 + Blender + 3DM11 CPU - i7-1185G7
34.4 pt (48%)
Cinebench 2024 - Cinebench 2024 CPU Single Core
100%
1 M3 +
min: 140     avg: 141     median: 141 (98%)     max: 142 Points
Cinebench 2024 - Cinebench 2024 CPU Multi Core
100%
1 M3 +
min: 576     avg: 622     median: 599.5 (11%)     max: 712 Points
Cinebench R23 - Cinebench R23 Multi Core
min: 2725     avg: 3038     median: 3125 (3%)     max: 3244 Points
330%
M3 +
min: 10074     avg: 10275     median: 10298 (10%)     max: 10454 Points
min: 3610     avg: 5324     median: 5383.5 (5%)     max: 6383 Points
Cinebench R23 - Cinebench R23 Single Core
min: 1242     avg: 1299     median: 1312 (56%)     max: 1319 Points
145%
M3 +
min: 1900     avg: 1901     median: 1900 (81%)     max: 1904 Points
min: 1251     avg: 1449     median: 1455.5 (62%)     max: 1532 Points
Cinebench R20 - Cinebench R20 CPU (Single Core)
min: 504     avg: 507     median: 504.5 (56%)     max: 515 Points
100%
M3 +
504 Points (56%)
min: 489     avg: 557     median: 558.5 (62%)     max: 593 Points
Cinebench R20 - Cinebench R20 CPU (Multi Core)
min: 961     avg: 1120     median: 1114 (3%)     max: 1251 Points
253%
M3 +
2818 Points (7%)
min: 1425     avg: 2039     median: 2090 (5%)     max: 2493 Points
Cinebench R15 - Cinebench R15 CPU Multi 64 Bit
min: 384.7     avg: 461.6     median: 480.5 (3%)     max: 507 Points
312%
M3 +
1499 Points (9%)
min: 617     avg: 859     median: 866 (5%)     max: 1066 Points
Cinebench R15 - Cinebench R15 CPU Single 64 Bit
min: 137     avg: 179.9     median: 190 (57%)     max: 197 Points
143%
M3 +
271 Points (82%)
min: 168     avg: 215.4     median: 217 (65%)     max: 230 Points
Cinebench R11.5 - Cinebench R11.5 CPU Multi 64 Bit
min: 8.99     avg: 9.3     median: 9.3 (12%)     max: 9.67 Points
Cinebench R11.5 - Cinebench R11.5 CPU Single 64 Bit
min: 2.52     avg: 2.5     median: 2.5 (63%)     max: 2.56 Points
Cinebench R10 - Cinebench R10 Rend. Single (32bit)
8018 Points (48%)
min: 8782     avg: 8872     median: 8872 (54%)     max: 8962 Points
Cinebench R10 - Cinebench R10 Rend. Multi (32bit)
16265 Points (12%)
min: 26426     avg: 27025     median: 27024.5 (20%)     max: 27623 Points
Cinebench R10 - Cinebench R10 Rend. Multi (64bit)
min: 35564     avg: 36392     median: 36391.5 (25%)     max: 37219 Points
Cinebench R10 - Cinebench R10 Rend. Single (64bit)
min: 10927     avg: 11135     median: 11135 (14%)     max: 11343 Points
wPrime 2.10 - wPrime 2.0 1024m *
412.8 s (5%)
240.4 s (3%)
wPrime 2.10 - wPrime 2.0 32m *
11.8 s (2%)
min: 5.71     avg: 6     median: 5.8 (1%)     max: 6.875 s
WinRAR - WinRAR 4.0
6045 Points (10%)
7-Zip 18.03 - 7-Zip 18.03 Multli Thread 4 runs
min: 11122     avg: 12669     median: 12919.5 (7%)     max: 13422 MIPS
min: 18812     avg: 23288     median: 23471 (13%)     max: 27693 MIPS
7-Zip 18.03 - 7-Zip 18.03 Single Thread 4 runs
min: 4497     avg: 4586     median: 4599.5 (55%)     max: 4674 MIPS
min: 3678     avg: 5112     median: 5153 (62%)     max: 5507 MIPS
X264 HD Benchmark 4.0 - x264 Pass 2
26.2 fps (9%)
46.6 fps (16%)
X264 HD Benchmark 4.0 - x264 Pass 1
141.6 fps (33%)
198.8 fps (46%)
HWBOT x265 Benchmark v2.2 - HWBOT x265 4k Preset
min: 3.25     avg: 3.7     median: 3.7 (7%)     max: 4.1 fps
min: 5.02     avg: 6.6     median: 6.6 (12%)     max: 8.13 fps
TrueCrypt - TrueCrypt Serpent
0.2 GB/s (0%)
0.5 GB/s (0%)
TrueCrypt - TrueCrypt Twofish
0.4 GB/s (7%)
0.8 GB/s (14%)
TrueCrypt - TrueCrypt AES
2.8 GB/s (7%)
5.8 GB/s (15%)
Blender - Blender 3.3 Classroom CPU *
2408 Seconds (31%)
135%
M3 +
min: 491     avg: 590     median: 517 (7%)     max: 761 Seconds
min: 1099     avg: 1103     median: 1102.5 (14%)     max: 1106 Seconds
Blender - Blender 2.79 BMW27 CPU *
min: 940     avg: 1037     median: 1021.5 (7%)     max: 1188 Seconds
104%
M3 +
min: 474     avg: 509     median: 494 (3%)     max: 558 Seconds
min: 478     avg: 588     median: 578.5 (4%)     max: 745 Seconds
R Benchmark 2.5 - R Benchmark 2.5 *
min: 0.636     avg: 0.7     median: 0.7 (14%)     max: 0.671 sec
min: 0.55     avg: 0.6     median: 0.6 (13%)     max: 0.615 sec
3DMark 06 - CPU - 3DMark 06 - CPU
6331 Points (13%)
9108 Points (19%)
Super Pi mod 1.5 XS 1M - Super Pi mod 1.5 XS 1M *
8.2 s (2%)
7.1 s (2%)
Super Pi mod 1.5 XS 2M - Super Pi mod 1.5 XS 2M *
18.4 s (1%)
15.6 s (1%)
Super Pi Mod 1.5 XS 32M - Super Pi mod 1.5 XS 32M *
434.8 s (2%)
380.4 s (2%)
3DMark Vantage - 3DM Vant. Perf. CPU no Physx
16869 Points (15%)
29182 Points (26%)
3DMark 11 - 3DM11 Performance Physics
min: 5128     avg: 5771     median: 5579.5 (15%)     max: 6640 Points
min: 5707     avg: 10641     median: 11284 (31%)     max: 12726 Points
3DMark - 3DMark Ice Storm Physics
min: 57115     avg: 59888     median: 60028 (49%)     max: 62520 Points
min: 69716     avg: 71020     median: 71351 (58%)     max: 71993 Points
3DMark - 3DMark Ice Storm Extreme Physics
min: 48647     avg: 55626     median: 56348 (46%)     max: 61883 Points
min: 69895     avg: 70538     median: 70537.5 (57%)     max: 71180 Points
3DMark - 3DMark Ice Storm Unlimited Physics
min: 65022     avg: 65592     median: 65591.5 (55%)     max: 66161 Points
min: 67339     avg: 69256     median: 69331.5 (58%)     max: 71022 Points
3DMark - 3DMark Cloud Gate Physics
min: 3986     avg: 4871     median: 5038 (13%)     max: 5250 Points
min: 5114     avg: 8442     median: 8804 (22%)     max: 10133 Points
3DMark - 3DMark Fire Strike Standard Physics
min: 6125     avg: 7184     median: 7331.5 (13%)     max: 7786 Points
min: 7886     avg: 13151     median: 13684 (24%)     max: 14680 Points
3DMark - 3DMark Time Spy CPU
min: 2227     avg: 2623     median: 2635 (11%)     max: 2937 Points
min: 2489     avg: 4447     median: 4495 (19%)     max: 5608 Points
3DMark - 3DMark Sling Shot Extreme (ES 3.1) Unlimited Physics
5487 Points (65%)
Geekbench 6.2 - Geekbench 6.2 Single-Core
100%
1 M3 +
min: 3026     avg: 3077     median: 3076 (83%)     max: 3130 Points
Geekbench 6.2 - Geekbench 6.2 Multi-Core
100%
1 M3 +
min: 11863     avg: 11984     median: 11992 (47%)     max: 12066 Points
Geekbench 5.5 - Geekbench 5.1 - 5.4 64 Bit Single-Core
min: 1190     avg: 1296     median: 1311.5 (55%)     max: 1352 Points
179%
M3 +
min: 2256     avg: 2316     median: 2342 (99%)     max: 2350 Points
min: 1398     avg: 1520     median: 1529 (65%)     max: 1626 Points
Geekbench 5.5 - Geekbench 5.1 - 5.4 64 Bit Multi-Core
min: 2341     avg: 2628     median: 2605 (5%)     max: 2983 Points
413%
M3 +
min: 10570     avg: 10697     median: 10748 (19%)     max: 10774 Points
min: 4620     avg: 5460     median: 5550 (10%)     max: 5944 Points
Geekbench 5.0 - Geekbench 5.0 64 Bit Single-Core
1328 Points (6%)
min: 1217     avg: 1485     median: 1531.5 (7%)     max: 1561 Points
Geekbench 5.0 - Geekbench 5.0 64 Bit Multi-Core
2399 Points (8%)
min: 4542     avg: 5511     median: 5578.5 (18%)     max: 6349 Points
Geekbench 4.4 - Geekbench 4.1 - 4.4 64 Bit Single-Core
5601 Points (56%)
min: 5587     avg: 6340     median: 6437 (64%)     max: 6682 Points
Geekbench 4.4 - Geekbench 4.1 - 4.4 64 Bit Multi-Core
9945 Points (11%)
min: 20763     avg: 22357     median: 22175 (24%)     max: 25403 Points
Mozilla Kraken 1.1 - Kraken 1.1 Total Score *
min: 657.9     avg: 749     median: 755 (1%)     max: 805 ms
100%
M3 +
min: 362.8     avg: 366.4     median: 363.1 (0%)     max: 373.2 ms
min: 618     avg: 649     median: 645 (1%)     max: 695 ms
Sunspider - Sunspider 1.0 Total Score *
145.8 ms (2%)
Octane V2 - Octane V2 Total Score
min: 49170     avg: 55606     median: 58151 (51%)     max: 59497 Points
167%
M3 +
min: 96622     avg: 97216     median: 96933 (85%)     max: 98093 Points
min: 59942     avg: 62365     median: 61608 (54%)     max: 66300 Points
WebXPRT 4 - WebXPRT 4 Score
152.3 Points (44%)
206%
M3 +
min: 313     avg: 314     median: 314 (90%)     max: 315 Points
min: 189.4     avg: 189.9     median: 189.9 (55%)     max: 190.4 Points
WebXPRT 3 - WebXPRT 3 Score
min: 200     avg: 213.7     median: 204.5 (43%)     max: 257 Points
218%
M3 +
min: 423     avg: 438.7     median: 445 (93%)     max: 448 Points
min: 230     avg: 251.2     median: 253 (53%)     max: 270 Points
PCMark for Android - PCM f. Android Storage 2.0 score
20509 Points (32%)
PCMark for Android - PCM f. Android Work Score 3.0
11801 Points (55%)
CrossMark - CrossMark Overall
min: 950     avg: 1029     median: 1033 (40%)     max: 1094 Points
179%
M3 +
min: 1847     avg: 1850     median: 1847 (71%)     max: 1857 Points
min: 1233     avg: 1343     median: 1325 (51%)     max: 1474 Points
CrXPRT 2 - CrXPRT2 Performance Score
147 Points (81%)
Power Consumption - Prime95 Power Consumption - external Monitor *
min: 24.7     avg: 36.1     median: 35.2 (6%)     max: 44.6 Watt
min: 26.9     avg: 43.8     median: 44.6 (8%)     max: 59.4 Watt
Power Consumption - Cinebench R15 Multi Power Consumption - external Monitor *
min: 25.6     avg: 36.3     median: 39.1 (7%)     max: 41.3 Watt
min: 33.7     avg: 48.1     median: 46.9 (9%)     max: 68.3 Watt
Power Consumption - Geekbench 5.5 Power Consumption 150cd *
22.5 Watt (10%)
Power Consumption - Idle Power Consumption - external Monitor *
3.7 Watt (2%)
101%
1 M3 +
min: 2.63     avg: 2.8     median: 2.8 (2%)     max: 2.87 Watt
10.6 Watt (7%)
Power Consumption - Idle Power Consumption 150cd 1min *
min: 5.66     avg: 6.2     median: 5.8 (6%)     max: 7.67 Watt
102%
1 M3 +
min: 3.94     avg: 4.4     median: 4.4 (5%)     max: 4.7 Watt
4.1 Watt (5%)
Power Consumption - Cinebench R15 Multi Power Efficiency - external Monitor
min: 12.1     avg: 13.5     median: 12.8 (10%)     max: 16.3 Points per Watt
min: 12.3     avg: 17.3     median: 17.5 (13%)     max: 21.1 Points per Watt

Average Benchmarks Intel Core i3-1115G4 → 100% n=15

Average Benchmarks Apple M3 → 199% n=15

Average Benchmarks Intel Core i7-1185G7 → 134% n=15

- Range of benchmark values for this graphics card
- Average benchmark values for this graphics card
* Smaller numbers mean a higher performance
1 This benchmark is not used for the average calculation

v1.28
log 02. 18:23:59

#0 checking url part for id 12242 +0s ... 0s

#1 checking url part for id 15110 +0s ... 0s

#2 checking url part for id 12248 +0s ... 0s

#3 redirected to Ajax server, took 1719937439 +0s ... 0s

#4 did not recreate cache, as it is less than 5 days old! Created at Mon, 01 Jul 2024 05:15:43 +0200 +0s ... 0s

#5 composed specs +0.007s ... 0.007s

#6 did output specs +0s ... 0.007s

#7 getting avg benchmarks for device 12242 +0.002s ... 0.008s

#8 got single benchmarks 12242 +0.003s ... 0.012s

#9 getting avg benchmarks for device 15110 +0.001s ... 0.012s

#10 got single benchmarks 15110 +0.006s ... 0.018s

#11 getting avg benchmarks for device 12248 +0.004s ... 0.022s

#12 got single benchmarks 12248 +0.026s ... 0.048s

#13 got avg benchmarks for devices +0s ... 0.048s

#14 min, max, avg, median took s +0.057s ... 0.104s

#15 return log +0s ... 0.105s

Please share our article, every link counts!
> Expert Reviews and News on Laptops, Smartphones and Tech Innovations > Benchmarks / Tech > Processor Comparison - Head 2 Head
Redaktion, 2017-09- 8 (Update: 2023-07- 1)