 Deutsch
 English
 Español
 Français
 Italiano
 Nederlands
 Polski
 Português
 Русский
 Türkçe
 Svenska
 Chinese
 Magyar
Intel Atom Z3680D vs Intel Core i5-430M
Intel Atom Z3680D
► remove from comparison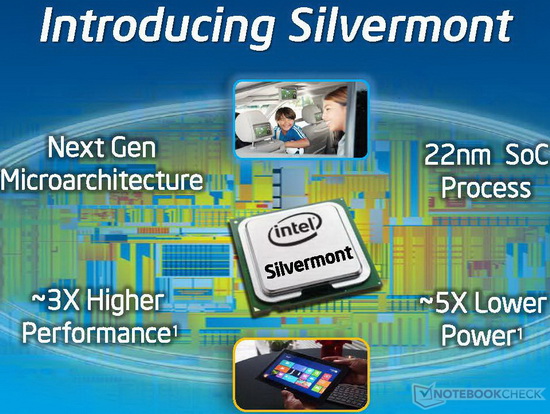
The Intel Atom Z3680D is a power-efficient dual-core SoC for Windows and Android tablets. It is clocked at 1.33 - 2.0 GHz and is part of the Bay Trail-T platform. Thanks to the specially optimized 22nm low-power design process (P1271) with Tri-Gate transistors, performance and energy efficiency have been significantly improved compared to its predecessor. In contrast to the Z3680, the Z3680D offers a different memory controller and a lower display resolution.
Architecture
The processor cores are based on the new Silvermont architecture, which is an out-of-order design for the first time. The increased utilization of the pipeline and many other improvements (optimized branch prediction, increased buffers, and enhanced decoders) have increased the performance per clock by about 50 percent. At the same time, however, the Hyper-Threading feature of the previous generation has been removed. Other major additions are the support for new instruction set extensions such as SSE 4.1 and 4.2 as well as AES-NI (depending on the model).
Performance
Thanks to the improved performance per clock, the Z3680D is faster than previous Intel Atoms like the Z2760. Presumably, the Z3680D even competes with AMD APUs like the AMD A4-4355M. For simple everyday tasks such as Internet or Office the performance is adequate, but not for complex software or modern games.
Graphics
The HD Graphics (Bay Trail) is based on the Intel Gen7 architecture, which supports DirectX 11 and is also found in the Ivy Bridge series (e.g. HD Graphics 4000). With only 4 EUs (Execution Units) and a relatively low clock speed of up to 688 MHz, the GPU is even slower than the HD Graphics (Ivy Bridge). Therefore, only older and less demanding Windows games will run fluently. However, video acceleration and display resolutions up to 1920 x 1200 pixels are no problem for the chip.
Power Consumption
The entire SoC should be rated at an SDP of about 2 W, which would indicate a TDP of less than 4 W. Thus, the chip can be used in passively cooled tablets.
Intel Core i5-430M
► remove from comparison
The Intel Core i5-430M is a fast middle class dual core CPU for laptops and clocks (due to the Turbo Mode) from 2.26 to 2.53 GHz. Each core is based on the Nehalem (Westmere) micro-architecture. Hyperthreading enables the Dual Core CPU to handle 4 threads at once (for a better usage of the pipeline). Compared to the faster Core i7-620M, the 430M only has 3 MB Level 3 Cache, missing VT-d, Trusted Execution, and AES features and a lower clock speed.
A feature of the new Core i5-430M is the integrated graphics card (called Intel HD Graphics) and memory controller. Both are on a separate die that is still manufactured in 45nm whereas the CPU die is already manufactured in the new 32nm process.
Due to the integrated memory controller, the HyperThreading and Turbo Boost, the Core i5-430M is faster than a similar clocked Core 2 Duo in all (us known) applications and benchmarks. In fact, the 430M even came close to a fast Core 2 Duo T9600 (2.8 GHz) in some benchmarks (e.g. Cinebench 10 Multi Threaded). This means the 430M is a fast middle class - performance CPU and much faster than the top AMD model, the Turion II Ultra M660 (at the time of announcement).
The 32nm cpu cores of the Westmere generation can also process some new instructions to accelerate AES encryptions. Still, these functions are deactivated on the Core i5-430M leading to some performance drawbacks in modern applications that support AES encoding using the new instructions (e.g. the Communications Suite test in the PCMark Vantage boosts up to 70% using AES in the faster Core i5-520M).
The integrated Intel Graphics Media Accelerator HD (GMA HD) graphics card is between 500-766 MHz (Turbo Boost) and is clearly faster than the old GMA 4500MHD. A GeForce 9400M (ION) should still be a faster (especially as Nvidia and ATI cards have a better driver support than Intel up to now). The Turbo Boost can overclock the Intel HD Graphics up to 733 MHz when the cores are not fully used.
The power consumption of 35 Watt TDP (max.) counts for the whole package and therefore it is clearly better than the 35 Watt TDP of the Core 2 Duo T-series (CPU alone).
| Model | Intel Atom Z3680D | Intel Core i5-430M | ||||||||||||||||||||||||||||||||||||||||||||||||||||||||||||||||||||||||||||||||||||||||||||||||||||||||||||||||||||||||||||
| Series | Intel Atom | Intel Core i5 | ||||||||||||||||||||||||||||||||||||||||||||||||||||||||||||||||||||||||||||||||||||||||||||||||||||||||||||||||||||||||||||
| Codename | Bay Trail-T | Arrandale | ||||||||||||||||||||||||||||||||||||||||||||||||||||||||||||||||||||||||||||||||||||||||||||||||||||||||||||||||||||||||||||
| Series: Core i5 Arrandale |
|
| ||||||||||||||||||||||||||||||||||||||||||||||||||||||||||||||||||||||||||||||||||||||||||||||||||||||||||||||||||||||||||||
| Clock | 1330 - 2000 MHz | 2260 - 2533 MHz | ||||||||||||||||||||||||||||||||||||||||||||||||||||||||||||||||||||||||||||||||||||||||||||||||||||||||||||||||||||||||||||
| L1 Cache | 112 KB | 128 KB | ||||||||||||||||||||||||||||||||||||||||||||||||||||||||||||||||||||||||||||||||||||||||||||||||||||||||||||||||||||||||||||
| L2 Cache | 1 MB | 512 KB | ||||||||||||||||||||||||||||||||||||||||||||||||||||||||||||||||||||||||||||||||||||||||||||||||||||||||||||||||||||||||||||
| Cores / Threads | 2 / 2 | 2 / 4 | ||||||||||||||||||||||||||||||||||||||||||||||||||||||||||||||||||||||||||||||||||||||||||||||||||||||||||||||||||||||||||||
| TDP | 4 Watt | 35 Watt | ||||||||||||||||||||||||||||||||||||||||||||||||||||||||||||||||||||||||||||||||||||||||||||||||||||||||||||||||||||||||||||
| Technology | 22 nm | 32 nm | ||||||||||||||||||||||||||||||||||||||||||||||||||||||||||||||||||||||||||||||||||||||||||||||||||||||||||||||||||||||||||||
| Features | Intel HD Graphics (Bay Trail, max. 688 MHz), Intel 64, SSE 4.1, SSE 4.2, AES-NI, max. 2 GB Single-Channel DDR3L-RS 1333, Quick Sync | Turbo Boost, Hyper Threading, Enhanced Speedstep, integrierte GMA HD 500-733MHz, SSE4.1, SSE4.2 | ||||||||||||||||||||||||||||||||||||||||||||||||||||||||||||||||||||||||||||||||||||||||||||||||||||||||||||||||||||||||||||
| iGPU | Intel HD Graphics (Bay Trail) (313 - 688 MHz) | |||||||||||||||||||||||||||||||||||||||||||||||||||||||||||||||||||||||||||||||||||||||||||||||||||||||||||||||||||||||||||||
| Architecture | x86 | x86 | ||||||||||||||||||||||||||||||||||||||||||||||||||||||||||||||||||||||||||||||||||||||||||||||||||||||||||||||||||||||||||||
| Announced | ||||||||||||||||||||||||||||||||||||||||||||||||||||||||||||||||||||||||||||||||||||||||||||||||||||||||||||||||||||||||||||||
| FSB | 2500 | |||||||||||||||||||||||||||||||||||||||||||||||||||||||||||||||||||||||||||||||||||||||||||||||||||||||||||||||||||||||||||||
| L3 Cache | 3 MB | |||||||||||||||||||||||||||||||||||||||||||||||||||||||||||||||||||||||||||||||||||||||||||||||||||||||||||||||||||||||||||||
| Transistors | 177 Million | |||||||||||||||||||||||||||||||||||||||||||||||||||||||||||||||||||||||||||||||||||||||||||||||||||||||||||||||||||||||||||||
| Die Size | 144 mm2 | |||||||||||||||||||||||||||||||||||||||||||||||||||||||||||||||||||||||||||||||||||||||||||||||||||||||||||||||||||||||||||||
| max. Temp. | 105 °C | |||||||||||||||||||||||||||||||||||||||||||||||||||||||||||||||||||||||||||||||||||||||||||||||||||||||||||||||||||||||||||||
| Socket | BGA1288, PGA988 | |||||||||||||||||||||||||||||||||||||||||||||||||||||||||||||||||||||||||||||||||||||||||||||||||||||||||||||||||||||||||||||
| Manufacturer | ark.intel.com |

