AMD Radeon RX Vega 11 vs NVIDIA GeForce GTX 1660 Ti Max-Q vs AMD Radeon RX Vega M GH
AMD Radeon RX Vega 11 ► remove from comparison
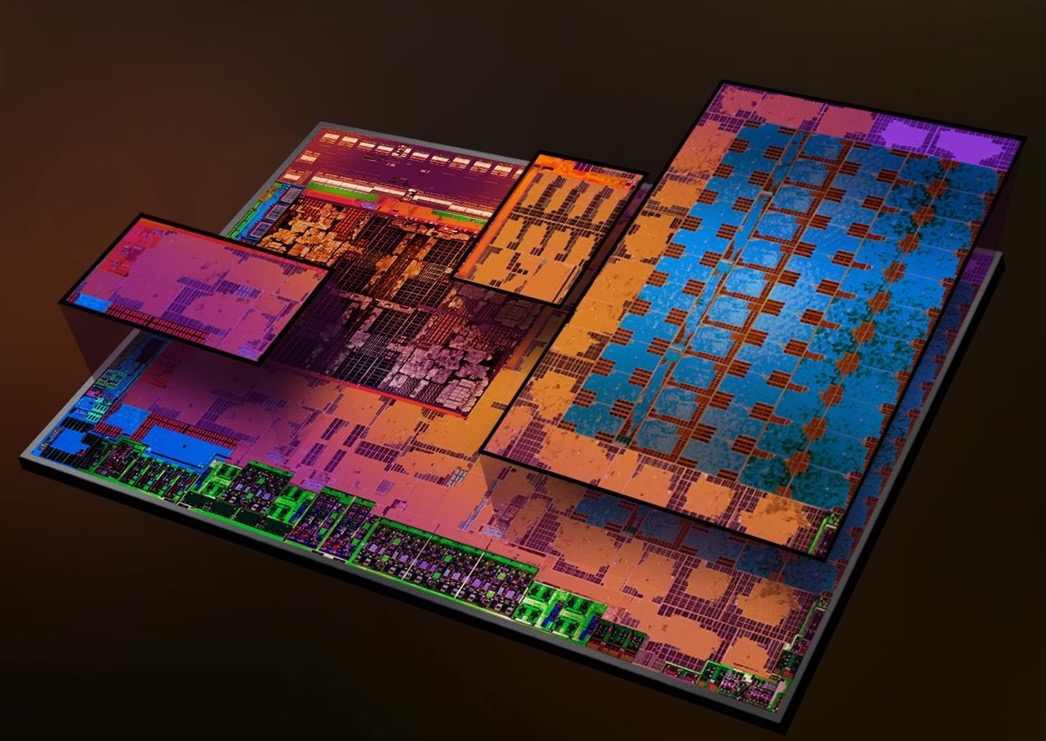
The AMD Radeon RX Vega 11 is an integrated GPU in the Ryzen desktop APUs (e.g. Ryzen 5 2400G) that were launched early 2018. The graphics card is based on the Vega architecture (5th generation GCN) and has all 11 CUs (=704 shaders) clocked at up to 1240 MHz (Ryzen 5 2400G). The GPU benefits from fast dual-channel DDR4-2400 RAM (contrary to DDR4-2133 single-channel, which is also possible).
The Vega architecture offers some improvements over the Polaris generation and now supports DirectX 12 Feature Level 12_1. More information is available in our dedicated article about the Raven Ridge architecture .
According to a first 3DMark Fire Strike that was published by AMD, the Vega 11 offers a similiar theoretical performance as the older dedicated Radeon R9 M280X. In games the missing dedicated graphics memory may however prove to be a bottleneck. Therefore, modern and demanding games will only be playable in lowest settings and the APU is mostly intended for lower demanding games like Overwatch, Dota 2, ...
Thanks to the 14nm process and clever power-saving features, the power consumption is comparatively low. The high TDP of 65 Watt of the APU however should lead to a much higher power consumption compared to the mobile APUs with 15 Watt TDP.
NVIDIA GeForce GTX 1660 Ti Max-Q ► remove from comparison
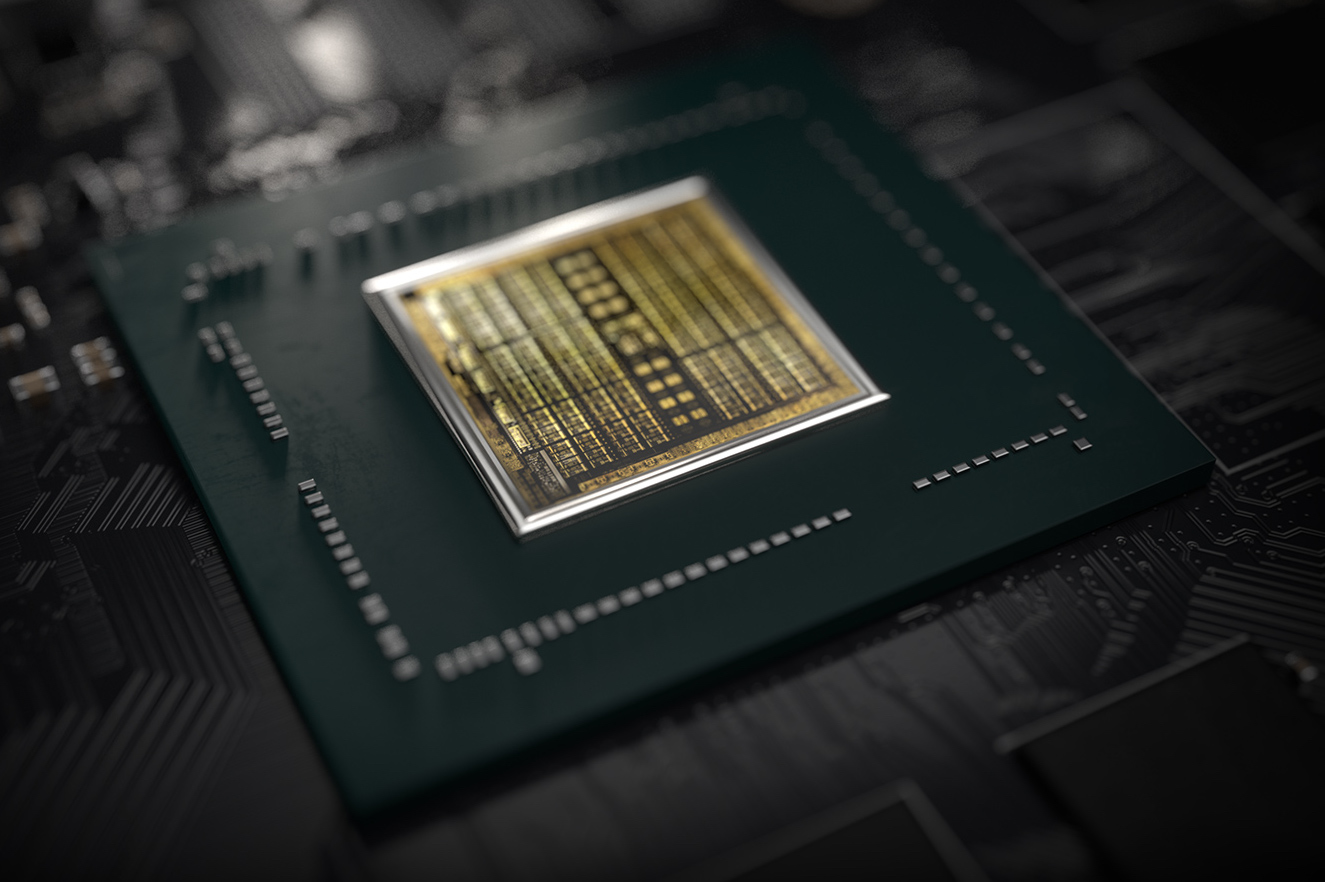
The Nvidia GeForce GTX 1660 Ti with Max-Q Design is a mobile graphics card for laptops that is based on the Turing architecture (TU116 chip). It is designed for thin and light laptops and about 10-15% slower than a regular GTX 1660 Ti for laptops (depending on the cooling capabilities). According to the specifications, the Max-Q variant clocks 22% slower for the base speed and 16% for the boost speed.
Compared to the faster RTX 2000 GPUs (e.g. RTX 2060 ), the 1660Ti integrates no Raytracing or Tensor cores. The performance is similar to the old GTX 1070 (Max-Q) but at a reduced TGP of 60 Watt (versus 80 of the laptop version 115 Watt of the desktop version).
In April 2020 Nvidia refreshed the GTX 1660 Ti with the new codename N18E-G0-A1 with similar specs and pin compatible to the refreshed RTX chips (e.g., RTX 2070 Super Mobile ).
The Turing generation did not only introduce raytracing for the RTX cards, but also optimized the architecture of the cores and caches. According to Nvidia the CUDA cores offer now a concurrent execution of floating point and integer operations for increased performance in compute-heavy workloads of modern games. Furthermore, the caches were reworked (new unified memory architecture with twice the cache compared to Pascal). This leads to 50% more instructions per clock and a 40% more power efficient usage compared to Pascal.
Nvidia specifies a power consumption of 60 Watt TGP (Total Graphics Power) and therefore 20 Watts lower than a normal (Max-P) 1660Ti for laptops . Therefore, the Max-Q variant is well suited for thin and light gaming laptops. The TU116 chip is manufactured in 12nm FFN at TSMC.
AMD Radeon RX Vega M GH ► remove from comparison
The AMD Radeon RX Vega M GH is an integrated GPU in the fastest Intel Kaby-Lake-G SoC. It combines a Kaby-Lake processor, a Vega graphics card and 4 GB HBM2 memory on a single package. The graphics card offers 24 CUs (1536 shaders) and is clocked from 1063 - 1190 MHz.
Currently it looks like the GPU is a mixture of Polaris (Shaders?) and Vega (HBM memory controller at least). E.g. the graphics card is called Polaris 22 internally. Detailed information on the Vega architecture can be found in our dedicated article about the Raven Ridge architecture .
The performance of the Vega M GH should be slightly slower than a dedicated Nvidia GeForce GTX 1060 for laptops according to benchmarks from Intel. Therefore, it should be well suited for 1080p and high resolution gaming.
The power consumption should be quite similar to a dedicated Vega Mobile GPU, but due to the small form factor, smaller laptops can be built with the Kaby-Lake-G SoC. The TDP is specified at 65 Watt for the whole package including GPU, CPU and HBM2 memory.
AMD Radeon RX Vega 11 NVIDIA GeForce GTX 1660 Ti Max-Q AMD Radeon RX Vega M GH AMD Radeon RX Vega Series Codename Vega Raven Ridge N18E-G0 Vega Kaby Lake-G Architecture Vega Turing Vega Pipelines 704 - unified 1536 - unified 1536 - unified Core Speed 1240 (Boost) MHz 1140 - 1335 (Boost) MHz 1063 - 1190 (Boost) MHz Shared Memory no no no API DirectX 12_1 DirectX 12_1, OpenGL 4.6 DirectX 12_1 Power Consumption 65 Watt 60 Watt 100 Watt Transistors 4.5 Billion technology 14 nm 12 nm 14 nm Features Tiled Rasterization, Shared Memory (up to Dual-Channel DDR4-2400) Tiled Rasterization, Shared Memory (up to Dual-Channel DDR4-2400) Date of Announcement 26.10.2017 23.04.2019 07.01.2018 Memory Speed 12000 MHz Memory Bus Width 192 Bit Memory Type GDDR6 HBM2 Max. Amount of Memory 6 GB 4 GB Notebook Size medium sized medium sized Link to Manufacturer Page www.nvidia.com
Benchmarks Performance Rating - 3DMark 11 + Fire Strike + Time Spy - Vega 11
1.6 pt (5%)
...
...
max:
Performance Rating - 3DMark 11 + Fire Strike + Time Spy - GeForce GTX 1660 Ti Max-Q
6.1 pt (18%)
...
NVIDIA GeForce GTX 1660 Ti Max-Q
...
max:
Performance Rating - 3DMark 11 + Fire Strike + Time Spy - Vega M GH
4.7 pt (14%)
...
...
max:
3DMark - 3DMark Time Spy Score
min: 886 avg: 1075 median: 1127 (3%) max: 1212 Points
min: 4547 avg: 5197 median: 5072 (15%) max: 6395 Points
min: 2902 avg: 2999 median: 2999 (9%) max: 3096 Points
3DMark - 3DMark Time Spy Graphics
min: 786 avg: 936 median: 935.5 (2%) max: 1085 Points
min: 4867 avg: 5089 median: 5084.5 (13%) max: 5440 Points
2908 Points (8%)
3DMark - 3DMark Ice Storm Unlimited Graphics
min: 149941 avg: 160025 median: 157382 (18%) max: 175397 Points
min: 220799 avg: 314100 median: 306910 (35%) max: 414592 Points
357446 Points (41%)
3DMark - 3DMark Ice Storm Extreme Graphics
min: 69751 avg: 87099 median: 87098.5 (11%) max: 104446 Points
Model CPU GPU RAM Value AMD Ryzen 5 2400G R5 2400G Vega 11 8 GB 69751 CUK Axiom TS Ryzen 5 2400G Vega 11 400 / 3200 MHz 2 GB 16 GB 104446
min: 76153 avg: 110626 median: 110626 (14%) max: 145099 Points
282345 Points (36%)
3DMark - 3DMark Cloud Gate Score
min: 13263 avg: 14436 median: 14579 (16%) max: 15323 Points
min: 16807 avg: 29350 median: 33027 (35%) max: 39942 Points
min: 24532 avg: 24989 median: 24988.5 (27%) max: 25445 Points
3DMark - 3DMark Cloud Gate Graphics
min: 17047 avg: 20261 median: 20847.5 (5%) max: 22303 Points
min: 38321 avg: 63736 median: 63086 (17%) max: 89505 Points
59162 Points (16%)
3DMark - 3DMark Fire Strike Standard Score
min: 2219 avg: 2934 median: 3038.5 (5%) max: 3264 Points
min: 10103 avg: 11548 median: 11615 (20%) max: 12739 Points
min: 7425 avg: 8693 median: 8506 (15%) max: 10147 Points
3DMark - 3DMark Fire Strike Standard Graphics
min: 3476 avg: 3523 median: 3494 (4%) max: 3599 Points
min: 12903 avg: 13356 median: 13355 (15%) max: 13870 Points
10248 Points (12%)
3DMark - 3DMark Ice Storm Graphics
min: 88177 avg: 108334 median: 108334 (13%) max: 128491 Points
Model CPU GPU RAM Value AMD Ryzen 5 2400G R5 2400G Vega 11 8 GB 88177 CUK Axiom TS Ryzen 5 2400G Vega 11 400 / 3200 MHz 2 GB 16 GB 128491
min: 59373 avg: 104094 median: 86295 (10%) max: 166615 Points
319822 Points (38%)
3DMark - 3DMark Night Raid
8516 Points (8%)
3DMark - 3DMark Night Raid Graphics Score
9324 Points (4%)
3DMark 11 - 3DM11 Performance Score
min: 4277 avg: 5210 median: 5350 (7%) max: 5635 Points
min: 12279 avg: 15364 median: 15913 (22%) max: 17377 Points
13212 Points (18%)
3DMark 11 - 3DM11 Performance GPU
min: 4337 avg: 5213 median: 5483 (5%) max: 5549 Points
min: 17010 avg: 17711 median: 17439 (15%) max: 18653 Points
14302 Points (12%)
3DMark Vantage + NVIDIA GeForce GTX 1660 Ti Max-Q 3DMark Vantage - 3DM Vant. Perf. total
31845 Points (9%)
3DM Vant. Perf. GPU no PhysX + NVIDIA GeForce GTX 1660 Ti Max-Q 3DMark Vantage - 3DM Vant. Perf. GPU no PhysX
34951 Points (20%)
3DMark 06 3DMark 06 - Standard 1280x1024 + AMD Radeon RX Vega 11
20608 Points (27%)
3DMark 06 - Standard 1280x1024 + NVIDIA GeForce GTX 1660 Ti Max-Q
min: 24029 avg: 28247 median: 25211 (33%) max: 38536 Points
3DMark 06 - Standard 1280x1024 + AMD Radeon RX Vega M GH
33046 Points (43%)
SPECviewperf 12 + AMD Radeon RX Vega M GH SPECviewperf 12 - specvp12 sw-03
66.9 fps (17%)
specvp12 snx-02 + AMD Radeon RX Vega M GH SPECviewperf 12 - specvp12 snx-02
20.8 fps (3%)
specvp12 showcase-01 + AMD Radeon RX Vega M GH SPECviewperf 12 - specvp12 showcase-01
49.3 fps (11%)
specvp12 mediacal-01 + AMD Radeon RX Vega M GH SPECviewperf 12 - specvp12 mediacal-01
21.4 fps (5%)
specvp12 maya-04 + AMD Radeon RX Vega M GH SPECviewperf 12 - specvp12 maya-04
54 fps (15%)
specvp12 energy-01 + AMD Radeon RX Vega M GH SPECviewperf 12 - specvp12 energy-01
3.5 fps (3%)
specvp12 creo-01 + AMD Radeon RX Vega M GH SPECviewperf 12 - specvp12 creo-01
45.6 fps (18%)
specvp12 catia-04 + AMD Radeon RX Vega M GH SPECviewperf 12 - specvp12 catia-04
77 fps (13%)
Cinebench R10 Cinebench R10 Shading (32bit) + AMD Radeon RX Vega 11 Cinebench R10 - Cinebench R10 Shading (32bit)
min: 10880 avg: 11001 median: 11001 (8%) max: 11122 Points
Cinebench R10 Shading (32bit) + NVIDIA GeForce GTX 1660 Ti Max-Q
min: 6820 avg: 9290 median: 8562.5 (6%) max: 13213 Points
Cinebench R10 Shading (32bit) + AMD Radeon RX Vega M GH
13015 Points (9%)
Cinebench R11.5 Cinebench R11.5 OpenGL 64 Bit + AMD Radeon RX Vega 11 Cinebench R11.5 - Cinebench R11.5 OpenGL 64 Bit
min: 59.7 avg: 65 median: 65 (23%) max: 70.3 fps
Cinebench R11.5 OpenGL 64 Bit + NVIDIA GeForce GTX 1660 Ti Max-Q
min: 49.83 avg: 59.5 median: 59.5 (21%) max: 69.2 fps
Cinebench R11.5 OpenGL 64 Bit + AMD Radeon RX Vega M GH
123.3 fps (43%)
Cinebench R15 + AMD Radeon RX Vega 11 Cinebench R15 - Cinebench R15 OpenGL 64 Bit
min: 80.1 avg: 80.2 median: 80.1 (5%) max: 80.4 fps
Cinebench R15 OpenGL 64 Bit + NVIDIA GeForce GTX 1660 Ti Max-Q
min: 78.2 avg: 100.5 median: 96.9 (6%) max: 130.7 fps
Cinebench R15 OpenGL 64 Bit + AMD Radeon RX Vega M GH
min: 136 avg: 144 median: 144 (8%) max: 151.9 fps
Cinebench R15 OpenGL Ref. Match 64 Bit + AMD Radeon RX Vega 11 Cinebench R15 - Cinebench R15 OpenGL Ref. Match 64 Bit
98 % (98%)
Cinebench R15 OpenGL Ref. Match 64 Bit + NVIDIA GeForce GTX 1660 Ti Max-Q
99.6 % (100%)
Cinebench R15 OpenGL Ref. Match 64 Bit + AMD Radeon RX Vega M GH
98 % (98%)
GFXBench - GFXBench 5.0 Aztec Ruins High Tier Offscreen
110.2 fps (20%)
GFXBench - GFXBench 5.0 Aztec Ruins Normal Tier Offscreen
253.8 fps (19%)
GFXBench - GFXBench Car Chase Offscreen
227.4 fps (26%)
GFXBench 3.1 - GFXBench Manhattan ES 3.1 Offscreen
345.8 fps (7%)
GFXBench 3.0 - GFXBench 3.0 Manhattan Offscreen
360.6 fps (21%)
GFXBench (DX / GLBenchmark) 2.7 + NVIDIA GeForce GTX 1660 Ti Max-Q GFXBench (DX / GLBenchmark) 2.7 - GFXBench T-Rex HD Offscreen C24Z16
943 fps (8%)
LuxMark v2.0 64Bit - LuxMark v2.0 Room GPU
min: 447 avg: 465 median: 465 (2%) max: 483 Samples/s
2141 Samples/s (10%)
1491 Samples/s (7%)
LuxMark v2.0 64Bit - LuxMark v2.0 Sala GPU
min: 1019 avg: 1074 median: 1074 (2%) max: 1129 Samples/s
4254 Samples/s (7%)
2867 Samples/s (5%)
ComputeMark v2.1 - ComputeMark v2.1 Result
min: 3392 avg: 3425 median: 3425 (4%) max: 3458 Points
10027 Points (11%)
6661 Points (7%)
Power Consumption - Furmark Stress Test Power Consumption - external Monitor *
min: 78.7 avg: 89.3 median: 89.3 (13%) max: 99.9 Watt
min: 77.6 avg: 86.3 median: 86.3 (12%) max: 95 Watt
Power Consumption - The Witcher 3 Power Consumption - external Monitor *
min: 63.1 avg: 76.1 median: 74.7 (10%) max: 90.5 Watt
min: 92 avg: 96.6 median: 96.6 (13%) max: 101.2 Watt
Power Consumption - Witcher 3 Power Consumption *
90.5 Watt (20%)
Model CPU GPU RAM Value CUK Axiom TS Ryzen 5 2400G Vega 11 400 / 3200 MHz 2 GB 16 GB 90.5
min: 94.2 avg: 104.8 median: 106.9 (24%) max: 121 Watt
121.7 Watt (27%)
Power Consumption - Witcher 3 ultra Power Efficiency
min: 0.4388 avg: 0.5 median: 0.5 (43%) max: 0.537 fps per Watt
0.3 fps per Watt (25%)
Power Consumption - Witcher 3 ultra Power Efficiency - external Monitor
0.2 fps per Watt (13%)
min: 0.4822 avg: 0.5 median: 0.5 (44%) max: 0.578 fps per Watt
Emissions Witcher 3 Fan Noise + AMD Radeon RX Vega 11 Emissions - Witcher 3 Fan Noise
42 dB(A) (67%)
Witcher 3 Fan Noise + NVIDIA GeForce GTX 1660 Ti Max-Q
min: 34 avg: 43.4 median: 43.7 (70%) max: 53.8 dB(A)
Witcher 3 Fan Noise + AMD Radeon RX Vega M GH
42 dB(A) (67%)
Clock Speed - GPU Clock Witcher 3 ultra
1240 MHz (49%)
1501 MHz (59%)
1190 MHz (47%)
Clock Speed - GPU Clock Speed Furmark
1240 MHz (49%)
1062 MHz (42%)
1190 MHz (47%)
Average Benchmarks AMD Radeon RX Vega 11 → 100% n=21 Average Benchmarks NVIDIA GeForce GTX 1660 Ti Max-Q → 246% n=21 Average Benchmarks AMD Radeon RX Vega M GH → 223% n=21
- Range of benchmark values for this graphics card
- Average benchmark values for this graphics card
* Smaller numbers mean a higher performance
1 This benchmark is not used for the average calculation
Game Benchmarks The following benchmarks stem from our benchmarks of review laptops. The performance depends on the used graphics memory, clock rate, processor, system settings, drivers, and operating systems. So the results don't have to be representative for all laptops with this GPU. For detailed information on the benchmark results, click on the fps number.
GeForce GTX 1660 Ti Max-Q:
55.1 fps
GeForce GTX 1660 Ti Max-Q:
49.4 fps
GeForce GTX 1660 Ti Max-Q:
37.1 fps
GeForce GTX 1660 Ti Max-Q:
25.3 fps
GeForce GTX 1660 Ti Max-Q:
119 fps
GeForce GTX 1660 Ti Max-Q:
78 fps
GeForce GTX 1660 Ti Max-Q:
65 fps
GeForce GTX 1660 Ti Max-Q:
51 fps
GeForce GTX 1660 Ti Max-Q:
136.1 fps
GeForce GTX 1660 Ti Max-Q:
87.7 fps
GeForce GTX 1660 Ti Max-Q:
81.3 fps
GeForce GTX 1660 Ti Max-Q:
78.4 fps
GeForce GTX 1660 Ti Max-Q:
219 fps
GeForce GTX 1660 Ti Max-Q:
130 fps
GeForce GTX 1660 Ti Max-Q:
112 fps
GeForce GTX 1660 Ti Max-Q:
79 fps
GeForce GTX 1660 Ti Max-Q:
214.7 fps
GeForce GTX 1660 Ti Max-Q:
130.2 fps
GeForce GTX 1660 Ti Max-Q:
79.9 fps
GeForce GTX 1660 Ti Max-Q:
56.1 fps
GeForce GTX 1660 Ti Max-Q:
168.9 fps
GeForce GTX 1660 Ti Max-Q:
101.7 fps
GeForce GTX 1660 Ti Max-Q:
95.4 fps
GeForce GTX 1660 Ti Max-Q:
93.4 fps
GeForce GTX 1660 Ti Max-Q:
176.8 fps
GeForce GTX 1660 Ti Max-Q:
81.2 fps
GeForce GTX 1660 Ti Max-Q:
63.3 fps
GeForce GTX 1660 Ti Max-Q:
121.2 fps
GeForce GTX 1660 Ti Max-Q:
98.3 fps
GeForce GTX 1660 Ti Max-Q:
90.5 fps
GeForce GTX 1660 Ti Max-Q:
87.7 fps
GeForce GTX 1660 Ti Max-Q:
115.1 fps
GeForce GTX 1660 Ti Max-Q:
71.7 fps
GeForce GTX 1660 Ti Max-Q:
47.2 fps
GeForce GTX 1660 Ti Max-Q:
29.4 fps
GeForce GTX 1660 Ti Max-Q:
91.5 fps
GeForce GTX 1660 Ti Max-Q:
78.1 fps
GeForce GTX 1660 Ti Max-Q:
72.4 fps
GeForce GTX 1660 Ti Max-Q:
95.8 fps
GeForce GTX 1660 Ti Max-Q:
83 fps
GeForce GTX 1660 Ti Max-Q:
73.9 fps
GeForce GTX 1660 Ti Max-Q:
66.9 fps
GeForce GTX 1660 Ti Max-Q:
135.2 fps
GeForce GTX 1660 Ti Max-Q:
88 fps
GeForce GTX 1660 Ti Max-Q:
72.6 fps
GeForce GTX 1660 Ti Max-Q:
62.6 fps
GeForce GTX 1660 Ti Max-Q:
112.9 fps
GeForce GTX 1660 Ti Max-Q:
86.5 fps
GeForce GTX 1660 Ti Max-Q:
72 fps
GeForce GTX 1660 Ti Max-Q:
58.7 fps
GeForce GTX 1660 Ti Max-Q:
83 114 ~ 99 fps
GeForce GTX 1660 Ti Max-Q:
68 72 ~ 70 fps
GeForce GTX 1660 Ti Max-Q:
65 66 ~ 66 fps
GeForce GTX 1660 Ti Max-Q:
48 51 ~ 50 fps
GeForce GTX 1660 Ti Max-Q:
147.9 fps
GeForce GTX 1660 Ti Max-Q:
145.4 fps
GeForce GTX 1660 Ti Max-Q:
141 fps
GeForce GTX 1660 Ti Max-Q:
139.3 fps
100%
Vega 11:
38.1 [X] AMD Ryzen 5 2400G AMD Ryzen 5 2400G 3.6GHz
Vega 11
56.1 [X] AMD Ryzen 5 2400G 3.6GHz
Vega 11
~ 47 fps
217%
GeForce GTX 1660 Ti Max-Q:
87 116.5 ~ 102 fps
100%
Vega 11:
14.3 [X] AMD Ryzen 5 2400G AMD Ryzen 5 2400G 3.6GHz
Vega 11
21.7 [X] AMD Ryzen 5 2400G 3.6GHz
Vega 11
~ 18 fps
428%
GeForce GTX 1660 Ti Max-Q:
72.1 81.5 ~ 77 fps
100%
Vega 11:
8.2 [X] AMD Ryzen 5 2400G AMD Ryzen 5 2400G 3.6GHz
Vega 11
13.2 [X] AMD Ryzen 5 2400G 3.6GHz
Vega 11
~ 11 fps
491%
GeForce GTX 1660 Ti Max-Q:
52.9 54.9 ~ 54 fps
100%
Vega 11:
6.2 [X] AMD Ryzen 5 2400G AMD Ryzen 5 2400G 3.6GHz
Vega 11
8.9 [X] AMD Ryzen 5 2400G 3.6GHz
Vega 11
~ 8 fps
525%
GeForce GTX 1660 Ti Max-Q:
41.5 42.3 ~ 42 fps
100%
Vega 11:
41.2 [X] AMD Ryzen 5 2400G 3.6GHz
Vega 11
fps
384%
GeForce GTX 1660 Ti Max-Q:
158.3 fps
100%
Vega 11:
12.5 [X] AMD Ryzen 5 2400G 3.6GHz
Vega 11
fps
510%
GeForce GTX 1660 Ti Max-Q:
63.7 fps
100%
Vega 11:
7.1 [X] AMD Ryzen 5 2400G 3.6GHz
Vega 11
fps
663%
GeForce GTX 1660 Ti Max-Q:
47.1 fps
100%
Vega 11:
84 [X] AMD Ryzen 5 2400G 3.6GHz
Vega 11
min:
72 fps, max:
101 fps
fps
201%
GeForce GTX 1660 Ti Max-Q:
155 183 ~ 169 fps
100%
Vega 11:
43 [X] AMD Ryzen 5 2400G 3.6GHz
Vega 11
min:
37 fps, max:
46 fps
fps
302%
GeForce GTX 1660 Ti Max-Q:
119 140 ~ 130 fps
100%
Vega 11:
30 [X] AMD Ryzen 5 2400G 3.6GHz
Vega 11
min:
27 fps, max:
33 fps
fps
373%
GeForce GTX 1660 Ti Max-Q:
106 117 ~ 112 fps
GeForce GTX 1660 Ti Max-Q:
71 77 ~ 74 fps
GeForce GTX 1660 Ti Max-Q:
76.5 93.1 ~ 85 fps
GeForce GTX 1660 Ti Max-Q:
54.7 57.1 ~ 56 fps
GeForce GTX 1660 Ti Max-Q:
41.1 41.6 ~ 41 fps
100%
Vega 11:
37.5 [X] AMD Ryzen 5 2400G 3.6GHz
Vega 11
fps
403%
GeForce GTX 1660 Ti Max-Q:
146.4 154.7 ~ 151 fps
100%
Vega 11:
31.9 [X] AMD Ryzen 5 2400G 3.6GHz
Vega 11
fps
232%
GeForce GTX 1660 Ti Max-Q:
70.9 76.2 ~ 74 fps
100%
Vega 11:
31.1 [X] AMD Ryzen 5 2400G 3.6GHz
Vega 11
fps
199%
GeForce GTX 1660 Ti Max-Q:
58.7 65.8 ~ 62 fps
GeForce GTX 1660 Ti Max-Q:
58.2 64.8 ~ 62 fps
100%
Vega 11:
58.5 [X] AMD Ryzen 5 2400G 3.6GHz
Vega 11
fps
126%
GeForce GTX 1660 Ti Max-Q:
59.6 87.9 ~ 74 fps
100%
Vega 11:
21.3 [X] AMD Ryzen 5 2400G 3.6GHz
Vega 11
fps
333%
GeForce GTX 1660 Ti Max-Q:
58.7 83.2 ~ 71 fps
100%
Vega 11:
12.9 [X] AMD Ryzen 5 2400G 3.6GHz
Vega 11
fps
426%
GeForce GTX 1660 Ti Max-Q:
45.3 64.1 ~ 55 fps
GeForce GTX 1660 Ti Max-Q:
26 33.2 ~ 30 fps
100%
Vega 11:
62 [X] AMD Ryzen 5 2400G 3.6GHz
Vega 11
fps
203%
GeForce GTX 1660 Ti Max-Q:
110 142 ~ 126 fps
100%
Vega 11:
33 [X] AMD Ryzen 5 2400G 3.6GHz
Vega 11
fps
255%
GeForce GTX 1660 Ti Max-Q:
80 87 ~ 84 fps
100%
Vega 11:
17 [X] AMD Ryzen 5 2400G 3.6GHz
Vega 11
fps
400%
GeForce GTX 1660 Ti Max-Q:
66 69 ~ 68 fps
GeForce GTX 1660 Ti Max-Q:
49 50 ~ 50 fps
100%
Vega 11:
121.1 [X] MSI B350I Pro AC - DDR4-2933, 512 MB GPU AMD Ryzen 5 2400G 3.6GHz
Vega 11
fps
155%
GeForce GTX 1660 Ti Max-Q:
181.2 194.2 ~ 188 fps
100%
Vega 11:
44.3 [X] MSI B350I Pro AC - DDR4-2933, 512 MB GPU AMD Ryzen 5 2400G 3.6GHz
Vega 11
fps
273%
GeForce GTX 1660 Ti Max-Q:
102.6 139.9 ~ 121 fps
100%
Vega 11:
35.8 [X] MSI B350I Pro AC - DDR4-2933, 512 MB GPU AMD Ryzen 5 2400G 3.6GHz
Vega 11
fps
268%
GeForce GTX 1660 Ti Max-Q:
88.7 103.2 ~ 96 fps
100%
Vega 11:
18.5 [X] MSI B350I Pro AC - DDR4-2933, 512 MB GPU AMD Ryzen 5 2400G 3.6GHz
Vega 11
fps
314%
GeForce GTX 1660 Ti Max-Q:
57.3 59.2 ~ 58 fps
Vega 11:
0 (!) [X] MSI B350I Pro AC - DDR4-2933, 512 MB GPU AMD Ryzen 5 2400G 3.6GHz
Vega 11
fps
GeForce GTX 1660 Ti Max-Q:
53.6 fps
GeForce GTX 1660 Ti Max-Q:
48.9 fps
GeForce GTX 1660 Ti Max-Q:
48.8 fps
GeForce GTX 1660 Ti Max-Q:
46.4 fps
100%
Vega 11:
28 [X] AMD Ryzen 5 2400G AMD Ryzen 5 2400G 3.6GHz
Vega 11
min:
21 fps, max:
33 fps
39 [X] MSI B350I Pro AC - DDR4-2933, 512 MB GPU AMD Ryzen 5 2400G 3.6GHz
Vega 11
~ 34 fps
285%
GeForce GTX 1660 Ti Max-Q:
97 fps
100%
Vega 11:
14 [X] AMD Ryzen 5 2400G AMD Ryzen 5 2400G 3.6GHz
Vega 11
min:
12 fps, max:
17 fps
21 [X] MSI B350I Pro AC - DDR4-2933, 512 MB GPU AMD Ryzen 5 2400G 3.6GHz
Vega 11
~ 18 fps
450%
GeForce GTX 1660 Ti Max-Q:
81 fps
100%
Vega 11:
13 [X] AMD Ryzen 5 2400G AMD Ryzen 5 2400G 3.6GHz
Vega 11
min:
11 fps, max:
16 fps
19 [X] MSI B350I Pro AC - DDR4-2933, 512 MB GPU AMD Ryzen 5 2400G 3.6GHz
Vega 11
~ 16 fps
488%
GeForce GTX 1660 Ti Max-Q:
78 fps
100%
Vega 11:
13 [X] AMD Ryzen 5 2400G AMD Ryzen 5 2400G 3.6GHz
Vega 11
min:
9 fps, max:
15 fps
18 [X] MSI B350I Pro AC - DDR4-2933, 512 MB GPU AMD Ryzen 5 2400G 3.6GHz
Vega 11
~ 16 fps
444%
GeForce GTX 1660 Ti Max-Q:
71 fps
100%
Vega 11:
26 [X] AMD Ryzen 5 2400G AMD Ryzen 5 2400G 3.6GHz
Vega 11
min:
16.08 fps, max:
36.45 fps
fps
100%
Vega 11:
11.3 [X] AMD Ryzen 5 2400G AMD Ryzen 5 2400G 3.6GHz
Vega 11
min:
4.88 fps, max:
16.88 fps
fps
531%
GeForce GTX 1660 Ti Max-Q:
53.9 60 66.5 ~ 60 fps
100%
Vega 11:
8.3 [X] AMD Ryzen 5 2400G AMD Ryzen 5 2400G 3.6GHz
Vega 11
min:
3.72 fps, max:
13.18 fps
fps
100%
Vega 11:
7 [X] AMD Ryzen 5 2400G AMD Ryzen 5 2400G 3.6GHz
Vega 11
min:
3.25 fps, max:
10.35 fps
fps
100%
Vega 11:
64.6 [X] MSI B350I Pro AC - DDR4-2933, 512 MB GPU AMD Ryzen 5 2400G 3.6GHz
Vega 11
min:
59 fps, max:
73 fps
fps
223%
GeForce GTX 1660 Ti Max-Q:
144 144 ~ 144 fps
100%
Vega 11:
32.6 [X] MSI B350I Pro AC - DDR4-2933, 512 MB GPU AMD Ryzen 5 2400G 3.6GHz
Vega 11
min:
29 fps, max:
40 fps
fps
368%
GeForce GTX 1660 Ti Max-Q:
105.3 133.9 ~ 120 fps
100%
Vega 11:
23.8 [X] MSI B350I Pro AC - DDR4-2933, 512 MB GPU AMD Ryzen 5 2400G 3.6GHz
Vega 11
min:
21 fps, max:
28 fps
fps
399%
GeForce GTX 1660 Ti Max-Q:
90.1 99.6 ~ 95 fps
GeForce GTX 1660 Ti Max-Q:
89 99.6 ~ 94 fps
100%
Vega 11:
39.4 [X] MSI B350I Pro AC - DDR4-2933, 512 MB GPU AMD Ryzen 5 2400G 3.6GHz
Vega 11
min:
36 fps, max:
44 fps
fps
100%
Vega 11:
24.9 [X] MSI B350I Pro AC - DDR4-2933, 512 MB GPU AMD Ryzen 5 2400G 3.6GHz
Vega 11
min:
22 fps, max:
29 fps
fps
100%
Vega 11:
19.4 [X] MSI B350I Pro AC - DDR4-2933, 512 MB GPU AMD Ryzen 5 2400G 3.6GHz
Vega 11
min:
17 fps, max:
21 fps
fps
100%
Vega 11:
18.1 [X] MSI B350I Pro AC - DDR4-2933, 512 MB GPU AMD Ryzen 5 2400G 3.6GHz
Vega 11
min:
16 fps, max:
20 fps
fps
100%
Vega 11:
79.6 [X] MSI B350I Pro AC - DDR4-2933, 512 MB GPU AMD Ryzen 5 2400G 3.6GHz
Vega 11
min:
32 fps, max:
105 fps
fps
170%
GeForce GTX 1660 Ti Max-Q:
135.6 fps
100%
Vega 11:
26.8 [X] MSI B350I Pro AC - DDR4-2933, 512 MB GPU AMD Ryzen 5 2400G 3.6GHz
Vega 11
min:
17 fps, max:
32 fps
fps
320%
GeForce GTX 1660 Ti Max-Q:
85.8 fps
100%
Vega 11:
20.8 [X] MSI B350I Pro AC - DDR4-2933, 512 MB GPU AMD Ryzen 5 2400G 3.6GHz
Vega 11
min:
16 fps, max:
24 fps
fps
372%
GeForce GTX 1660 Ti Max-Q:
77.4 fps
100%
Vega 11:
17.3 [X] MSI B350I Pro AC - DDR4-2933, 512 MB GPU AMD Ryzen 5 2400G 3.6GHz
Vega 11
min:
15 fps, max:
20 fps
fps
421%
GeForce GTX 1660 Ti Max-Q:
72.8 fps
100%
Vega 11:
66.9 [X] AMD Ryzen 5 2400G 3.6GHz
Vega 11
min:
43 fps, max:
99 fps
66.9 [X] MSI B350I Pro AC - DDR4-2933, 512 MB GPU AMD Ryzen 5 2400G 3.6GHz
Vega 11
min:
43 fps, max:
99 fps
~ 67 fps
100%
Vega 11:
30.9 [X] AMD Ryzen 5 2400G 3.6GHz
Vega 11
min:
24 fps, max:
47 fps
30.9 [X] MSI B350I Pro AC - DDR4-2933, 512 MB GPU AMD Ryzen 5 2400G 3.6GHz
Vega 11
min:
24 fps, max:
47 fps
~ 31 fps
100%
Vega 11:
26.1 [X] AMD Ryzen 5 2400G 3.6GHz
Vega 11
min:
19 fps, max:
42 fps
26.1 [X] MSI B350I Pro AC - DDR4-2933, 512 MB GPU AMD Ryzen 5 2400G 3.6GHz
Vega 11
min:
19 fps, max:
42 fps
~ 26 fps
100%
Vega 11:
25.1 [X] AMD Ryzen 5 2400G 3.6GHz
Vega 11
min:
18 fps, max:
42 fps
25.1 [X] MSI B350I Pro AC - DDR4-2933, 512 MB GPU AMD Ryzen 5 2400G 3.6GHz
Vega 11
min:
18 fps, max:
42 fps
~ 25 fps
292%
GeForce GTX 1660 Ti Max-Q:
61 73 85 ~ 73 fps
100%
Vega 11:
8.4 [X] AMD Ryzen 5 2400G 3.6GHz
Vega 11
min:
6 fps, max:
15 fps
8.4 [X] MSI B350I Pro AC - DDR4-2933, 512 MB GPU AMD Ryzen 5 2400G 3.6GHz
Vega 11
min:
6 fps, max:
15 fps
~ 8 fps
474%
GeForce GTX 1660 Ti Max-Q:
37.9 fps
100%
Vega 11:
125.8 [X] MSI B350I Pro AC - DDR4-2933, 512 MB GPU AMD Ryzen 5 2400G 3.6GHz
Vega 11
min:
110 fps, max:
162 fps
fps
100%
Vega 11:
64.2 [X] MSI B350I Pro AC - DDR4-2933, 512 MB GPU AMD Ryzen 5 2400G 3.6GHz
Vega 11
min:
56 fps, max:
83 fps
fps
100%
Vega 11:
36.6 [X] MSI B350I Pro AC - DDR4-2933, 512 MB GPU AMD Ryzen 5 2400G 3.6GHz
Vega 11
min:
30 fps, max:
55 fps
fps
100%
Vega 11:
15.7 [X] MSI B350I Pro AC - DDR4-2933, 512 MB GPU AMD Ryzen 5 2400G 3.6GHz
Vega 11
min:
7 fps, max:
31 fps
fps
100%
Vega 11:
44.5 [X] AMD Ryzen 5 2400G 3.6GHz
Vega 11
min:
41 fps, max:
51 fps
44.5 [X] MSI B350I Pro AC - DDR4-2933, 512 MB GPU AMD Ryzen 5 2400G 3.6GHz
Vega 11
min:
41 fps, max:
51 fps
~ 45 fps
100%
Vega 11:
24.2 [X] AMD Ryzen 5 2400G 3.6GHz
Vega 11
min:
21 fps, max:
29 fps
24.2 [X] MSI B350I Pro AC - DDR4-2933, 512 MB GPU AMD Ryzen 5 2400G 3.6GHz
Vega 11
min:
21 fps, max:
29 fps
~ 24 fps
100%
Vega 11:
22.3 [X] AMD Ryzen 5 2400G 3.6GHz
Vega 11
min:
20 fps, max:
26 fps
22.3 [X] MSI B350I Pro AC - DDR4-2933, 512 MB GPU AMD Ryzen 5 2400G 3.6GHz
Vega 11
min:
20 fps, max:
26 fps
~ 22 fps
100%
Vega 11:
21.6 [X] AMD Ryzen 5 2400G 3.6GHz
Vega 11
min:
10 fps, max:
26 fps
21.6 [X] MSI B350I Pro AC - DDR4-2933, 512 MB GPU AMD Ryzen 5 2400G 3.6GHz
Vega 11
min:
10 fps, max:
26 fps
~ 22 fps
100%
Vega 11:
35.9 [X] AMD Ryzen 5 2400G 3.6GHz
Vega 11
min:
26 fps, max:
45 fps
35.9 [X] MSI B350I Pro AC - DDR4-2933, 512 MB GPU AMD Ryzen 5 2400G 3.6GHz
Vega 11
min:
26 fps, max:
45 fps
~ 36 fps
Vega 11:
0 (!) [X] AMD Ryzen 5 2400G 3.6GHz
Vega 11
0 (!) [X] MSI B350I Pro AC - DDR4-2933, 512 MB GPU AMD Ryzen 5 2400G 3.6GHz
Vega 11
~ 0 fps
100%
Vega 11:
61.3 [X] AMD Ryzen 5 2400G 3.6GHz
Vega 11
61.3 [X] MSI B350I Pro AC - DDR4-2933, 512 MB GPU AMD Ryzen 5 2400G 3.6GHz
Vega 11
~ 61 fps
189%
GeForce GTX 1660 Ti Max-Q:
115.2 fps
100%
Vega 11:
22.5 [X] AMD Ryzen 5 2400G 3.6GHz
Vega 11
22.5 [X] MSI B350I Pro AC - DDR4-2933, 512 MB GPU AMD Ryzen 5 2400G 3.6GHz
Vega 11
~ 23 fps
382%
GeForce GTX 1660 Ti Max-Q:
87.9 fps
GeForce GTX 1660 Ti Max-Q:
84.6 fps
GeForce GTX 1660 Ti Max-Q:
83.1 fps
100%
Vega 11:
37 [X] AMD Ryzen 5 2400G 3.6GHz
Vega 11
min:
16 fps, max:
68 fps
fps
181%
GeForce GTX 1660 Ti Max-Q:
48 64 90 ~ 67 fps
100%
Vega 11:
20 [X] AMD Ryzen 5 2400G 3.6GHz
Vega 11
min:
7 fps, max:
29 fps
fps
285%
GeForce GTX 1660 Ti Max-Q:
43 56 71 ~ 57 fps
100%
Vega 11:
16 [X] AMD Ryzen 5 2400G 3.6GHz
Vega 11
min:
4 fps, max:
25 fps
fps
313%
GeForce GTX 1660 Ti Max-Q:
39 51 60 ~ 50 fps
100%
Vega 11:
11 [X] AMD Ryzen 5 2400G 3.6GHz
Vega 11
min:
7 fps, max:
17 fps
fps
364%
GeForce GTX 1660 Ti Max-Q:
33 42 44 ~ 40 fps
100%
Vega 11:
5 [X] AMD Ryzen 5 2400G 3.6GHz
Vega 11
min:
2 fps, max:
6 fps
fps
100%
Vega 11:
78 [X] AMD Ryzen 5 2400G 3.6GHz
Vega 11
fps
100%
Vega 11:
38 [X] AMD Ryzen 5 2400G 3.6GHz
Vega 11
fps
100%
Vega 11:
35 [X] AMD Ryzen 5 2400G 3.6GHz
Vega 11
fps
100%
Vega 11:
29 [X] AMD Ryzen 5 2400G 3.6GHz
Vega 11
fps
100%
Vega 11:
12 [X] AMD Ryzen 5 2400G 3.6GHz
Vega 11
fps
100%
Vega 11:
123.6 [X] AMD Ryzen 5 2400G 3.6GHz
Vega 11
min:
98 fps, max:
146 fps
fps
100%
Vega 11:
89.3 [X] AMD Ryzen 5 2400G 3.6GHz
Vega 11
min:
83 fps, max:
96 fps
fps
100%
Vega 11:
77.6 [X] AMD Ryzen 5 2400G 3.6GHz
Vega 11
min:
69 fps, max:
85 fps
fps
100%
Vega 11:
76.6 [X] AMD Ryzen 5 2400G 3.6GHz
Vega 11
min:
69 fps, max:
84 fps
fps
100%
Vega 11:
25 [X] AMD Ryzen 5 2400G 3.6GHz
Vega 11
min:
23 fps, max:
27 fps
fps
100%
Vega 11:
49 [X] AMD Ryzen 5 2400G 3.6GHz
Vega 11
fps
196%
GeForce GTX 1660 Ti Max-Q:
62 82 113 126 ~ 96 fps
100%
Vega 11:
19 [X] AMD Ryzen 5 2400G 3.6GHz
Vega 11
fps
368%
GeForce GTX 1660 Ti Max-Q:
53 57 83 85 ~ 70 fps
100%
Vega 11:
17 [X] AMD Ryzen 5 2400G 3.6GHz
Vega 11
fps
376%
GeForce GTX 1660 Ti Max-Q:
52 53 74 75 ~ 64 fps
100%
Vega 11:
14 [X] AMD Ryzen 5 2400G 3.6GHz
Vega 11
fps
407%
GeForce GTX 1660 Ti Max-Q:
49 49 64 67 ~ 57 fps
100%
Vega 11:
4 [X] AMD Ryzen 5 2400G 3.6GHz
Vega 11
fps
100%
Vega 11:
49.9 [X] AMD Ryzen 5 2400G 1.47.22.14 D3D12
AMD Ryzen 5 2400G 3.6GHz
Vega 11
min:
38 fps, P1:
43.5 fps, max:
73.5 fps
fps
100%
Vega 11:
20.2 [X] AMD Ryzen 5 2400G 1.47.22.14 D3D12
AMD Ryzen 5 2400G 3.6GHz
Vega 11
min:
16 fps, P1:
18 fps, max:
25.6 fps
fps
100%
Vega 11:
17.1 [X] AMD Ryzen 5 2400G 1.47.22.14 D3D12
AMD Ryzen 5 2400G 3.6GHz
Vega 11
min:
13.2 fps, P1:
13.4 fps, max:
26.7 fps
fps
100%
Vega 11:
14.8 [X] AMD Ryzen 5 2400G 1.47.22.14 D3D12
AMD Ryzen 5 2400G 3.6GHz
Vega 11
min:
5 fps, P1:
11.8 fps, max:
154 fps
fps
100%
Vega 11:
71 [X] AMD Ryzen 5 2400G 3.6GHz
Vega 11
min:
54 fps, max:
84 fps
fps
100%
Vega 11:
38 [X] AMD Ryzen 5 2400G 3.6GHz
Vega 11
min:
28 fps, max:
46 fps
fps
100%
Vega 11:
29 [X] AMD Ryzen 5 2400G 3.6GHz
Vega 11
min:
19 fps, max:
32 fps
fps
100%
Vega 11:
19 [X] AMD Ryzen 5 2400G 3.6GHz
Vega 11
min:
15 fps, max:
22 fps
fps
100%
Vega 11:
10 [X] AMD Ryzen 5 2400G 3.6GHz
Vega 11
min:
3 fps, max:
12 fps
fps
100%
Vega 11:
43.5 [X] AMD Ryzen 5 2400G 3.6GHz
Vega 11
min:
40 fps, max:
50 fps
fps
154%
GeForce GTX 1660 Ti Max-Q:
66.9 fps
100%
Vega 11:
19.9 [X] AMD Ryzen 5 2400G 3.6GHz
Vega 11
min:
16 fps, max:
24 fps
fps
298%
GeForce GTX 1660 Ti Max-Q:
59.3 fps
100%
Vega 11:
18.3 [X] AMD Ryzen 5 2400G 3.6GHz
Vega 11
min:
15 fps, max:
22 fps
fps
325%
GeForce GTX 1660 Ti Max-Q:
59.5 fps
100%
Vega 11:
13.9 [X] AMD Ryzen 5 2400G 3.6GHz
Vega 11
min:
11 fps, max:
16 fps
fps
365%
GeForce GTX 1660 Ti Max-Q:
50.8 fps
100%
Vega 11:
58.8 [X] AMD Ryzen 5 2400G 3.6GHz
Vega 11
fps
100%
Vega 11:
28.4 [X] AMD Ryzen 5 2400G 3.6GHz
Vega 11
fps
100%
Vega 11:
24.6 [X] AMD Ryzen 5 2400G 3.6GHz
Vega 11
fps
100%
Vega 11:
17.8 [X] AMD Ryzen 5 2400G 3.6GHz
Vega 11
fps
100%
Vega 11:
5.5 [X] AMD Ryzen 5 2400G 3.6GHz
Vega 11
fps
100%
Vega 11:
32 [X] AMD Ryzen 5 2400G AMD Ryzen 5 2400G 3.6GHz
Vega 11
min:
29 fps, max:
37 fps
49 [X] AMD Ryzen 5 2400G 3.6GHz
Vega 11
min:
45 fps, max:
58 fps
~ 41 fps
210%
GeForce GTX 1660 Ti Max-Q:
68 103 ~ 86 fps
100%
Vega 11:
15 [X] AMD Ryzen 5 2400G AMD Ryzen 5 2400G 3.6GHz
Vega 11
min:
13 fps, max:
18 fps
23 [X] AMD Ryzen 5 2400G 3.6GHz
Vega 11
min:
17 fps, max:
28 fps
~ 19 fps
363%
GeForce GTX 1660 Ti Max-Q:
54 84 ~ 69 fps
100%
Vega 11:
14 [X] AMD Ryzen 5 2400G AMD Ryzen 5 2400G 3.6GHz
Vega 11
min:
12 fps, max:
17 fps
22 [X] AMD Ryzen 5 2400G 3.6GHz
Vega 11
min:
20 fps, max:
27 fps
~ 18 fps
367%
GeForce GTX 1660 Ti Max-Q:
53 79 ~ 66 fps
100%
Vega 11:
13 [X] AMD Ryzen 5 2400G AMD Ryzen 5 2400G 3.6GHz
Vega 11
min:
12 fps, max:
16 fps
20 [X] AMD Ryzen 5 2400G 3.6GHz
Vega 11
min:
16 fps, max:
25 fps
~ 17 fps
365%
GeForce GTX 1660 Ti Max-Q:
50 74 ~ 62 fps
GeForce GTX 1660 Ti Max-Q:
30 fps
GeForce GTX 1660 Ti Max-Q:
376.8 fps
GeForce GTX 1660 Ti Max-Q:
215.9 fps
GeForce GTX 1660 Ti Max-Q:
117.3 fps
100%
Vega 11:
38.7 [X] AMD Ryzen 5 2400G AMD Ryzen 5 2400G 3.6GHz
Vega 11
44.8 [X] AMD Ryzen 5 2400G 3.6GHz
Vega 11
~ 42 fps
100%
Vega 11:
29.8 [X] AMD Ryzen 5 2400G AMD Ryzen 5 2400G 3.6GHz
Vega 11
34.6 [X] AMD Ryzen 5 2400G 3.6GHz
Vega 11
~ 32 fps
100%
Vega 11:
28 [X] AMD Ryzen 5 2400G AMD Ryzen 5 2400G 3.6GHz
Vega 11
31.8 [X] AMD Ryzen 5 2400G 3.6GHz
Vega 11
~ 30 fps
100%
Vega 11:
15.7 [X] AMD Ryzen 5 2400G AMD Ryzen 5 2400G 3.6GHz
Vega 11
18.1 [X] AMD Ryzen 5 2400G 3.6GHz
Vega 11
~ 17 fps
100%
Vega 11:
50.6 [X] AMD Ryzen 5 2400G 3.6GHz
Vega 11
min:
41 fps, max:
57 fps
fps
248%
GeForce GTX 1660 Ti Max-Q:
125.6 fps
100%
Vega 11:
22.3 [X] AMD Ryzen 5 2400G 3.6GHz
Vega 11
min:
18 fps, max:
26 fps
fps
411%
GeForce GTX 1660 Ti Max-Q:
91.7 fps
100%
Vega 11:
18.7 [X] AMD Ryzen 5 2400G 3.6GHz
Vega 11
min:
15 fps, max:
22 fps
fps
413%
GeForce GTX 1660 Ti Max-Q:
77.3 fps
100%
Vega 11:
14.1 [X] AMD Ryzen 5 2400G 3.6GHz
Vega 11
min:
11 fps, max:
17 fps
fps
381%
GeForce GTX 1660 Ti Max-Q:
53.7 fps
100%
Vega 11:
24.4 [X] AMD Ryzen 5 2400G 1.3
AMD Ryzen 5 2400G 3.6GHz
Vega 11
27.2 [X] MSI B350I Pro AC - DDR4 Standard AMD Ryzen 5 2400G 3.6GHz
Vega 11
min:
15 fps, max:
34 fps
31.1 [X] MSI B350I Pro AC - DDR4-2933, 512 MB GPU AMD Ryzen 5 2400G 3.6GHz
Vega 11
min:
25 fps, max:
44 fps
31.3 [X] AMD Ryzen 5 2400G 3.6GHz
Vega 11
min:
25 fps, max:
39 fps
~ 29 fps
100%
Vega 11:
12.9 [X] AMD Ryzen 5 2400G 1.3
AMD Ryzen 5 2400G 3.6GHz
Vega 11
14.7 [X] MSI B350I Pro AC - DDR4 Standard AMD Ryzen 5 2400G 3.6GHz
Vega 11
min:
8 fps, max:
19 fps
16.4 [X] MSI B350I Pro AC - DDR4-2933, 512 MB GPU AMD Ryzen 5 2400G 3.6GHz
Vega 11
min:
9 fps, max:
22 fps
16.4 [X] AMD Ryzen 5 2400G 3.6GHz
Vega 11
min:
7 fps, max:
22 fps
~ 15 fps
100%
Vega 11:
7.7 [X] AMD Ryzen 5 2400G 1.3
AMD Ryzen 5 2400G 3.6GHz
Vega 11
fps
646%
GeForce GTX 1660 Ti Max-Q:
44.9 50 54.6 ~ 50 fps
100%
Vega 11:
5.8 [X] AMD Ryzen 5 2400G 1.3
AMD Ryzen 5 2400G 3.6GHz
Vega 11
fps
100%
Vega 11:
3.3 [X] AMD Ryzen 5 2400G 1.3
AMD Ryzen 5 2400G 3.6GHz
Vega 11
fps
100%
Vega 11:
183 [X] AMD Ryzen 5 2400G 3.6GHz
Vega 11
min:
128 fps, max:
244 fps
fps
75%
GeForce GTX 1660 Ti Max-Q:
138 fps
100%
Vega 11:
86 [X] AMD Ryzen 5 2400G 3.6GHz
Vega 11
min:
68 fps, max:
104 fps
fps
107%
GeForce GTX 1660 Ti Max-Q:
92.2 fps
100%
Vega 11:
30.8 [X] AMD Ryzen 5 2400G 3.6GHz
Vega 11
min:
26 fps, max:
35 fps
fps
291%
GeForce GTX 1660 Ti Max-Q:
89.5 fps
GeForce GTX 1660 Ti Max-Q:
78.6 fps
100%
Vega 11:
37 [X] MSI B350I Pro AC - DDR4 Standard AMD Ryzen 5 2400G 3.6GHz
Vega 11
min:
10 fps, max:
63 fps
41 [X] MSI B350I Pro AC - DDR4-2933, 512 MB GPU AMD Ryzen 5 2400G 3.6GHz
Vega 11
min:
9 fps, max:
72 fps
41 [X] AMD Ryzen 5 2400G 3.6GHz
Vega 11
min:
15 fps, max:
66 fps
~ 40 fps
100%
Vega 11:
20 [X] MSI B350I Pro AC - DDR4 Standard AMD Ryzen 5 2400G 3.6GHz
Vega 11
min:
4 fps, max:
34 fps
23 [X] MSI B350I Pro AC - DDR4-2933, 512 MB GPU AMD Ryzen 5 2400G 3.6GHz
Vega 11
min:
6 fps, max:
40 fps
23 [X] AMD Ryzen 5 2400G 3.6GHz
Vega 11
min:
11 fps, max:
40 fps
~ 22 fps
100%
Vega 11:
18 [X] MSI B350I Pro AC - DDR4 Standard AMD Ryzen 5 2400G 3.6GHz
Vega 11
min:
6 fps, max:
34 fps
19 [X] MSI B350I Pro AC - DDR4-2933, 512 MB GPU AMD Ryzen 5 2400G 3.6GHz
Vega 11
min:
4 fps, max:
86 fps
20 [X] AMD Ryzen 5 2400G 3.6GHz
Vega 11
min:
10 fps, max:
35 fps
~ 19 fps
100%
Vega 11:
56.7 [X] MSI B350I Pro AC - DDR4-2933, 512 MB GPU AMD Ryzen 5 2400G 3.6GHz
Vega 11
P1:
38.5 fps
fps
100%
Vega 11:
30.8 [X] MSI B350I Pro AC - DDR4-2933, 512 MB GPU AMD Ryzen 5 2400G 3.6GHz
Vega 11
P1:
23.9 fps
fps
100%
Vega 11:
28.2 [X] MSI B350I Pro AC - DDR4-2933, 512 MB GPU AMD Ryzen 5 2400G 3.6GHz
Vega 11
P1:
20.9 fps
fps
100%
Vega 11:
23.9 [X] MSI B350I Pro AC - DDR4-2933, 512 MB GPU AMD Ryzen 5 2400G 3.6GHz
Vega 11
P1:
19.3 fps
fps
100%
Vega 11:
48 [X] AMD Ryzen 5 2400G 3.6GHz
Vega 11
min:
28 fps, max:
70 fps
53 [X] MSI B350I Pro AC - DDR4-2933, 512 MB GPU AMD Ryzen 5 2400G 3.6GHz
Vega 11
min:
19 fps, max:
109 fps
~ 51 fps
178%
GeForce GTX 1660 Ti Max-Q:
91 fps
100%
Vega 11:
24 [X] MSI B350I Pro AC - DDR4-2933, 512 MB GPU AMD Ryzen 5 2400G 3.6GHz
Vega 11
min:
15 fps, max:
44 fps
24 [X] AMD Ryzen 5 2400G 3.6GHz
Vega 11
min:
14 fps, max:
38 fps
~ 24 fps
342%
GeForce GTX 1660 Ti Max-Q:
82 fps
100%
Vega 11:
18 [X] AMD Ryzen 5 2400G 3.6GHz
Vega 11
min:
12 fps, max:
31 fps
19 [X] MSI B350I Pro AC - DDR4-2933, 512 MB GPU AMD Ryzen 5 2400G 3.6GHz
Vega 11
min:
11 fps, max:
26 fps
~ 19 fps
379%
GeForce GTX 1660 Ti Max-Q:
72 fps
GeForce GTX 1660 Ti Max-Q:
61 fps
100%
Vega 11:
101 [X] AMD Ryzen 5 2400G 3.6GHz
Vega 11
min:
86 fps, max:
115 fps
fps
100%
Vega 11:
45 [X] AMD Ryzen 5 2400G 3.6GHz
Vega 11
min:
39 fps, max:
50 fps
fps
100%
Vega 11:
35 [X] AMD Ryzen 5 2400G 3.6GHz
Vega 11
min:
28 fps, max:
38 fps
fps
100%
Vega 11:
75.4 [X] AMD Ryzen 5 2400G 3.6GHz
Vega 11
min:
67 fps
fps
100%
Vega 11:
26.5 [X] AMD Ryzen 5 2400G 3.6GHz
Vega 11
min:
24 fps
fps
100%
Vega 11:
144 [X] MSI B350I Pro AC - DDR4-2933, 512 MB GPU AMD Ryzen 5 2400G 3.6GHz
Vega 11
min:
120 fps, max:
164 fps
215 [X] AMD Ryzen 5 2400G 3.6GHz
Vega 11
min:
157 fps, max:
251 fps
~ 180 fps
126%
GeForce GTX 1660 Ti Max-Q:
206.7 247.4 ~ 227 fps
100%
Vega 11:
57.6 [X] MSI B350I Pro AC - DDR4-2933, 512 MB GPU AMD Ryzen 5 2400G 3.6GHz
Vega 11
min:
51 fps, max:
65 fps
71 [X] AMD Ryzen 5 2400G 3.6GHz
Vega 11
min:
63 fps, max:
80 fps
~ 64 fps
291%
GeForce GTX 1660 Ti Max-Q:
160.8 212.1 ~ 186 fps
100%
Vega 11:
40 [X] MSI B350I Pro AC - DDR4-2933, 512 MB GPU AMD Ryzen 5 2400G 3.6GHz
Vega 11
min:
34 fps, max:
50 fps
47.1 [X] AMD Ryzen 5 2400G 3.6GHz
Vega 11
min:
40 fps, max:
61 fps
~ 44 fps
359%
GeForce GTX 1660 Ti Max-Q:
141.7 173.7 ~ 158 fps
100%
Vega 11:
15.2 [X] AMD Ryzen 5 2400G 3.6GHz
Vega 11
min:
9 fps, max:
21 fps
fps
GeForce GTX 1660 Ti Max-Q:
130.4 fps
GeForce GTX 1660 Ti Max-Q:
78.1 fps
GeForce GTX 1660 Ti Max-Q:
72.4 fps
GeForce GTX 1660 Ti Max-Q:
41.5 fps
100%
Vega 11:
48.9 [X] DX12
AMD Ryzen 5 2400G 3.6GHz
Vega 11
min:
24.4 fps, max:
65.4 fps
50 [X] DX11
AMD Ryzen 5 2400G 3.6GHz
Vega 11
min:
38 fps, max:
68 fps
~ 49 fps
100%
Vega 11:
18.1 [X] DX11
AMD Ryzen 5 2400G 3.6GHz
Vega 11
min:
14.7 fps, max:
23.3 fps
fps
100%
Vega 11:
139 [X] MSI B350I Pro AC - DDR4-2933, 512 MB GPU AMD Ryzen 5 2400G 3.6GHz
Vega 11
min:
109 fps, max:
170 fps
fps
139%
GeForce GTX 1660 Ti Max-Q:
193.7 fps
100%
Vega 11:
96 [X] MSI B350I Pro AC - DDR4-2933, 512 MB GPU AMD Ryzen 5 2400G 3.6GHz
Vega 11
min:
76 fps, max:
116 fps
fps
100%
Vega 11:
54.2 [X] MSI B350I Pro AC - DDR4-2933, 512 MB GPU AMD Ryzen 5 2400G 3.6GHz
Vega 11
min:
36 fps, max:
67 fps
fps
260%
GeForce GTX 1660 Ti Max-Q:
140.7 fps
100%
Vega 11:
28.3 [X] MSI B350I Pro AC - DDR4-2933, 512 MB GPU AMD Ryzen 5 2400G 3.6GHz
Vega 11
min:
23 fps, max:
35 fps
fps
410%
GeForce GTX 1660 Ti Max-Q:
116 fps
GeForce GTX 1660 Ti Max-Q:
42.4 fps
GeForce GTX 1660 Ti Max-Q:
40.7 fps
GeForce GTX 1660 Ti Max-Q:
93.7 fps
GeForce GTX 1660 Ti Max-Q:
72.7 fps
GeForce GTX 1660 Ti Max-Q:
64.5 fps
GeForce GTX 1660 Ti Max-Q:
232.8 fps
GeForce GTX 1660 Ti Max-Q:
200.1 fps
GeForce GTX 1660 Ti Max-Q:
163.6 fps
GeForce GTX 1660 Ti Max-Q:
148.8 fps
100%
Vega 11:
68 [X] MSI B350I Pro AC - DDR4 Standard AMD Ryzen 5 2400G 3.6GHz
Vega 11
min:
39 fps, max:
94 fps
70 [X] AMD Ryzen 5 2400G 3.6GHz
Vega 11
min:
39 fps, max:
97 fps
~ 69 fps
100%
Vega 11:
47.8 [X] MSI B350I Pro AC - DDR4 Standard AMD Ryzen 5 2400G 3.6GHz
Vega 11
min:
29 fps, max:
69 fps
52.9 [X] AMD Ryzen 5 2400G 3.6GHz
Vega 11
min:
38 fps, max:
73 fps
~ 50 fps
100%
Vega 11:
15 [X] MSI B350I Pro AC - DDR4 Standard AMD Ryzen 5 2400G 3.6GHz
Vega 11
min:
9 fps, max:
24 fps
15.9 [X] AMD Ryzen 5 2400G 3.6GHz
Vega 11
min:
10 fps, max:
25 fps
~ 15 fps
GeForce GTX 1660 Ti Max-Q:
60 fps
GeForce GTX 1660 Ti Max-Q:
60 fps
GeForce GTX 1660 Ti Max-Q:
60 fps
100%
Vega 11:
96.4 [X] AMD Ryzen 5 2400G AMD Ryzen 5 2400G 3.6GHz
Vega 11
min:
77.8 fps, max:
-1 fps
103.3 [X] AMD Ryzen 5 2400G 3.6GHz
Vega 11
min:
88.6 fps
~ 100 fps
108%
GeForce GTX 1660 Ti Max-Q:
93.3 113 119 ~ 108 fps
100%
Vega 11:
72 [X] AMD Ryzen 5 2400G AMD Ryzen 5 2400G 3.6GHz
Vega 11
min:
53.4 fps, max:
-1 fps
80.5 [X] AMD Ryzen 5 2400G 3.6GHz
Vega 11
min:
69.5 fps
~ 76 fps
100%
Vega 11:
37 [X] AMD Ryzen 5 2400G AMD Ryzen 5 2400G 3.6GHz
Vega 11
min:
34.6 fps, max:
-1 fps
54.2 [X] AMD Ryzen 5 2400G 3.6GHz
Vega 11
min:
49.5 fps
~ 46 fps
100%
Vega 11:
34.7 [X] AMD Ryzen 5 2400G AMD Ryzen 5 2400G 3.6GHz
Vega 11
min:
32.7 fps, max:
-1 fps
50.2 [X] AMD Ryzen 5 2400G 3.6GHz
Vega 11
min:
45.7 fps
~ 42 fps
100%
Vega 11:
13.2 [X] AMD Ryzen 5 2400G AMD Ryzen 5 2400G 3.6GHz
Vega 11
min:
12.5 fps, max:
-1 fps
20.7 [X] AMD Ryzen 5 2400G 3.6GHz
Vega 11
min:
19.5 fps
~ 17 fps
GeForce GTX 1660 Ti Max-Q:
89 fps
GeForce GTX 1660 Ti Max-Q:
69 fps
GeForce GTX 1660 Ti Max-Q:
51 fps
100%
Vega 11:
41.8 [X] AMD Ryzen 5 2400G AMD Ryzen 5 2400G 3.6GHz
Vega 11
min:
37 fps, max:
46 fps
fps
100%
Vega 11:
13.8 [X] AMD Ryzen 5 2400G AMD Ryzen 5 2400G 3.6GHz
Vega 11
min:
12 fps, max:
15 fps
fps
100%
Vega 11:
9.6 [X] AMD Ryzen 5 2400G AMD Ryzen 5 2400G 3.6GHz
Vega 11
min:
8 fps, max:
11 fps
fps
GeForce GTX 1660 Ti Max-Q:
30.9 fps
100%
Vega 11:
68.1 [X] AMD Ryzen 5 2400G AMD Ryzen 5 2400G 3.6GHz
Vega 11
min:
30 fps, P1:
47.6 fps, max:
102 fps
102 [X] AMD Ryzen 5 2400G 3.6GHz
Vega 11
~ 85 fps
190%
GeForce GTX 1660 Ti Max-Q:
161.3 fps
100%
Vega 11:
63.7 [X] AMD Ryzen 5 2400G AMD Ryzen 5 2400G 3.6GHz
Vega 11
min:
15 fps, P1:
41.7 fps, max:
97.4 fps
fps
238%
GeForce GTX 1660 Ti Max-Q:
151.5 fps
100%
Vega 11:
17.6 [X] AMD Ryzen 5 2400G AMD Ryzen 5 2400G 3.6GHz
Vega 11
min:
6.34 fps, P1:
12.3 fps, max:
28.9 fps
28.7 [X] AMD Ryzen 5 2400G 3.6GHz
Vega 11
~ 23 fps
498%
GeForce GTX 1660 Ti Max-Q:
114.6 fps
100%
Vega 11:
8.3 [X] AMD Ryzen 5 2400G AMD Ryzen 5 2400G 3.6GHz
Vega 11
min:
0.725 fps, P1:
5.46 fps, max:
12.8 fps
14.3 [X] AMD Ryzen 5 2400G 3.6GHz
Vega 11
~ 11 fps
542%
GeForce GTX 1660 Ti Max-Q:
59.6 fps
100%
Vega 11:
65.9 [X] AMD Ryzen 5 2400G 3.6GHz
Vega 11
fps
100%
Vega 11:
44.7 [X] AMD Ryzen 5 2400G 3.6GHz
Vega 11
fps
100%
Vega 11:
20.1 [X] AMD Ryzen 5 2400G 3.6GHz
Vega 11
fps
100%
Vega 11:
17.5 [X] MSI B350I Pro AC - DDR4 Standard AMD Ryzen 5 2400G 3.6GHz
Vega 11
20 [X] AMD Ryzen 5 2400G 3.6GHz
Vega 11
~ 19 fps
GeForce GTX 1660 Ti Max-Q:
343.8 fps
GeForce GTX 1660 Ti Max-Q:
322.9 fps
GeForce GTX 1660 Ti Max-Q:
296.9 fps
GeForce GTX 1660 Ti Max-Q:
166.1 fps
Average Gaming AMD Radeon RX Vega 11 → 100% Average Gaming 30-70 fps → 100%
Average Gaming NVIDIA GeForce GTX 1660 Ti Max-Q → 329% Average Gaming 30-70 fps → 405%
Average Gaming AMD Radeon RX Vega M GH → 246% Average Gaming 30-70 fps → 251%
 Deutsch
 English
 Español
 Français
 Italiano
 Nederlands
 Polski
 Português
 Русский
 Türkçe
 Svenska
 Chinese
 Magyar