Intel UHD Graphics Xe 750 32EUs (Rocket Lake) vs Intel HD Graphics (Bay Trail)
Intel UHD Graphics Xe 750 32EUs (Rocket Lake) ► remove from comparison
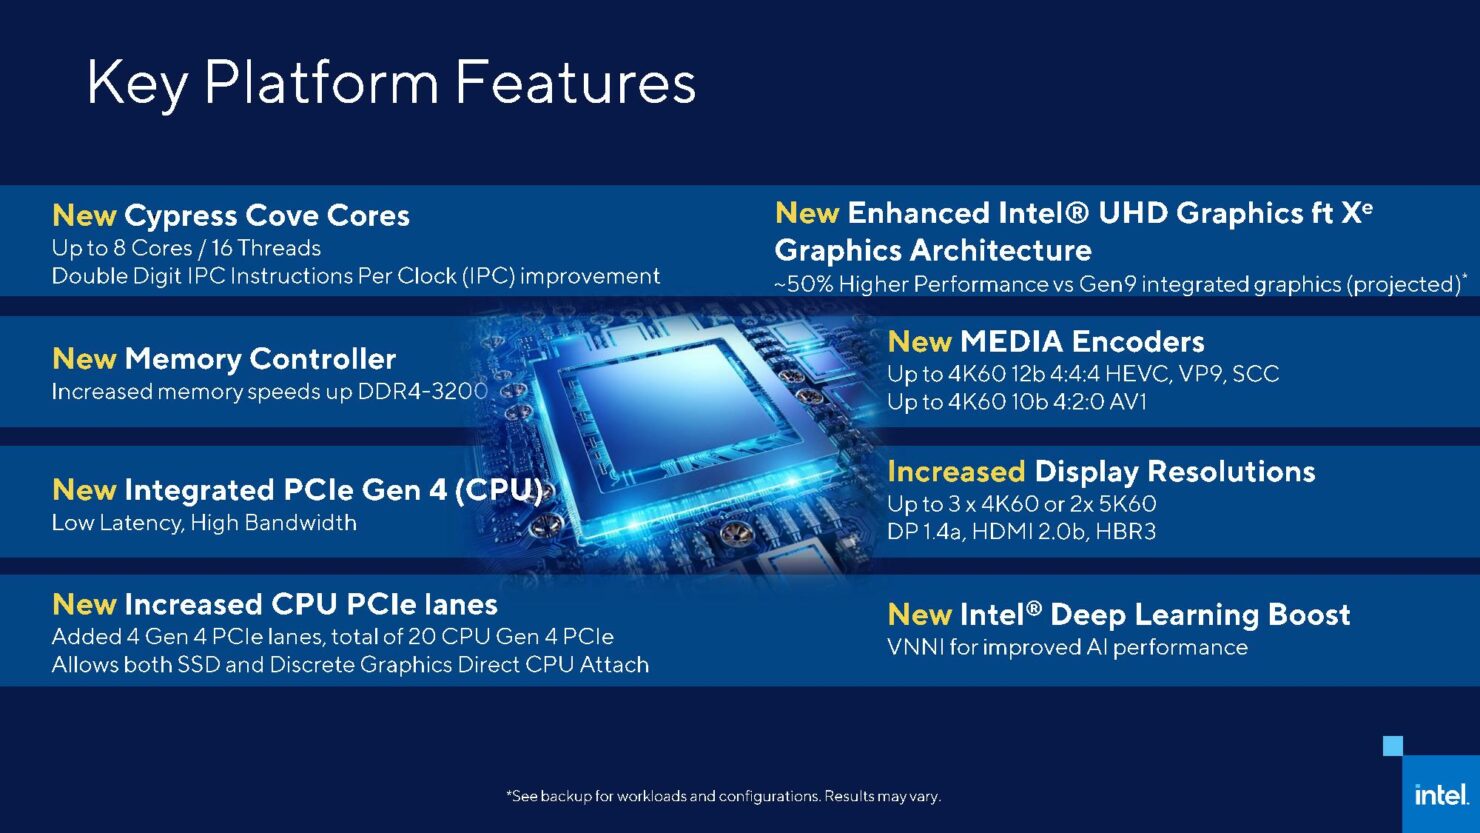
The Intel UHD Graphics Xe 750 (Rocket-Lake GPU with 32 EUs) is a integrated graphics card in the high end Rocket-Lake CPUs. It is using the new Xe architecture (Gen12) and was announced in March 2021.
Compared to the previous generation of UHD Graphics ,the Xe architecture and the improved shader count lead to a big leap in graphics performance. Still, the UHD 750 is only suited for low demanding games or very low settings. The 48 EU version in Tiger Lake SoCs e.g. reached 46 fps in The Witcher 3 low 1024x768 and no fluent framerates in Mafia Definitive Edition.
The Rocket Lake SoCs and therefore the integrated GPU are manufactured in the old 14nm+++ process at Intel.
Intel HD Graphics (Bay Trail) ► remove from comparison
The Intel HD Graphics (Bay Trail) is a low-end integrated Bay Trail graphics card found in certain Atom models (Z3770 ), nettops (J2850 ) and notebook SoCs (N3510 ). It supports DirectX 11 and is based on the Ivy Bridge GPU. Clock rates and shader cores, however, are considerably lower.
Compared to Ivy Bridge, which offers either 6 or 16 Execution Units, the HD Graphics (Bay Trail) comes with only 4 EUs. The core clock is significantly lower as well. Depending on the specific model, the maximum Turbo Boost is 896 MHz or less and the memory controller can support DDR3(L), DDR3L-RS or LPDDR3 in single- or dual-channel operation.
The fastest notebook models equipped with this GPU nearly match the performance of the HD Graphics (Sandy Bridge) and the AMD Radeon HD 6310 . Therefore, older and less demanding Windows games like World of Warcraft or Half-Life 2 can be played fluently in very low settings. Performance is not sufficient for most modern titles.
Compared to competing ARM SoCs, Bay Trail outperforms the Adreno 320 (which can be found in different Qualcomm SoCs like the Snapdragon 600 ) and offers a performance similar to the Tegra 4 GPU. That is enough power to run even the most demanding Android games smoothly in very high resolutions as of 2013.
The integrated video decoder supports all popular codecs such as MPEG2, H.264, VC1, VP8 and MVC and is suitable for resolutions up to 4K up to 100 Mbit/s. The user can connect up to two displays via HDMI 1.4 (max. 1920 x 1080) or DisplayPort 1.2 (max. 2560 x 1600). Another new feature is the support for Wireless Display and Quick Sync, Intel's fast and power efficient H-264 hardware encoder. Some of these features are not available on all models.
Depending on the model, the power consumption of the entire SoC is somewhere between 2 and 10 W. The most efficient versions are therefore suitable for passively cooled tablets, whereas faster variants are used in larger subnotebooks with active cooling.
Intel UHD Graphics Xe 750 32EUs (Rocket Lake) Intel HD Graphics (Bay Trail) HD Graphics Series Codename Rocket Lake Xe Bay Trail Architecture Gen. 12 Gen. 7 Ivy Bridge Pipelines 32 - unified 4 - unified Core Speed 350 - 1450 (Boost) MHz 311 - 896 (Boost) MHz Shared Memory yes yes API DirectX 12_1, OpenGL 4.6 DirectX 11, Shader 5.0, OpenGL 4.0, ES 3.0 technology 14 nm 22 nm Features QuickSync Date of Announcement 30.03.2021 11.09.2013 Memory Bus Width 32/64/128 Bit
CPU in UHD Graphics Xe 750 32EUs GPU Base Speed GPU Boost / Turbo Intel Core i9-11900K 8 x 3500 MHz, 125 W 350 MHz 1300 MHz Intel Core i7-11700K 8 x 3600 MHz, 125 W 350 MHz 1300 MHz Intel Core i5-11600K 6 x 3900 MHz, 125 W 350 MHz 1300 MHz » show 2 more Intel Core i3-N300 8 x ? MHz, 7 W ? MHz 1250 MHz Intel Processor N200 4 x 1000 MHz, 6 W 450 MHz 750 MHz min. - max. 450 MHz 750 - 1300 MHz
CPU in HD Graphics (Bay Trail) GPU Base Speed GPU Boost / Turbo Intel Pentium N3540 4 x 2160 MHz, 7.5 W 313 MHz 896 MHz Intel Pentium J2900 4 x 2410 MHz, 10 W 688 MHz 896 MHz Intel Pentium N3530 4 x 2160 MHz, 7.5 W 313 MHz 896 MHz » show 43 more Intel Pentium J2850 4 x 2400 MHz, 10 W 688 MHz 792 MHz Intel Pentium N3520 4 x 2167 MHz, 7.5 W 313 MHz 854 MHz Intel Celeron J1900 4 x 2000 MHz, 10 W 688 MHz 854 MHz Intel Atom Z3795 4 x 1590 MHz, <4 W 311 MHz 778 MHz Intel Atom Z3785 4 x 1490 MHz, <4 W 313 MHz 833 MHz Intel Atom Z3775 4 x 1460 MHz, <4 W 311 MHz 778 MHz Intel Atom Z3775D 4 x 1490 MHz, <4 W 311 MHz 792 MHz Intel Atom Z3770 4 x 1460 MHz, <4 W 311 MHz 667 MHz Intel Atom Z3770D 4 x 1500 MHz, 4 W 313 MHz 688 MHz Intel Celeron N2940 4 x 1830 MHz, 7.5 W 313 MHz 854 MHz Intel Celeron N2930 4 x 1830 MHz, 7.5 W 313 MHz 854 MHz Intel Celeron J1850 4 x 2000 MHz, 10 W 688 MHz 792 MHz Intel Pentium N3510 4 x 2000 MHz, 7.5 W 313 MHz 750 MHz Intel Celeron N2920 4 x 1860 MHz, 7.5 W 313 MHz 854 MHz Intel Atom E3845 4 x 1910 MHz, 10 W 542 MHz 792 MHz Intel Atom Z3736F 4 x 1330 MHz, 4 W 313 MHz 646 MHz Intel Atom Z3736G 4 x 1330 MHz, <4 W 313 MHz 646 MHz Intel Atom Z3745 4 x 1330 MHz, <4 W 311 MHz 778 MHz Intel Atom Z3745D 4 x 1330 MHz, <4 W 311 MHz 792 MHz Intel Atom Z3740 4 x 1330 MHz, <4 W 311 MHz 667 MHz Intel Atom Z3740D 4 x 1330 MHz, <4 W 313 MHz 688 MHz Intel Atom Z3735D 4 x 1330 MHz, <4 W 311 MHz 646 MHz Intel Atom Z3735E 4 x 1330 MHz, <4 W 311 MHz 646 MHz Intel Atom Z3735F 4 x 1330 MHz, <4 W 311 MHz 646 MHz Intel Atom Z3735G 4 x 1330 MHz, <4 W 311 MHz 646 MHz Intel Celeron J1800 2 x 2410 MHz, 10 W 688 MHz 792 MHz Intel Celeron N2840 2 x 2160 MHz, 7.5 W 313 MHz 792 MHz Intel Celeron J1750 2 x 2410 MHz, 10 W 688 MHz 750 MHz Intel Celeron N2910 4 x 1600 MHz, 7.5 W 313 MHz 756 MHz Intel Celeron N2830 2 x 2160 MHz, 7.5 W 313 MHz 750 MHz Intel Celeron N2820 2 x 2170 MHz, 7.5 W 313 MHz 756 MHz Intel Celeron N2815 2 x 1860 MHz, 7.5 W 313 MHz 756 MHz Intel Celeron N2810 2 x 2000 MHz, 7.5 W 313 MHz 756 MHz Intel Atom Z3680 2 x 1330 MHz, 4 W 311 MHz 667 MHz Intel Atom Z3680D 2 x 1330 MHz, 4 W 313 MHz 688 MHz Intel Celeron N2808 2 x 1580 MHz, 4.3 W 313 MHz 792 MHz Intel Celeron N2807 2 x 1580 MHz, 4.3 W 313 MHz 750 MHz Intel Celeron N2806 2 x 1580 MHz, 4.5 W 313 MHz 756 MHz Intel Atom E3827 2 x 1750 MHz, 8 W 542 MHz 792 MHz Intel Atom E3826 2 x 1460 MHz, 7 W 533 MHz 667 MHz Intel Celeron N2805 2 x 1460 MHz, 4.3 W 313 MHz 667 MHz Intel Atom E3825 2 x 1330 MHz, 6 W ? MHz 533 MHz Intel Atom E3815 1 x 1460 MHz, 5 W ? MHz 400 MHz min. - max. 311 - ? MHz 400 - 1300 MHz
Benchmarks Performance Rating - 3DMark 11 + Fire Strike + Time Spy - UHD Graphics Xe 750 32EUs
1 pt (3%)
...
Intel UHD Graphics Xe 750 32EUs (Rocket Lake)
...
max:
Performance Rating - 3DMark 11 + Fire Strike + Time Spy - HD Graphics (Bay Trail)
0.1 pt (0%)
Intel HD Graphics (Bay Trail)
...
max:
3DMark - 3DMark Time Spy Score
min: 383 avg: 622 median: 735 (2%) max: 747 Points
3DMark - 3DMark Time Spy Graphics
min: 342 avg: 539 median: 634 (2%) max: 642 Points
3DMark - 3DMark Ice Storm Unlimited Graphics
50628 Points (6%)
min: 11835 avg: 14513 median: 14748.5 (2%) max: 17613 Points
3DMark - 3DMark Ice Storm Extreme Graphics
min: 25463 avg: 29673 median: 29673 (4%) max: 33883 Points
min: 4751 avg: 7342 median: 7498 (1%) max: 9234 Points
3DMark - 3DMark Cloud Gate Score
min: 5545 avg: 10811 median: 12119 (13%) max: 13460 Points
min: 354 avg: 1182 median: 1188 (1%) max: 1703 Points
3DMark - 3DMark Cloud Gate Graphics
min: 7604 avg: 10689 median: 11315 (3%) max: 12523 Points
min: 362 avg: 1230 median: 1228.5 (0%) max: 1670 Points
3DMark - 3DMark Fire Strike Standard Score
min: 1024 avg: 1860 median: 2094 (4%) max: 2227 Points
min: 83 avg: 185 median: 147 (0%) max: 495 Points
3DMark - 3DMark Fire Strike Standard Graphics
min: 1144 avg: 1955 median: 2174.5 (2%) max: 2327 Points
min: 90 avg: 149.1 median: 149 (0%) max: 200 Points
3DMark - 3DMark Ice Storm Graphics
min: 35756 avg: 39116 median: 38682.5 (5%) max: 43344 Points
min: 5056 avg: 15391 median: 16047 (2%) max: 21351 Points
3DMark - 3DMark Wild Life Unlimited
2660 Points (1%)
3DMark - 3DMark Wild Life Extreme Unlimited
732 Points (1%)
3DMark - 3DMark Night Raid
3692 Points (3%)
3DMark - 3DMark Night Raid Graphics Score
4435 Points (2%)
3DMark 11 - 3DM11 Performance Score
min: 1407 avg: 2653 median: 3264 (5%) max: 3289 Points
min: 143 avg: 222.6 median: 216 (0%) max: 280 Points
3DMark 11 - 3DM11 Performance GPU
min: 1349 avg: 2328 median: 2811 (2%) max: 2824 Points
min: 122 avg: 192.1 median: 186.5 (0%) max: 237 Points
3DMark Vantage + Intel UHD Graphics Xe 750 32EUs (Rocket Lake) 3DMark Vantage - 3DM Vant. Perf. total
5134 Points (1%)
3DM Vant. Perf. total + Intel HD Graphics (Bay Trail) min: 507 avg: 666 median: 637 (0%) max: 846 Points
3DM Vant. Perf. GPU no PhysX + Intel UHD Graphics Xe 750 32EUs (Rocket Lake) 3DMark Vantage - 3DM Vant. Perf. GPU no PhysX
4452 Points (3%)
3DM Vant. Perf. GPU no PhysX + Intel HD Graphics (Bay Trail) min: 395 avg: 512 median: 503 (0%) max: 667 Points
3DMark 2001SE - 3DMark 2001 - Standard
7727 Points (8%)
3DMark 03 - 3DMark 03 - Standard
min: 4226 avg: 4997 median: 5220 (3%) max: 5323 Points
3DMark 05 - 3DMark 05 - Standard
8935 Points (10%)
min: 2666 avg: 3195 median: 3331 (4%) max: 3445 Points
3DMark 06 3DMark 06 - Standard 1280x1024 + Intel UHD Graphics Xe 750 32EUs (Rocket Lake)
min: 8090 avg: 14361 median: 17392 (23%) max: 17601 Points
3DMark 06 - Standard 1280x1024 + Intel HD Graphics (Bay Trail)
min: 814 avg: 1785 median: 1866 (2%) max: 2151 Points
3DMark 06 - Score Unknown Settings + Intel HD Graphics (Bay Trail)
2108 Points (3%)
3DMark 06 - Standard 1280x800 + Intel HD Graphics (Bay Trail)
2087 Points (3%)
Unigine Valley 1.0 - Unigine Valley 1.0 DX
3.5 fps (1%)
Unigine Heaven 3.0 - Unigine Heaven 3.0 DX 11
3.6 fps (1%)
Unigine Heaven 2.1 - Heaven 2.1 high
min: 2.4 avg: 2.8 median: 2.8 (1%) max: 3.4 fps
Cinebench R10 Cinebench R10 Shading (32bit) + Intel UHD Graphics Xe 750 32EUs (Rocket Lake) Cinebench R10 - Cinebench R10 Shading (32bit)
6088 Points (4%)
Cinebench R10 Shading (32bit) + Intel HD Graphics (Bay Trail)
min: 898 avg: 2014 median: 1991.5 (1%) max: 2889 Points
Cinebench R11.5 Cinebench R11.5 OpenGL 64 Bit + Intel UHD Graphics Xe 750 32EUs (Rocket Lake) Cinebench R11.5 - Cinebench R11.5 OpenGL 64 Bit
min: 22.96 avg: 25.5 median: 25.5 (9%) max: 28.12 fps
Cinebench R11.5 OpenGL 64 Bit + Intel HD Graphics (Bay Trail)
min: 0.37 avg: 6.2 median: 6.4 (2%) max: 7.69 fps
Cinebench R15 + Intel UHD Graphics Xe 750 32EUs (Rocket Lake) Cinebench R15 - Cinebench R15 OpenGL 64 Bit
min: 27.38 avg: 29.8 median: 28 (2%) max: 34.1 fps
Cinebench R15 OpenGL 64 Bit + Intel HD Graphics (Bay Trail) min: 2.88 avg: 5 median: 5.5 (0%) max: 6.55 fps
Cinebench R15 OpenGL Ref. Match 64 Bit + Intel UHD Graphics Xe 750 32EUs (Rocket Lake) Cinebench R15 - Cinebench R15 OpenGL Ref. Match 64 Bit
97.8 % (98%)
Cinebench R15 OpenGL Ref. Match 64 Bit + Intel HD Graphics (Bay Trail)
min: 63 avg: 96.1 median: 97.8 (98%) max: 97.8 %
GFXBench 3.1 - GFXBench Manhattan ES 3.1 Offscreen
5.2 fps (0%)
GFXBench 3.0 - GFXBench 3.0 Manhattan Offscreen
min: 6 avg: 9.7 median: 8.8 (1%) max: 16 fps
GFXBench (DX / GLBenchmark) 2.7 + Intel HD Graphics (Bay Trail) GFXBench (DX / GLBenchmark) 2.7 - GFXBench T-Rex HD Offscreen C24Z16
min: 6 avg: 15.7 median: 16 (0%) max: 20.2 fps
Basemark ES 2.0 - Basemark ES 2.0
min: 45.08 avg: 49.1 median: 49.1 (81%) max: 53.1 fps
Basemark X 1.0 - Basemark X 1.0 Off-Screen
10.1 fps (48%)
Basemark X 1.1 - Basemark X 1.1 High Quality
min: 3008 avg: 6663 median: 8456 (19%) max: 8524 Points
Basemark X 1.1 - Basemark X 1.1 Medium Quality
min: 4802 avg: 12880 median: 14509 (32%) max: 17701 Points
Basemark GPU 1.2 - Basemark GPU 1.2 Vulkan Official Medium Offscreen 1080
31.7 fps (0%)
Basemark GPU 1.2 - Basemark GPU 1.2 Vulkan Official High Offscreen 2160
3 fps (1%)
NenaMark2 - NenaMark2 Score
min: 59 avg: 59.4 median: 59.4 (88%) max: 59.7 fps
Geekbench 6.2 - Geekbench 6.2 GPU OpenCL
2902 Points (1%)
Geekbench 6.2 - Geekbench 6.2 GPU Vulkan
3872 Points (1%)
LuxMark v2.0 64Bit - LuxMark v2.0 Room GPU
min: 129 avg: 336 median: 336 (2%) max: 543 Samples/s
min: 25 avg: 28.5 median: 27 (0%) max: 35 Samples/s
LuxMark v2.0 64Bit - LuxMark v2.0 Sala GPU
min: 369 avg: 742 median: 742 (1%) max: 1115 Samples/s
min: 26 avg: 29 median: 29 (0%) max: 34 Samples/s
ComputeMark v2.1 - ComputeMark v2.1 Result
min: 700 avg: 1024 median: 1024 (1%) max: 1348 Points
min: 160 avg: 172.8 median: 174 (0%) max: 192 Points
PassMark PerformanceTest Mobile V1 - PerformanceTest Mobile V1 2D Graphics Tests
min: 3822 avg: 4036 median: 3866 (4%) max: 4588 Points
PassMark PerformanceTest Mobile V1 - PerformanceTest Mobile V1 3D Graphics Tests
min: 1058 avg: 1251 median: 1228 (2%) max: 1488 Points
Smartbench 2012 - Smartbench 2012 Gaming Index
min: 2679 avg: 3414 median: 3385 (74%) max: 4274 Points
Power Consumption - Furmark Stress Test Power Consumption - external Monitor *
min: 14.2 avg: 44.8 median: 56.9 (8%) max: 63.4 Watt
Power Consumption - The Witcher 3 Power Consumption - external Monitor *
min: 70 avg: 86.4 median: 92.9 (13%) max: 96.2 Watt
Average Benchmarks Intel UHD Graphics Xe 750 32EUs (Rocket Lake) → 100% n=20 Average Benchmarks Intel HD Graphics (Bay Trail) → 21% n=20
- Range of benchmark values for this graphics card
- Average benchmark values for this graphics card
* Smaller numbers mean a higher performance
1 This benchmark is not used for the average calculation
Game Benchmarks The following benchmarks stem from our benchmarks of review laptops. The performance depends on the used graphics memory, clock rate, processor, system settings, drivers, and operating systems. So the results don't have to be representative for all laptops with this GPU. For detailed information on the benchmark results, click on the fps number.
100%
UHD Graphics Xe 750 32EUs:
21.1 [X] Asus ROG Maximus XIII Hero, Intel Xe 750 918016
Intel Core i9-11900K 3.5GHz
UHD Graphics Xe 750 32EUs
min:
18 fps, P1:
18 fps, max:
24 fps
fps
100%
UHD Graphics Xe 750 32EUs:
18.8 [X] Asus ROG Maximus XIII Hero, Intel Xe 750 918016
Intel Core i9-11900K 3.5GHz
UHD Graphics Xe 750 32EUs
min:
16 fps, P1:
16 fps, max:
21 fps
fps
100%
UHD Graphics Xe 750 32EUs:
12.9 (!) [X] Asus ROG Maximus XIII Hero, Intel Xe 750 Intel Core i9-11900K 3.5GHz
UHD Graphics Xe 750 32EUs
min:
7.82 fps, P0.1:
7.9 fps, P1:
8.9 fps, max:
26.4 fps
fps
100%
UHD Graphics Xe 750 32EUs:
198.3 [X] Asus ROG Maximus XIII Hero, Intel Xe 750 Intel Core i9-11900K 3.5GHz
UHD Graphics Xe 750 32EUs
min:
5.35 fps, P0.1:
75.2 fps, P1:
112.9 fps, max:
501 fps
fps
100%
UHD Graphics Xe 750 32EUs:
64.1 [X] Asus ROG Maximus XIII Hero, Intel Xe 750 Intel Core i9-11900K 3.5GHz
UHD Graphics Xe 750 32EUs
min:
5.06 fps, P0.1:
43.2 fps, P1:
48.2 fps, max:
163 fps
fps
100%
UHD Graphics Xe 750 32EUs:
50.8 [X] Asus ROG Maximus XIII Hero, Intel Xe 750 Intel Core i9-11900K 3.5GHz
UHD Graphics Xe 750 32EUs
min:
21.1 fps, P0.1:
37.3 fps, P1:
39 fps, max:
95.6 fps
fps
100%
UHD Graphics Xe 750 32EUs:
36.1 [X] Asus ROG Maximus XIII Hero, Intel Xe 750 Intel Core i9-11900K 3.5GHz
UHD Graphics Xe 750 32EUs
min:
27.9 fps, P0.1:
28.2 fps, P1:
28.9 fps, max:
46.8 fps
fps
100%
UHD Graphics Xe 750 32EUs:
24 [X] Intel Core i9-11900K Intel Core i9-11900K 3.5GHz
UHD Graphics Xe 750 32EUs
min:
14.19 fps, max:
36.89 fps
fps
100%
UHD Graphics Xe 750 32EUs:
10.6 [X] Intel Core i9-11900K Intel Core i9-11900K 3.5GHz
UHD Graphics Xe 750 32EUs
min:
5.39 fps, max:
15.76 fps
fps
100%
UHD Graphics Xe 750 32EUs:
7.7 [X] Intel Core i9-11900K Intel Core i9-11900K 3.5GHz
UHD Graphics Xe 750 32EUs
min:
3.83 fps, max:
11.85 fps
fps
100%
UHD Graphics Xe 750 32EUs:
25.2 51.1 [X] Intel Core i9-11900K 1.47.22.14 D3D12
Intel Core i9-11900K 3.5GHz
UHD Graphics Xe 750 32EUs
min:
10.4 fps, P1:
14.5 fps, max:
566 fps
~ 38 fps
100%
UHD Graphics Xe 750 32EUs:
10.1 19 [X] Intel Core i9-11900K 1.47.22.14 D3D12
Intel Core i9-11900K 3.5GHz
UHD Graphics Xe 750 32EUs
min:
5 fps, P1:
5 fps, max:
430 fps
~ 15 fps
100%
UHD Graphics Xe 750 32EUs:
9.2 15 [X] Intel Core i9-11900K 1.47.22.14 D3D12
Intel Core i9-11900K 3.5GHz
UHD Graphics Xe 750 32EUs
min:
5 fps, P1:
5 fps, max:
446 fps
~ 12 fps
100%
UHD Graphics Xe 750 32EUs:
13.2 [X] Intel Core i9-11900K 1.47.22.14 D3D12
Intel Core i9-11900K 3.5GHz
UHD Graphics Xe 750 32EUs
min:
5 fps, P1:
5 fps, max:
512 fps
fps
100%
UHD Graphics Xe 750 32EUs:
11.3 17.6 [X] Asus ROG Maximus XIII Hero, Intel Xe 750 Intel Core i5-11600K 3.9GHz
UHD Graphics Xe 750 32EUs
18.3 [X] Asus Maximus XIII Hero Intel Core i7-11700K 3.6GHz
UHD Graphics Xe 750 32EUs
~ 16 fps
100%
UHD Graphics Xe 750 32EUs:
8.5 17.3 [X] Asus Maximus XIII Hero Intel Core i7-11700K 3.6GHz
UHD Graphics Xe 750 32EUs
18.8 [X] Asus ROG Maximus XIII Hero, Intel Xe 750 Intel Core i5-11600K 3.9GHz
UHD Graphics Xe 750 32EUs
~ 15 fps
100%
UHD Graphics Xe 750 32EUs:
7.6 16.4 [X] Asus Maximus XIII Hero Intel Core i7-11700K 3.6GHz
UHD Graphics Xe 750 32EUs
18 [X] Asus ROG Maximus XIII Hero, Intel Xe 750 Intel Core i5-11600K 3.9GHz
UHD Graphics Xe 750 32EUs
~ 14 fps
100%
UHD Graphics Xe 750 32EUs:
5.9 23 [X] Intel Core i9-11900K 1.3
Intel Core i9-11900K 3.5GHz
UHD Graphics Xe 750 32EUs
23.6 [X] Asus ROG Maximus XIII Hero, Intel Xe 750 1.3
Intel Core i9-11900K 3.5GHz
UHD Graphics Xe 750 32EUs
~ 18 fps
100%
UHD Graphics Xe 750 32EUs:
3.5 12.3 [X] Asus ROG Maximus XIII Hero, Intel Xe 750 1.3
Intel Core i9-11900K 3.5GHz
UHD Graphics Xe 750 32EUs
12.4 [X] Intel Core i9-11900K 1.3
Intel Core i9-11900K 3.5GHz
UHD Graphics Xe 750 32EUs
~ 9 fps
100%
UHD Graphics Xe 750 32EUs:
2.5 8.4 [X] Asus ROG Maximus XIII Hero, Intel Xe 750 1.3
Intel Core i9-11900K 3.5GHz
UHD Graphics Xe 750 32EUs
8.5 [X] Intel Core i9-11900K 1.3
Intel Core i9-11900K 3.5GHz
UHD Graphics Xe 750 32EUs
~ 6 fps
100%
UHD Graphics Xe 750 32EUs:
6 [X] Asus ROG Maximus XIII Hero, Intel Xe 750 1.3
Intel Core i9-11900K 3.5GHz
UHD Graphics Xe 750 32EUs
fps
100%
UHD Graphics Xe 750 32EUs:
3.5 [X] Asus ROG Maximus XIII Hero, Intel Xe 750 1.3
Intel Core i9-11900K 3.5GHz
UHD Graphics Xe 750 32EUs
fps
HD Graphics (Bay Trail):
26.7 [X] Intel NUC Kit DN2820FYKH Intel Celeron N2820 2.2GHz
HD Graphics (Bay Trail)
min:
23 fps
fps
HD Graphics (Bay Trail):
23.4 [X] Intel NUC Kit DN2820FYKH Intel Celeron N2820 2.2GHz
HD Graphics (Bay Trail)
min:
21 fps
fps
HD Graphics (Bay Trail):
6 [X] Intel NUC Kit DN2820FYKH Intel Celeron N2820 2.2GHz
HD Graphics (Bay Trail)
fps
HD Graphics (Bay Trail):
12.6 [X] Intel NUC Kit DN2820FYKH Intel Celeron N2820 2.2GHz
HD Graphics (Bay Trail)
min:
7 fps, max:
15 fps
fps
HD Graphics (Bay Trail):
0 (!) [X] Intel NUC Kit DN2820FYKH Intel Celeron N2820 2.2GHz
HD Graphics (Bay Trail)
fps
HD Graphics (Bay Trail):
12.1 [X] Intel NUC Kit DN2820FYKH Intel Celeron N2820 2.2GHz
HD Graphics (Bay Trail)
min:
5 fps, max:
18 fps
fps
HD Graphics (Bay Trail):
10.8 [X] Intel NUC Kit DN2820FYKH Intel Celeron N2820 2.2GHz
HD Graphics (Bay Trail)
min:
10 fps, max:
12 fps
fps
100%
UHD Graphics Xe 750 32EUs:
35.1 84.8 [X] Intel Core i9-11900K Intel Core i9-11900K 3.5GHz
UHD Graphics Xe 750 32EUs
min:
31.6 fps, max:
-1 fps
126 [X] Asus ROG Maximus XIII Hero, Intel Xe 750 Intel Core i5-11600K 3.9GHz
UHD Graphics Xe 750 32EUs
min:
108.5 fps, max:
-1 fps
132 [X] Asus ROG Maximus XIII Hero, Intel Xe 750 Intel Core i9-11900K 3.5GHz
UHD Graphics Xe 750 32EUs
min:
109.7 fps, max:
-1 fps
133 [X] Asus Maximus XIII Hero Intel Core i7-11700K 3.6GHz
UHD Graphics Xe 750 32EUs
min:
107.7 fps, max:
-1 fps
~ 102 fps
24%
HD Graphics (Bay Trail):
24.7 [X] Intel NUC Kit DN2820FYKH Intel Celeron N2820 2.2GHz
HD Graphics (Bay Trail)
min:
22.2 fps
fps
100%
UHD Graphics Xe 750 32EUs:
20.6 60.3 [X] Intel Core i9-11900K Intel Core i9-11900K 3.5GHz
UHD Graphics Xe 750 32EUs
min:
29.5 fps, max:
-1 fps
73.8 [X] Asus ROG Maximus XIII Hero, Intel Xe 750 Intel Core i9-11900K 3.5GHz
UHD Graphics Xe 750 32EUs
min:
64.6 fps, max:
-1 fps
74.2 [X] Asus Maximus XIII Hero Intel Core i7-11700K 3.6GHz
UHD Graphics Xe 750 32EUs
min:
65.4 fps, max:
-1 fps
74.7 [X] Asus ROG Maximus XIII Hero, Intel Xe 750 Intel Core i5-11600K 3.9GHz
UHD Graphics Xe 750 32EUs
min:
66.1 fps, max:
-1 fps
~ 61 fps
16%
HD Graphics (Bay Trail):
9.7 [X] Intel NUC Kit DN2820FYKH Intel Celeron N2820 2.2GHz
HD Graphics (Bay Trail)
min:
8.8 fps
fps
100%
UHD Graphics Xe 750 32EUs:
10.9 32.6 [X] Intel Core i9-11900K Intel Core i9-11900K 3.5GHz
UHD Graphics Xe 750 32EUs
min:
7.8 fps, max:
-1 fps
34.9 [X] Asus ROG Maximus XIII Hero, Intel Xe 750 Intel Core i5-11600K 3.9GHz
UHD Graphics Xe 750 32EUs
min:
31.8 fps, max:
-1 fps
35.5 [X] Asus Maximus XIII Hero Intel Core i7-11700K 3.6GHz
UHD Graphics Xe 750 32EUs
min:
32.4 fps, max:
-1 fps
35.6 [X] Asus ROG Maximus XIII Hero, Intel Xe 750 Intel Core i9-11900K 3.5GHz
UHD Graphics Xe 750 32EUs
min:
32.3 fps, max:
-1 fps
~ 30 fps
18%
HD Graphics (Bay Trail):
5.5 [X] Intel NUC Kit DN2820FYKH Intel Celeron N2820 2.2GHz
HD Graphics (Bay Trail)
min:
-1.4 fps
fps
100%
UHD Graphics Xe 750 32EUs:
9.9 30 [X] Intel Core i9-11900K Intel Core i9-11900K 3.5GHz
UHD Graphics Xe 750 32EUs
min:
11.4 fps, max:
-1 fps
31.9 [X] Asus ROG Maximus XIII Hero, Intel Xe 750 Intel Core i5-11600K 3.9GHz
UHD Graphics Xe 750 32EUs
min:
29.2 fps, max:
-1 fps
32.5 [X] Asus Maximus XIII Hero Intel Core i7-11700K 3.6GHz
UHD Graphics Xe 750 32EUs
min:
29.6 fps, max:
-1 fps
32.6 [X] Asus ROG Maximus XIII Hero, Intel Xe 750 Intel Core i9-11900K 3.5GHz
UHD Graphics Xe 750 32EUs
min:
29.7 fps, max:
-1 fps
~ 27 fps
20%
HD Graphics (Bay Trail):
5.4 [X] Intel NUC Kit DN2820FYKH Intel Celeron N2820 2.2GHz
HD Graphics (Bay Trail)
min:
-3 fps
fps
100%
UHD Graphics Xe 750 32EUs:
12.4 [X] Asus ROG Maximus XIII Hero, Intel Xe 750 Intel Core i9-11900K 3.5GHz
UHD Graphics Xe 750 32EUs
min:
11.5 fps, max:
-1 fps
fps
HD Graphics (Bay Trail):
22 [X] Intel NUC Kit DN2820FYKH Intel Celeron N2820 2.2GHz
HD Graphics (Bay Trail)
min:
16 fps, max:
33 fps
24.2 ~ 23 fps
HD Graphics (Bay Trail):
0 (!) [X] Intel NUC Kit DN2820FYKH Intel Celeron N2820 2.2GHz
HD Graphics (Bay Trail)
12.5 ~ 6 fps
100%
UHD Graphics Xe 750 32EUs:
36.8 fps
100%
UHD Graphics Xe 750 32EUs:
34.1 fps
HD Graphics (Bay Trail):
7.3 fps
HD Graphics (Bay Trail):
5.1 fps
HD Graphics (Bay Trail):
3.2 fps
HD Graphics (Bay Trail):
1.7 fps
HD Graphics (Bay Trail):
8.1 fps
HD Graphics (Bay Trail):
4.7 fps
HD Graphics (Bay Trail):
7 fps
HD Graphics (Bay Trail):
4.6 fps
HD Graphics (Bay Trail):
5.6 fps
HD Graphics (Bay Trail):
3.8 fps
HD Graphics (Bay Trail):
4.3 fps
HD Graphics (Bay Trail):
2.4 fps
HD Graphics (Bay Trail):
9.6 11.5 ~ 11 fps
HD Graphics (Bay Trail):
4.3 fps
HD Graphics (Bay Trail):
12 14 ~ 13 fps
HD Graphics (Bay Trail):
12 fps
HD Graphics (Bay Trail):
5.2 fps
HD Graphics (Bay Trail):
3.6 fps
HD Graphics (Bay Trail):
3.7 fps
HD Graphics (Bay Trail):
2.5 fps
HD Graphics (Bay Trail):
9.1 fps
HD Graphics (Bay Trail):
5.1 fps
HD Graphics (Bay Trail):
8.5 fps
HD Graphics (Bay Trail):
6.1 fps
HD Graphics (Bay Trail):
12.4 fps
HD Graphics (Bay Trail):
8.5 fps
HD Graphics (Bay Trail):
53.7 56 ~ 55 fps
HD Graphics (Bay Trail):
6.6 7 ~ 7 fps
HD Graphics (Bay Trail):
8.4 fps
HD Graphics (Bay Trail):
5.9 fps
HD Graphics (Bay Trail):
31.6 41.8 ~ 37 fps
HD Graphics (Bay Trail):
12.5 12.5 ~ 13 fps
HD Graphics (Bay Trail):
8.3 fps
HD Graphics (Bay Trail):
4.6 fps
HD Graphics (Bay Trail):
11.1 fps
HD Graphics (Bay Trail):
9.6 fps
HD Graphics (Bay Trail):
25.2 fps
HD Graphics (Bay Trail):
9.2 fps
HD Graphics (Bay Trail):
3.1 [X] Medion Akoya S6213T MD98716 Intel Pentium N3530 2.2GHz
HD Graphics (Bay Trail)
5.1 ~ 4 fps
HD Graphics (Bay Trail):
3.3 fps
HD Graphics (Bay Trail):
8.7 fps
HD Graphics (Bay Trail):
5.8 fps
HD Graphics (Bay Trail):
12.8 fps
HD Graphics (Bay Trail):
6 fps
HD Graphics (Bay Trail):
7.3 fps
HD Graphics (Bay Trail):
14 fps
HD Graphics (Bay Trail):
8 fps
HD Graphics (Bay Trail):
12 fps
HD Graphics (Bay Trail):
12.6 18.7 19.9 29.8 33.6 60 [X] Medion Akoya P2211T MD98602 Intel Celeron N2910 1.6GHz
HD Graphics (Bay Trail)
~ 29 fps
HD Graphics (Bay Trail):
10.5 19.5 33 [X] Medion Akoya P2211T MD98602 Intel Celeron N2910 1.6GHz
HD Graphics (Bay Trail)
~ 21 fps
HD Graphics (Bay Trail):
7.8 12.8 22 [X] Medion Akoya P2211T MD98602 Intel Celeron N2910 1.6GHz
HD Graphics (Bay Trail)
~ 14 fps
HD Graphics (Bay Trail):
7.7 fps
HD Graphics (Bay Trail):
6.3 fps
HD Graphics (Bay Trail):
10.2 fps
HD Graphics (Bay Trail):
6.1 fps
HD Graphics (Bay Trail):
11 fps
HD Graphics (Bay Trail):
7.8 fps
HD Graphics (Bay Trail):
18.2 [X] Medion Akoya P2211T MD98602 Intel Celeron N2910 1.6GHz
HD Graphics (Bay Trail)
20.8 28.4 31.9 [X] Asus Transformer Book T200TA PL Intel Atom Z3775 1.5GHz
HD Graphics (Bay Trail)
~ 25 fps
HD Graphics (Bay Trail):
9.5 [X] Medion Akoya P2211T MD98602 Intel Celeron N2910 1.6GHz
HD Graphics (Bay Trail)
10.4 13.7 19.4 [X] Asus Transformer Book T200TA PL Intel Atom Z3775 1.5GHz
HD Graphics (Bay Trail)
~ 13 fps
HD Graphics (Bay Trail):
4.4 [X] Medion Akoya E6239T Intel Pentium N3510 2GHz
HD Graphics (Bay Trail)
fps
HD Graphics (Bay Trail):
14.1 16.2 17.9 20.4 [X] Medion Akoya E6239T Intel Pentium N3510 2GHz
HD Graphics (Bay Trail)
23.2 ~ 18 fps
HD Graphics (Bay Trail):
12.5 12.6 [X] Medion Akoya E6239T Intel Pentium N3510 2GHz
HD Graphics (Bay Trail)
~ 13 fps
HD Graphics (Bay Trail):
5 fps
HD Graphics (Bay Trail):
1.2 fps
HD Graphics (Bay Trail):
39 56.2 69 [X] Baytrail Reference Tablet Intel Atom Z3770 1.5GHz
HD Graphics (Bay Trail)
~ 55 fps
HD Graphics (Bay Trail):
12.3 12.8 14 [X] Baytrail Reference Tablet Intel Atom Z3770 1.5GHz
HD Graphics (Bay Trail)
min:
8 fps
~ 13 fps
HD Graphics (Bay Trail):
0.3 fps
HD Graphics (Bay Trail):
15.1 23.6 ~ 19 fps
HD Graphics (Bay Trail):
5.2 9.7 ~ 7 fps
HD Graphics (Bay Trail):
10.3 fps
HD Graphics (Bay Trail):
6.2 fps
HD Graphics (Bay Trail):
10.1 fps
HD Graphics (Bay Trail):
6 fps
HD Graphics (Bay Trail):
12.4 fps
HD Graphics (Bay Trail):
7.3 fps
HD Graphics (Bay Trail):
12.5 14.3 ~ 13 fps
HD Graphics (Bay Trail):
9.8 11.2 ~ 11 fps
HD Graphics (Bay Trail):
42 fps
HD Graphics (Bay Trail):
26.1 [X] Intel NUC Kit DN2820FYKH Intel Celeron N2820 2.2GHz
HD Graphics (Bay Trail)
min:
16 fps, max:
38 fps
46.6 ~ 36 fps
HD Graphics (Bay Trail):
20 [X] Intel NUC Kit DN2820FYKH Intel Celeron N2820 2.2GHz
HD Graphics (Bay Trail)
min:
13 fps, max:
29 fps
23.9 ~ 22 fps
HD Graphics (Bay Trail):
12.9 13.2 ~ 13 fps
HD Graphics (Bay Trail):
7.5 8.1 ~ 8 fps
HD Graphics (Bay Trail):
28 fps
HD Graphics (Bay Trail):
9.2 10.7 14.8 15.6 16.5 [X] Medion Akoya P2214T MD 99430 Intel Celeron N2940 1.8GHz
HD Graphics (Bay Trail)
18.4 19.3 [X] Intel NUC Kit DN2820FYKH Intel Celeron N2820 2.2GHz
HD Graphics (Bay Trail)
min:
14 fps, max:
23 fps
~ 15 fps
HD Graphics (Bay Trail):
6 9.5 [X] Medion Akoya P2214T MD 99430 Intel Celeron N2940 1.8GHz
HD Graphics (Bay Trail)
10.3 11.4 12 ~ 10 fps
HD Graphics (Bay Trail):
7.9 [X] Medion Akoya P2214T MD 99430 Intel Celeron N2940 1.8GHz
HD Graphics (Bay Trail)
9.6 ~ 9 fps
HD Graphics (Bay Trail):
5 [X] Medion Akoya P2214T MD 99430 Intel Celeron N2940 1.8GHz
HD Graphics (Bay Trail)
5.9 ~ 5 fps
HD Graphics (Bay Trail):
8.5 12.4 ~ 10 fps
HD Graphics (Bay Trail):
8.1 fps
HD Graphics (Bay Trail):
5.8 fps
HD Graphics (Bay Trail):
2.3 fps
HD Graphics (Bay Trail):
1.1 fps
HD Graphics (Bay Trail):
11 11.8 ~ 11 fps
HD Graphics (Bay Trail):
10 fps
HD Graphics (Bay Trail):
8 fps
HD Graphics (Bay Trail):
4.8 fps
HD Graphics (Bay Trail):
19.7 fps
HD Graphics (Bay Trail):
24.1 36.9 ~ 31 fps
HD Graphics (Bay Trail):
12.9 13.3 ~ 13 fps
HD Graphics (Bay Trail):
9.3 fps
HD Graphics (Bay Trail):
5 10.5 [X] Asus Transformer Book T200TA PL Intel Atom Z3775 1.5GHz
HD Graphics (Bay Trail)
~ 8 fps
HD Graphics (Bay Trail):
5.6 [X] Asus Transformer Book T200TA PL Intel Atom Z3775 1.5GHz
HD Graphics (Bay Trail)
fps
HD Graphics (Bay Trail):
3.7 [X] Asus Transformer Book T200TA PL Intel Atom Z3775 1.5GHz
HD Graphics (Bay Trail)
fps
HD Graphics (Bay Trail):
6 9 9 ~ 8 fps
HD Graphics (Bay Trail):
3 fps
HD Graphics (Bay Trail):
12 [X] Asus Transformer Book T200TA PL Intel Atom Z3775 1.5GHz
HD Graphics (Bay Trail)
fps
HD Graphics (Bay Trail):
9 [X] Asus Transformer Book T200TA PL Intel Atom Z3775 1.5GHz
HD Graphics (Bay Trail)
fps
HD Graphics (Bay Trail):
12.8 fps
HD Graphics (Bay Trail):
9 fps
HD Graphics (Bay Trail):
10.3 14 [X] Medion Akoya E1232T-MD99410 Intel Celeron N2807 1.6GHz
HD Graphics (Bay Trail)
17.7 18 18.1 18.1 18.7 18.8 [X] Captiva PAD 10.1 Windows Intel Atom Z3735D 1.3GHz
HD Graphics (Bay Trail)
19.3 19.4 19.4 19.8 19.8 20.5 20.5 [X] cmx WinTek 101-1016 Intel Atom Z3735F 1.3GHz
HD Graphics (Bay Trail)
20.6 21 [X] ODYS Winpad V10 Intel Atom Z3735F 1.3GHz
HD Graphics (Bay Trail)
21.5 23.6 ~ 19 fps
HD Graphics (Bay Trail):
6.4 [X] Captiva PAD 10.1 Windows Intel Atom Z3735D 1.3GHz
HD Graphics (Bay Trail)
7.7 ~ 7 fps
HD Graphics (Bay Trail):
18.9 19 ~ 19 fps
HD Graphics (Bay Trail):
7.6 8.7 ~ 8 fps
HD Graphics (Bay Trail):
33 33 35 38 [X] MSI S100 Intel Atom Z3740D 1.3GHz
HD Graphics (Bay Trail)
44 46.2 47 48 49 49 [X] Intel NUC Kit DN2820FYKH Intel Celeron N2820 2.2GHz
HD Graphics (Bay Trail)
min:
39 fps, max:
59 fps
50 [X] Baytrail Reference Tablet Intel Atom Z3770 1.5GHz
HD Graphics (Bay Trail)
min:
36 fps
52 ~ 44 fps
HD Graphics (Bay Trail):
9.6 [X] Intel NUC Kit DN2820FYKH Intel Celeron N2820 2.2GHz
HD Graphics (Bay Trail)
min:
3 fps, max:
13 fps
11.5 [X] Baytrail Reference Tablet Intel Atom Z3770 1.5GHz
HD Graphics (Bay Trail)
min:
8 fps
20 22 23 25.3 26 26 28 [X] MSI S100 Intel Atom Z3740D 1.3GHz
HD Graphics (Bay Trail)
34 ~ 23 fps
HD Graphics (Bay Trail):
12 12 13.5 ~ 13 fps
HD Graphics (Bay Trail):
5.6 7 ~ 6 fps
HD Graphics (Bay Trail):
190 [X] Baytrail Reference Tablet Intel Atom Z3770 1.5GHz
HD Graphics (Bay Trail)
fps
Average Gaming Intel UHD Graphics Xe 750 32EUs (Rocket Lake) → 100% Average Gaming 30-70 fps → 100%
Average Gaming Intel HD Graphics (Bay Trail) → 20% Intel UHD Graphics Xe 750 32EUs (Rocket Lake) low med. high ultra QHD 4K F1 22 21.1 18.8 God of War 12.9 Valorant 198.3 64.1 50.8 36.1 Metro Exodus 24 10.6 7.74 Strange Brigade 38 15 12 13.2 X-Plane 11.11 16 15 14 Final Fantasy XV Benchmark 18 9 6 6 3.48 Dota 2 Reborn 102 61 30 27 12.4 GTA V 36.8 34.1 < 30 fps < 60 fps < 120 fps ≥ 120 fps 5 2 1 1 5 1 2 4 2 2 1 1 2
For more games that might be playable and a list of all games and graphics cards visit our Gaming List
v1.28
log 04. 06:07:10
#0 checking url part for id 10943 +0s ... 0s
#1 checking url part for id 4922 +0s ... 0s
#2 redirected to Ajax server, took 1720066030 +0s ... 0s
#3 did not recreate cache, as it is less than 5 days old! Created at Thu, 04 Jul 2024 05:15:44 +0200 +0s ... 0s
#4 composed specs +0.005s ... 0.006s
#5 did output specs +0s ... 0.006s
#6 start showIntegratedCPUs +0s ... 0.006s
#7 getting avg benchmarks for device 10943 +0.024s ... 0.03s
#8 got single benchmarks 10943 +0.006s ... 0.036s
#9 getting avg benchmarks for device 4922 +0.003s ... 0.039s
#10 got single benchmarks 4922 +0.049s ... 0.088s
#11 got avg benchmarks for devices +0s ... 0.088s
#12 min, max, avg, median took s +0.034s ... 0.123s
#13 before gaming benchmark output +0s ... 0.123s
#14 Got 469 rows for game benchmarks. +0.037s ... 0.16s
#15 composed SQL query for gamebenchmarks +0s ... 0.16s
#16 got data and put it in $dataArray +0.003s ... 0.163s
#17 benchmarks composed for output. +0.024s ... 0.188s
#18 calculated avg scores. +0s ... 0.188s
#19 return log +0.002s ... 0.19s
Please share our article, every link counts!
Redaktion, 2017-09- 8 (Update: 2023-07- 1)
 Deutsch
 English
 Español
 Français
 Italiano
 Nederlands
 Polski
 Português
 Русский
 Türkçe
 Svenska
 Chinese
 Magyar