Intel UHD Graphics Xe 750 32EUs (Rocket Lake) vs Intel HD Graphics 5000
Intel UHD Graphics Xe 750 32EUs (Rocket Lake) ► remove from comparison
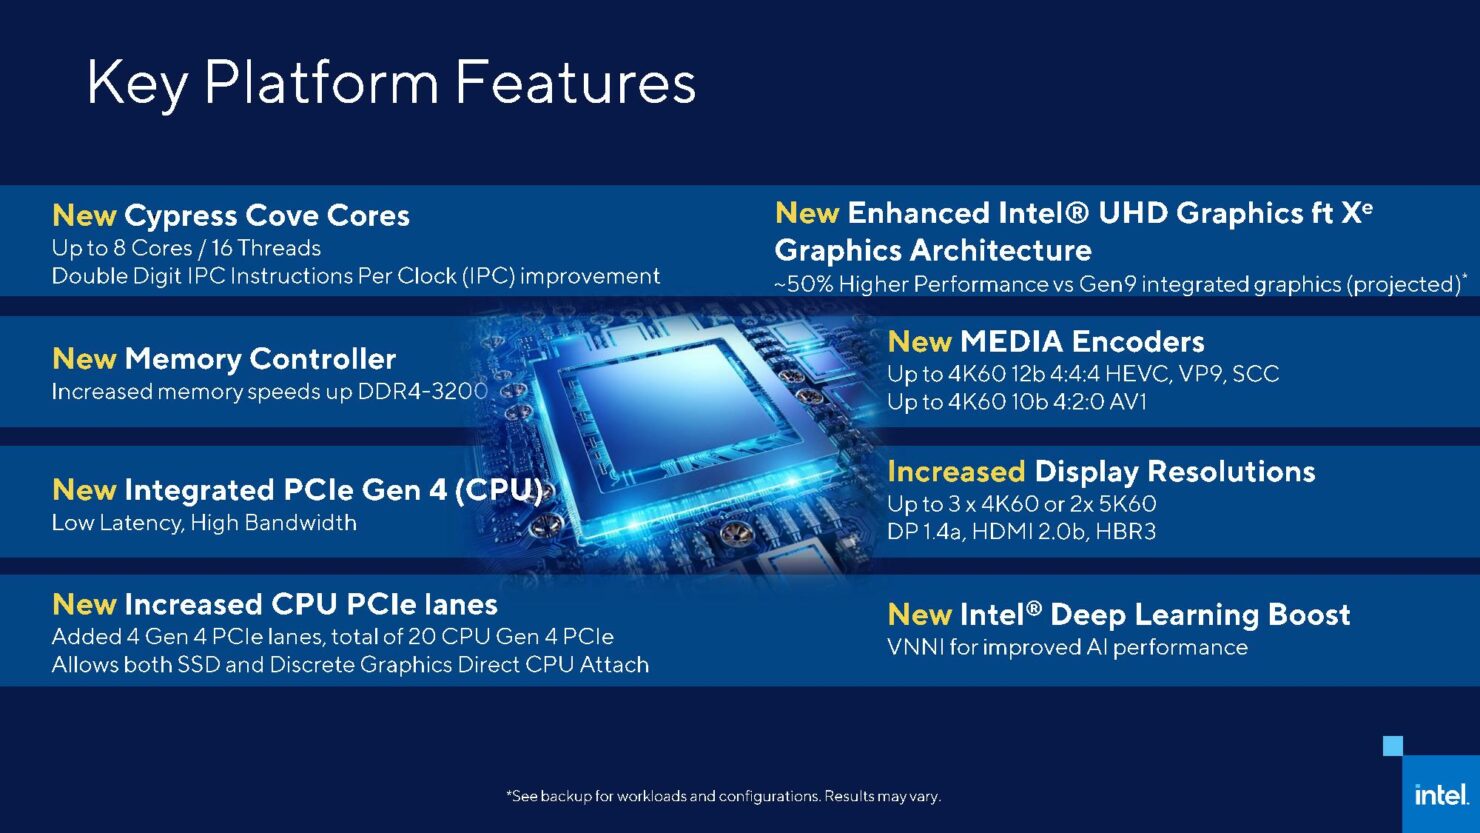
The Intel UHD Graphics Xe 750 (Rocket-Lake GPU with 32 EUs) is a integrated graphics card in the high end Rocket-Lake CPUs. It is using the new Xe architecture (Gen12) and was announced in March 2021.
Compared to the previous generation of UHD Graphics ,the Xe architecture and the improved shader count lead to a big leap in graphics performance. Still, the UHD 750 is only suited for low demanding games or very low settings. The 48 EU version in Tiger Lake SoCs e.g. reached 46 fps in The Witcher 3 low 1024x768 and no fluent framerates in Mafia Definitive Edition.
The Rocket Lake SoCs and therefore the integrated GPU are manufactured in the old 14nm+++ process at Intel.
Intel HD Graphics 5000 ► remove from comparison
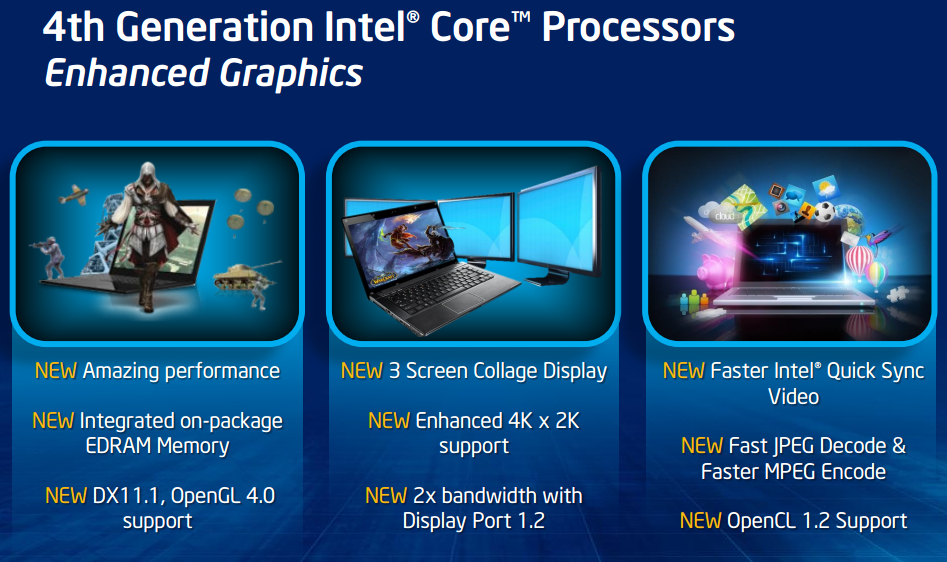
The Intel HD Graphics 5000 (GT3) is a processor graphics card included in some of the ULV Haswell processors of 2013 (e.g. Core i5-4250U ). It represents the highest configuration of the integrated graphics unit (40 execution units), but lacks the additional eDRAM cache of the Iris Pro Graphics 5200 . The relatively low base clock can be automatically overclocked using Turbo Boost technology. Depending on the processor model, the base and turbo clock rates may differ, resulting in varying graphics performance between CPU models.
In comparison to the HD 4000, the graphics core has been modified extensively. The GPU supports DirectX 11.1, OpenCL 1.2 and OpenGL 4.0. It also features an improved decoder for 4K videos and the fast Quick Sync encoder.
According to benchmarks in 3DMark 11, the HD Graphics 5000 is up to 50 percent faster than the previous HD 4000 . In games, however, the performance advantage is significantly lower. With simultaneous load on the CPU, the low TDP of the ULV models (15 W) limits the Turbo Boost of the GPU. Although the HD 5000 features 40 Execution Units, the graphics performance is still somewhat below the HD Graphics 4600 with only 20 EUs (HD 4000 : 16 EUs). Overall, the HD 5000 is thus just behind the AMD Radeon HD 7660G and at the level of a dedicated Radeon HD 7650M . Current games (as of 2013) will run fluently in low to medium-low settings.
Due to the 22nm 3D Tri-Gate production process, power consumption is relatively low. The HD Graphics 5000 is available on certain ULV dual-core Haswell models in the 15 Watt TDP range.
Intel UHD Graphics Xe 750 32EUs (Rocket Lake) Intel HD Graphics 5000 HD Graphics Series Codename Rocket Lake Xe Haswell GT3 Architecture Gen. 12 Gen. 7.5 Haswell Pipelines 32 - unified 40 - unified Core Speed 350 - 1450 (Boost) MHz 200 - 1100 (Boost) MHz Shared Memory yes yes API DirectX 12_1, OpenGL 4.6 DirectX 11.1, Shader 5.0, OpenGL 4.0 technology 14 nm 22 nm Features QuickSync QuickSync Date of Announcement 30.03.2021 05.06.2013 Memory Bus Width 64/128 Bit
CPU in UHD Graphics Xe 750 32EUs GPU Base Speed GPU Boost / Turbo Intel Core i9-11900K 8 x 3500 MHz, 125 W 350 MHz 1300 MHz Intel Core i7-11700K 8 x 3600 MHz, 125 W 350 MHz 1300 MHz Intel Core i5-11600K 6 x 3900 MHz, 125 W 350 MHz 1300 MHz » show 2 more Intel Core i3-N300 8 x ? MHz, 7 W ? MHz 1250 MHz Intel Processor N200 4 x 1000 MHz, 6 W 450 MHz 750 MHz min. - max. 450 MHz 750 - 1300 MHz
CPU in HD Graphics 5000 GPU Base Speed GPU Boost / Turbo Intel Core i7-4650U 2 x 1700 MHz, 15 W 200 MHz 1100 MHz Intel Core i7-4550U 2 x 1500 MHz, 15 W 200 MHz 1100 MHz Intel Core i5-4360U 2 x 1500 MHz, 15 W 200 MHz 1100 MHz » show 3 more Intel Core i5-4350U 2 x 1400 MHz, 15 W 200 MHz 1100 MHz Intel Core i5-4260U 2 x 1400 MHz, 15 W 200 MHz 1000 MHz Intel Core i5-4250U 2 x 1300 MHz, 15 W 200 MHz 1000 MHz min. - max. 200 - 450 MHz 750 - 1300 MHz
Benchmarks Performance Rating - 3DMark 11 + Fire Strike + Time Spy - UHD Graphics Xe 750 32EUs
1 pt (3%)
...
Intel UHD Graphics Xe 750 32EUs (Rocket Lake)
...
max:
Performance Rating - 3DMark 11 + Fire Strike + Time Spy - HD Graphics 5000
0.3 pt (1%)
...
...
max:
3DMark - 3DMark Time Spy Score
min: 383 avg: 622 median: 735 (2%) max: 747 Points
3DMark - 3DMark Time Spy Graphics
min: 342 avg: 539 median: 634 (2%) max: 642 Points
3DMark - 3DMark Ice Storm Unlimited Graphics
50628 Points (6%)
65904 Points (7%)
3DMark - 3DMark Ice Storm Extreme Graphics
min: 25463 avg: 29673 median: 29673 (4%) max: 33883 Points
37346 Points (5%)
3DMark - 3DMark Cloud Gate Score
min: 5545 avg: 10811 median: 12119 (13%) max: 13460 Points
min: 4331 avg: 4586 median: 4496.5 (5%) max: 5059 Points
3DMark - 3DMark Cloud Gate Graphics
min: 7604 avg: 10689 median: 11315 (3%) max: 12523 Points
min: 5381 avg: 5981 median: 5693.5 (1%) max: 6762 Points
3DMark - 3DMark Fire Strike Standard Score
min: 1024 avg: 1860 median: 2094 (4%) max: 2227 Points
min: 583 avg: 669 median: 651 (1%) max: 808 Points
3DMark - 3DMark Fire Strike Standard Graphics
min: 1144 avg: 1955 median: 2174.5 (2%) max: 2327 Points
min: 620 avg: 725 median: 715.5 (1%) max: 875 Points
3DMark - 3DMark Ice Storm Graphics
min: 35756 avg: 39116 median: 38682.5 (5%) max: 43344 Points
min: 35584 avg: 41867 median: 40454 (5%) max: 52302 Points
3DMark - 3DMark Wild Life Unlimited
2660 Points (1%)
3DMark - 3DMark Wild Life Extreme Unlimited
732 Points (1%)
3DMark - 3DMark Night Raid
3692 Points (3%)
3DMark - 3DMark Night Raid Graphics Score
4435 Points (2%)
3DMark 11 - 3DM11 Performance Score
min: 1407 avg: 2653 median: 3264 (5%) max: 3289 Points
min: 962 avg: 1088 median: 1125.5 (2%) max: 1163 Points
3DMark 11 - 3DM11 Performance GPU
min: 1349 avg: 2328 median: 2811 (2%) max: 2824 Points
min: 859 avg: 993 median: 1033.5 (1%) max: 1072 Points
3DMark Vantage + Intel UHD Graphics Xe 750 32EUs (Rocket Lake) 3DMark Vantage - 3DM Vant. Perf. total
5134 Points (1%)
3DM Vant. Perf. total + Intel HD Graphics 5000
min: 3418 avg: 4231 median: 4276.5 (1%) max: 4734 Points
3DM Vant. Perf. GPU no PhysX + Intel UHD Graphics Xe 750 32EUs (Rocket Lake) 3DMark Vantage - 3DM Vant. Perf. GPU no PhysX
4452 Points (3%)
3DM Vant. Perf. GPU no PhysX + Intel HD Graphics 5000
min: 2917 avg: 3639 median: 3665 (2%) max: 4108 Points
3DMark 03 - 3DMark 03 - Standard
min: 15752 avg: 18768 median: 18768 (10%) max: 21784 Points
3DMark 05 - 3DMark 05 - Standard
8935 Points (10%)
min: 9623 avg: 9763 median: 9763 (11%) max: 9903 Points
3DMark 06 3DMark 06 - Standard 1280x1024 + Intel UHD Graphics Xe 750 32EUs (Rocket Lake)
min: 8090 avg: 14361 median: 17392 (23%) max: 17601 Points
3DMark 06 - Standard 1280x1024 + Intel HD Graphics 5000
min: 4751 avg: 5775 median: 5940 (8%) max: 6160 Points
3DMark 06 - Standard 1280x800 + Intel HD Graphics 5000
6675 Points (9%)
Unigine Valley 1.0 - Unigine Valley 1.0 DX
3.5 fps (1%)
Unigine Heaven 3.0 - Unigine Heaven 3.0 DX 11
12.1 fps (4%)
Unigine Heaven 3.0 - Unigine Heaven 3.0 OpenGL
12.1 fps (5%)
Unigine Heaven 2.1 - Heaven 2.1 high
min: 12.3 avg: 13 median: 13.1 (2%) max: 13.5 fps
SPECviewperf 11 + Intel HD Graphics 5000 SPECviewperf 11 - specvp11 snx-01
min: 1.26 avg: 1.5 median: 1.5 (1%) max: 1.64 fps
specvp11 tcvis-02 + Intel HD Graphics 5000 SPECviewperf 11 - specvp11 tcvis-02
min: 1.77 avg: 2.1 median: 2.1 (1%) max: 2.51 fps
specvp11 sw-02 + Intel HD Graphics 5000 SPECviewperf 11 - specvp11 sw-02
min: 7.95 avg: 9.9 median: 9.9 (8%) max: 11.8 fps
specvp11 proe-05 + Intel HD Graphics 5000 SPECviewperf 11 - specvp11 proe-05
min: 1.42 avg: 1.6 median: 1.6 (2%) max: 1.78 fps
specvp11 maya-03 + Intel HD Graphics 5000 SPECviewperf 11 - specvp11 maya-03
min: 12.95 avg: 14.2 median: 14.2 (11%) max: 15.43 fps
specvp11 lightwave-01 + Intel HD Graphics 5000 SPECviewperf 11 - specvp11 lightwave-01
min: 13.34 avg: 14.5 median: 14.5 (16%) max: 15.62 fps
specvp11 ensight-04 + Intel HD Graphics 5000 SPECviewperf 11 - specvp11 ensight-04
min: 2.06 avg: 2.1 median: 2.1 (1%) max: 2.11 fps
specvp11 catia-03 + Intel HD Graphics 5000 SPECviewperf 11 - specvp11 catia-03
4.5 fps (2%)
Windows 7 Experience Index - Win7 Gaming graphics
min: 6.5 avg: 6.6 median: 6.6 (84%) max: 6.7 Points
Windows 7 Experience Index - Win7 Graphics
min: 5.8 avg: 5.9 median: 5.9 (74%) max: 5.9 Points
Cinebench R10 Cinebench R10 Shading (32bit) + Intel UHD Graphics Xe 750 32EUs (Rocket Lake) Cinebench R10 - Cinebench R10 Shading (32bit)
6088 Points (4%)
Cinebench R10 Shading (32bit) + Intel HD Graphics 5000
min: 5143 avg: 6901 median: 6946.5 (5%) max: 7959 Points
Cinebench R11.5 Cinebench R11.5 OpenGL 64 Bit + Intel UHD Graphics Xe 750 32EUs (Rocket Lake) Cinebench R11.5 - Cinebench R11.5 OpenGL 64 Bit
min: 22.96 avg: 25.5 median: 25.5 (9%) max: 28.12 fps
Cinebench R11.5 OpenGL 64 Bit + Intel HD Graphics 5000
min: 15.01 avg: 19.6 median: 19.6 (7%) max: 24.76 fps
Cinebench R15 + Intel UHD Graphics Xe 750 32EUs (Rocket Lake) Cinebench R15 - Cinebench R15 OpenGL 64 Bit
min: 27.38 avg: 29.8 median: 28 (2%) max: 34.1 fps
Cinebench R15 OpenGL 64 Bit + Intel HD Graphics 5000
min: 24.15 avg: 27.4 median: 27.4 (2%) max: 30.64 fps
Cinebench R15 OpenGL Ref. Match 64 Bit + Intel UHD Graphics Xe 750 32EUs (Rocket Lake) Cinebench R15 - Cinebench R15 OpenGL Ref. Match 64 Bit
97.8 % (98%)
Cinebench R15 OpenGL Ref. Match 64 Bit + Intel HD Graphics 5000
min: 63.3 avg: 81.1 median: 80.7 (81%) max: 99.6 %
GFXBench 3.0 - GFXBench 3.0 Manhattan Offscreen
22.5 fps (1%)
GFXBench (DX / GLBenchmark) 2.7 + Intel HD Graphics 5000 GFXBench (DX / GLBenchmark) 2.7 - GFXBench T-Rex HD Offscreen C24Z16
min: 62 avg: 72.5 median: 72.5 (1%) max: 83 fps
Basemark GPU 1.2 - Basemark GPU 1.2 Vulkan Official Medium Offscreen 1080
31.7 fps (0%)
Basemark GPU 1.2 - Basemark GPU 1.2 Vulkan Official High Offscreen 2160
3 fps (1%)
Geekbench 6.2 - Geekbench 6.2 GPU OpenCL
2902 Points (1%)
Geekbench 6.2 - Geekbench 6.2 GPU Vulkan
3872 Points (1%)
LuxMark v2.0 64Bit - LuxMark v2.0 Room GPU
min: 129 avg: 336 median: 336 (2%) max: 543 Samples/s
min: 139 avg: 187 median: 201 (1%) max: 221 Samples/s
LuxMark v2.0 64Bit - LuxMark v2.0 Sala GPU
min: 369 avg: 742 median: 742 (1%) max: 1115 Samples/s
min: 286 avg: 305.3 median: 306 (1%) max: 324 Samples/s
ComputeMark v2.1 - ComputeMark v2.1 Result
min: 700 avg: 1024 median: 1024 (1%) max: 1348 Points
min: 775 avg: 817 median: 816.5 (1%) max: 858 Points
Power Consumption - Furmark Stress Test Power Consumption - external Monitor *
min: 14.2 avg: 44.8 median: 56.9 (8%) max: 63.4 Watt
Power Consumption - The Witcher 3 Power Consumption - external Monitor *
min: 70 avg: 86.4 median: 92.9 (13%) max: 96.2 Watt
Average Benchmarks Intel UHD Graphics Xe 750 32EUs (Rocket Lake) → 100% n=20 Average Benchmarks Intel HD Graphics 5000 → 72% n=20
- Range of benchmark values for this graphics card
- Average benchmark values for this graphics card
* Smaller numbers mean a higher performance
1 This benchmark is not used for the average calculation
Game Benchmarks The following benchmarks stem from our benchmarks of review laptops. The performance depends on the used graphics memory, clock rate, processor, system settings, drivers, and operating systems. So the results don't have to be representative for all laptops with this GPU. For detailed information on the benchmark results, click on the fps number.
100%
UHD Graphics Xe 750 32EUs:
21.1 [X] Asus ROG Maximus XIII Hero, Intel Xe 750 918016
Intel Core i9-11900K 3.5GHz
UHD Graphics Xe 750 32EUs
min:
18 fps, P1:
18 fps, max:
24 fps
fps
100%
UHD Graphics Xe 750 32EUs:
18.8 [X] Asus ROG Maximus XIII Hero, Intel Xe 750 918016
Intel Core i9-11900K 3.5GHz
UHD Graphics Xe 750 32EUs
min:
16 fps, P1:
16 fps, max:
21 fps
fps
100%
UHD Graphics Xe 750 32EUs:
12.9 (!) [X] Asus ROG Maximus XIII Hero, Intel Xe 750 Intel Core i9-11900K 3.5GHz
UHD Graphics Xe 750 32EUs
min:
7.82 fps, P0.1:
7.9 fps, P1:
8.9 fps, max:
26.4 fps
fps
100%
UHD Graphics Xe 750 32EUs:
198.3 [X] Asus ROG Maximus XIII Hero, Intel Xe 750 Intel Core i9-11900K 3.5GHz
UHD Graphics Xe 750 32EUs
min:
5.35 fps, P0.1:
75.2 fps, P1:
112.9 fps, max:
501 fps
fps
100%
UHD Graphics Xe 750 32EUs:
64.1 [X] Asus ROG Maximus XIII Hero, Intel Xe 750 Intel Core i9-11900K 3.5GHz
UHD Graphics Xe 750 32EUs
min:
5.06 fps, P0.1:
43.2 fps, P1:
48.2 fps, max:
163 fps
fps
100%
UHD Graphics Xe 750 32EUs:
50.8 [X] Asus ROG Maximus XIII Hero, Intel Xe 750 Intel Core i9-11900K 3.5GHz
UHD Graphics Xe 750 32EUs
min:
21.1 fps, P0.1:
37.3 fps, P1:
39 fps, max:
95.6 fps
fps
100%
UHD Graphics Xe 750 32EUs:
36.1 [X] Asus ROG Maximus XIII Hero, Intel Xe 750 Intel Core i9-11900K 3.5GHz
UHD Graphics Xe 750 32EUs
min:
27.9 fps, P0.1:
28.2 fps, P1:
28.9 fps, max:
46.8 fps
fps
100%
UHD Graphics Xe 750 32EUs:
24 [X] Intel Core i9-11900K Intel Core i9-11900K 3.5GHz
UHD Graphics Xe 750 32EUs
min:
14.19 fps, max:
36.89 fps
fps
100%
UHD Graphics Xe 750 32EUs:
10.6 [X] Intel Core i9-11900K Intel Core i9-11900K 3.5GHz
UHD Graphics Xe 750 32EUs
min:
5.39 fps, max:
15.76 fps
fps
100%
UHD Graphics Xe 750 32EUs:
7.7 [X] Intel Core i9-11900K Intel Core i9-11900K 3.5GHz
UHD Graphics Xe 750 32EUs
min:
3.83 fps, max:
11.85 fps
fps
100%
UHD Graphics Xe 750 32EUs:
25.2 51.1 [X] Intel Core i9-11900K 1.47.22.14 D3D12
Intel Core i9-11900K 3.5GHz
UHD Graphics Xe 750 32EUs
min:
10.4 fps, P1:
14.5 fps, max:
566 fps
~ 38 fps
100%
UHD Graphics Xe 750 32EUs:
10.1 19 [X] Intel Core i9-11900K 1.47.22.14 D3D12
Intel Core i9-11900K 3.5GHz
UHD Graphics Xe 750 32EUs
min:
5 fps, P1:
5 fps, max:
430 fps
~ 15 fps
100%
UHD Graphics Xe 750 32EUs:
9.2 15 [X] Intel Core i9-11900K 1.47.22.14 D3D12
Intel Core i9-11900K 3.5GHz
UHD Graphics Xe 750 32EUs
min:
5 fps, P1:
5 fps, max:
446 fps
~ 12 fps
100%
UHD Graphics Xe 750 32EUs:
13.2 [X] Intel Core i9-11900K 1.47.22.14 D3D12
Intel Core i9-11900K 3.5GHz
UHD Graphics Xe 750 32EUs
min:
5 fps, P1:
5 fps, max:
512 fps
fps
100%
UHD Graphics Xe 750 32EUs:
11.3 17.6 [X] Asus ROG Maximus XIII Hero, Intel Xe 750 Intel Core i5-11600K 3.9GHz
UHD Graphics Xe 750 32EUs
18.3 [X] Asus Maximus XIII Hero Intel Core i7-11700K 3.6GHz
UHD Graphics Xe 750 32EUs
~ 16 fps
100%
UHD Graphics Xe 750 32EUs:
8.5 17.3 [X] Asus Maximus XIII Hero Intel Core i7-11700K 3.6GHz
UHD Graphics Xe 750 32EUs
18.8 [X] Asus ROG Maximus XIII Hero, Intel Xe 750 Intel Core i5-11600K 3.9GHz
UHD Graphics Xe 750 32EUs
~ 15 fps
100%
UHD Graphics Xe 750 32EUs:
7.6 16.4 [X] Asus Maximus XIII Hero Intel Core i7-11700K 3.6GHz
UHD Graphics Xe 750 32EUs
18 [X] Asus ROG Maximus XIII Hero, Intel Xe 750 Intel Core i5-11600K 3.9GHz
UHD Graphics Xe 750 32EUs
~ 14 fps
100%
UHD Graphics Xe 750 32EUs:
5.9 23 [X] Intel Core i9-11900K 1.3
Intel Core i9-11900K 3.5GHz
UHD Graphics Xe 750 32EUs
23.6 [X] Asus ROG Maximus XIII Hero, Intel Xe 750 1.3
Intel Core i9-11900K 3.5GHz
UHD Graphics Xe 750 32EUs
~ 18 fps
100%
UHD Graphics Xe 750 32EUs:
3.5 12.3 [X] Asus ROG Maximus XIII Hero, Intel Xe 750 1.3
Intel Core i9-11900K 3.5GHz
UHD Graphics Xe 750 32EUs
12.4 [X] Intel Core i9-11900K 1.3
Intel Core i9-11900K 3.5GHz
UHD Graphics Xe 750 32EUs
~ 9 fps
100%
UHD Graphics Xe 750 32EUs:
2.5 8.4 [X] Asus ROG Maximus XIII Hero, Intel Xe 750 1.3
Intel Core i9-11900K 3.5GHz
UHD Graphics Xe 750 32EUs
8.5 [X] Intel Core i9-11900K 1.3
Intel Core i9-11900K 3.5GHz
UHD Graphics Xe 750 32EUs
~ 6 fps
100%
UHD Graphics Xe 750 32EUs:
6 [X] Asus ROG Maximus XIII Hero, Intel Xe 750 1.3
Intel Core i9-11900K 3.5GHz
UHD Graphics Xe 750 32EUs
fps
100%
UHD Graphics Xe 750 32EUs:
3.5 [X] Asus ROG Maximus XIII Hero, Intel Xe 750 1.3
Intel Core i9-11900K 3.5GHz
UHD Graphics Xe 750 32EUs
fps
100%
UHD Graphics Xe 750 32EUs:
35.1 84.8 [X] Intel Core i9-11900K Intel Core i9-11900K 3.5GHz
UHD Graphics Xe 750 32EUs
min:
31.6 fps, max:
-1 fps
126 [X] Asus ROG Maximus XIII Hero, Intel Xe 750 Intel Core i5-11600K 3.9GHz
UHD Graphics Xe 750 32EUs
min:
108.5 fps, max:
-1 fps
132 [X] Asus ROG Maximus XIII Hero, Intel Xe 750 Intel Core i9-11900K 3.5GHz
UHD Graphics Xe 750 32EUs
min:
109.7 fps, max:
-1 fps
133 [X] Asus Maximus XIII Hero Intel Core i7-11700K 3.6GHz
UHD Graphics Xe 750 32EUs
min:
107.7 fps, max:
-1 fps
~ 102 fps
100%
UHD Graphics Xe 750 32EUs:
20.6 60.3 [X] Intel Core i9-11900K Intel Core i9-11900K 3.5GHz
UHD Graphics Xe 750 32EUs
min:
29.5 fps, max:
-1 fps
73.8 [X] Asus ROG Maximus XIII Hero, Intel Xe 750 Intel Core i9-11900K 3.5GHz
UHD Graphics Xe 750 32EUs
min:
64.6 fps, max:
-1 fps
74.2 [X] Asus Maximus XIII Hero Intel Core i7-11700K 3.6GHz
UHD Graphics Xe 750 32EUs
min:
65.4 fps, max:
-1 fps
74.7 [X] Asus ROG Maximus XIII Hero, Intel Xe 750 Intel Core i5-11600K 3.9GHz
UHD Graphics Xe 750 32EUs
min:
66.1 fps, max:
-1 fps
~ 61 fps
100%
UHD Graphics Xe 750 32EUs:
10.9 32.6 [X] Intel Core i9-11900K Intel Core i9-11900K 3.5GHz
UHD Graphics Xe 750 32EUs
min:
7.8 fps, max:
-1 fps
34.9 [X] Asus ROG Maximus XIII Hero, Intel Xe 750 Intel Core i5-11600K 3.9GHz
UHD Graphics Xe 750 32EUs
min:
31.8 fps, max:
-1 fps
35.5 [X] Asus Maximus XIII Hero Intel Core i7-11700K 3.6GHz
UHD Graphics Xe 750 32EUs
min:
32.4 fps, max:
-1 fps
35.6 [X] Asus ROG Maximus XIII Hero, Intel Xe 750 Intel Core i9-11900K 3.5GHz
UHD Graphics Xe 750 32EUs
min:
32.3 fps, max:
-1 fps
~ 30 fps
100%
UHD Graphics Xe 750 32EUs:
9.9 30 [X] Intel Core i9-11900K Intel Core i9-11900K 3.5GHz
UHD Graphics Xe 750 32EUs
min:
11.4 fps, max:
-1 fps
31.9 [X] Asus ROG Maximus XIII Hero, Intel Xe 750 Intel Core i5-11600K 3.9GHz
UHD Graphics Xe 750 32EUs
min:
29.2 fps, max:
-1 fps
32.5 [X] Asus Maximus XIII Hero Intel Core i7-11700K 3.6GHz
UHD Graphics Xe 750 32EUs
min:
29.6 fps, max:
-1 fps
32.6 [X] Asus ROG Maximus XIII Hero, Intel Xe 750 Intel Core i9-11900K 3.5GHz
UHD Graphics Xe 750 32EUs
min:
29.7 fps, max:
-1 fps
~ 27 fps
100%
UHD Graphics Xe 750 32EUs:
12.4 [X] Asus ROG Maximus XIII Hero, Intel Xe 750 Intel Core i9-11900K 3.5GHz
UHD Graphics Xe 750 32EUs
min:
11.5 fps, max:
-1 fps
fps
100%
UHD Graphics Xe 750 32EUs:
36.8 fps
52%
HD Graphics 5000:
19.2 fps
100%
UHD Graphics Xe 750 32EUs:
34.1 fps
47%
HD Graphics 5000:
16 fps
HD Graphics 5000:
20.8 fps
HD Graphics 5000:
15.1 fps
HD Graphics 5000:
12.7 fps
HD Graphics 5000:
15.8 fps
HD Graphics 5000:
10.6 fps
HD Graphics 5000:
17.4 fps
HD Graphics 5000:
14.3 fps
HD Graphics 5000:
10.6 fps
HD Graphics 5000:
25.4 fps
HD Graphics 5000:
16.2 fps
HD Graphics 5000:
15.5 fps
HD Graphics 5000:
12.2 fps
HD Graphics 5000:
14.2 fps
HD Graphics 5000:
10.6 fps
HD Graphics 5000:
14.7 fps
HD Graphics 5000:
28.9 fps
HD Graphics 5000:
20.9 fps
HD Graphics 5000:
11.4 fps
HD Graphics 5000:
20.1 fps
HD Graphics 5000:
36.2 fps
HD Graphics 5000:
28.1 fps
HD Graphics 5000:
17.4 fps
HD Graphics 5000:
168.3 fps
HD Graphics 5000:
32.8 fps
HD Graphics 5000:
14.2 fps
HD Graphics 5000:
28.7 fps
HD Graphics 5000:
17.6 fps
HD Graphics 5000:
85.7 fps
HD Graphics 5000:
30.2 fps
HD Graphics 5000:
14.9 fps
HD Graphics 5000:
12.5 fps
HD Graphics 5000:
17 18.1 ~ 18 fps
HD Graphics 5000:
27.2 fps
HD Graphics 5000:
22.1 fps
HD Graphics 5000:
10.7 fps
HD Graphics 5000:
33.2 fps
HD Graphics 5000:
20.2 fps
HD Graphics 5000:
13.2 fps
HD Graphics 5000:
8.4 9.7 ~ 9 fps
HD Graphics 5000:
20.5 fps
HD Graphics 5000:
28.6 fps
HD Graphics 5000:
19.9 fps
HD Graphics 5000:
13.3 fps
HD Graphics 5000:
165.1 fps
HD Graphics 5000:
100.2 fps
HD Graphics 5000:
71.4 fps
HD Graphics 5000:
39.3 fps
HD Graphics 5000:
39.8 fps
HD Graphics 5000:
29.4 fps
HD Graphics 5000:
21.6 fps
HD Graphics 5000:
13.3 fps
HD Graphics 5000:
10.4 fps
HD Graphics 5000:
58.6 fps
HD Graphics 5000:
31.3 fps
HD Graphics 5000:
22.7 fps
HD Graphics 5000:
12.5 fps
HD Graphics 5000:
32 [X] Dell XPS 12 Haswell Intel Core i7-4650U 1.7GHz
HD Graphics 5000
34.3 34.3 38.3 ~ 35 fps
HD Graphics 5000:
17 [X] Dell XPS 12 Haswell Intel Core i7-4650U 1.7GHz
HD Graphics 5000
20.1 20.9 22.5 ~ 20 fps
HD Graphics 5000:
14 [X] Dell XPS 12 Haswell Intel Core i7-4650U 1.7GHz
HD Graphics 5000
14.2 16.6 18.2 ~ 16 fps
HD Graphics 5000:
44 [X] Dell XPS 12 Haswell Intel Core i7-4650U 1.7GHz
HD Graphics 5000
52.5 53.9 54.3 55.3 56 ~ 53 fps
HD Graphics 5000:
23 [X] Dell XPS 12 Haswell Intel Core i7-4650U 1.7GHz
HD Graphics 5000
25 26 27.5 28.3 28.6 ~ 26 fps
HD Graphics 5000:
14 14.9 15 [X] Dell XPS 12 Haswell Intel Core i7-4650U 1.7GHz
HD Graphics 5000
15.8 17.4 17.5 ~ 16 fps
HD Graphics 5000:
7.9 8 [X] Dell XPS 12 Haswell Intel Core i7-4650U 1.7GHz
HD Graphics 5000
9.5 ~ 8 fps
HD Graphics 5000:
20.9 fps
HD Graphics 5000:
28.6 fps
HD Graphics 5000:
19.2 fps
HD Graphics 5000:
16.6 fps
HD Graphics 5000:
11.2 fps
HD Graphics 5000:
22.3 fps
HD Graphics 5000:
15.7 fps
HD Graphics 5000:
40.5 fps
HD Graphics 5000:
14.1 fps
HD Graphics 5000:
54 58 59 [X] Dell XPS 12 Haswell Intel Core i7-4650U 1.7GHz
HD Graphics 5000
~ 57 fps
HD Graphics 5000:
38 [X] Dell XPS 12 Haswell Intel Core i7-4650U 1.7GHz
HD Graphics 5000
42 ~ 40 fps
HD Graphics 5000:
31 [X] Dell XPS 12 Haswell Intel Core i7-4650U 1.7GHz
HD Graphics 5000
32 ~ 32 fps
HD Graphics 5000:
13 19 21 [X] Dell XPS 12 Haswell Intel Core i7-4650U 1.7GHz
HD Graphics 5000
~ 18 fps
HD Graphics 5000:
57.8 59.2 61 [X] Dell XPS 12 Haswell Intel Core i7-4650U 1.7GHz
HD Graphics 5000
~ 59 fps
HD Graphics 5000:
30 [X] Dell XPS 12 Haswell Intel Core i7-4650U 1.7GHz
HD Graphics 5000
32.2 32.8 ~ 32 fps
HD Graphics 5000:
16.2 18 [X] Dell XPS 12 Haswell Intel Core i7-4650U 1.7GHz
HD Graphics 5000
20.1 ~ 18 fps
HD Graphics 5000:
9 [X] Dell XPS 12 Haswell Intel Core i7-4650U 1.7GHz
HD Graphics 5000
fps
HD Graphics 5000:
29.5 fps
HD Graphics 5000:
18.4 fps
HD Graphics 5000:
11.6 fps
HD Graphics 5000:
88.8 fps
HD Graphics 5000:
126 169 [X] Dell XPS 12 Haswell Intel Core i7-4650U 1.7GHz
HD Graphics 5000
~ 148 fps
HD Graphics 5000:
38 43 [X] Dell XPS 12 Haswell Intel Core i7-4650U 1.7GHz
HD Graphics 5000
~ 41 fps
HD Graphics 5000:
24 26 [X] Dell XPS 12 Haswell Intel Core i7-4650U 1.7GHz
HD Graphics 5000
~ 25 fps
HD Graphics 5000:
10 16 [X] Dell XPS 12 Haswell Intel Core i7-4650U 1.7GHz
HD Graphics 5000
~ 13 fps
Average Gaming Intel UHD Graphics Xe 750 32EUs (Rocket Lake) → 100% Average Gaming 30-70 fps → 100%
Average Gaming Intel HD Graphics 5000 → 50% Intel UHD Graphics Xe 750 32EUs (Rocket Lake) low med. high ultra QHD 4K F1 22 21.1 18.8 God of War 12.9 Valorant 198.3 64.1 50.8 36.1 Metro Exodus 24 10.6 7.74 Strange Brigade 38 15 12 13.2 X-Plane 11.11 16 15 14 Final Fantasy XV Benchmark 18 9 6 6 3.48 Dota 2 Reborn 102 61 30 27 12.4 GTA V 36.8 34.1 < 30 fps < 60 fps < 120 fps ≥ 120 fps 5 2 1 1 5 1 2 4 2 2 1 1 2
For more games that might be playable and a list of all games and graphics cards visit our Gaming List
v1.28
log 04. 06:45:26
#0 checking url part for id 10943 +0s ... 0s
#1 checking url part for id 4574 +0s ... 0s
#2 redirected to Ajax server, took 1720068326 +0s ... 0s
#3 did not recreate cache, as it is less than 5 days old! Created at Thu, 04 Jul 2024 05:15:44 +0200 +0s ... 0s
#4 composed specs +0.03s ... 0.03s
#5 did output specs +0s ... 0.03s
#6 start showIntegratedCPUs +0s ... 0.03s
#7 getting avg benchmarks for device 10943 +0.014s ... 0.044s
#8 got single benchmarks 10943 +0.007s ... 0.05s
#9 getting avg benchmarks for device 4574 +0.003s ... 0.053s
#10 got single benchmarks 4574 +0.001s ... 0.055s
#11 got avg benchmarks for devices +0s ... 0.055s
#12 min, max, avg, median took s +0.025s ... 0.079s
#13 before gaming benchmark output +0s ... 0.079s
#14 Got 257 rows for game benchmarks. +0.012s ... 0.091s
#15 composed SQL query for gamebenchmarks +0s ... 0.091s
#16 got data and put it in $dataArray +0.003s ... 0.094s
#17 benchmarks composed for output. +0.017s ... 0.111s
#18 calculated avg scores. +0s ... 0.111s
#19 return log +0.028s ... 0.138s
Please share our article, every link counts!
Redaktion, 2017-09- 8 (Update: 2023-07- 1)
 Deutsch
 English
 Español
 Français
 Italiano
 Nederlands
 Polski
 Português
 Русский
 Türkçe
 Svenska
 Chinese
 Magyar