Notebookcheck Logo

Intel UHD Graphics Xe 750 32EUs (Rocket Lake) vs NVIDIA GeForce GTX 675M SLI

Intel UHD Graphics Xe 750 32EUs (Rocket Lake)

► remove from comparison Intel UHD Graphics Xe 750 32EUs

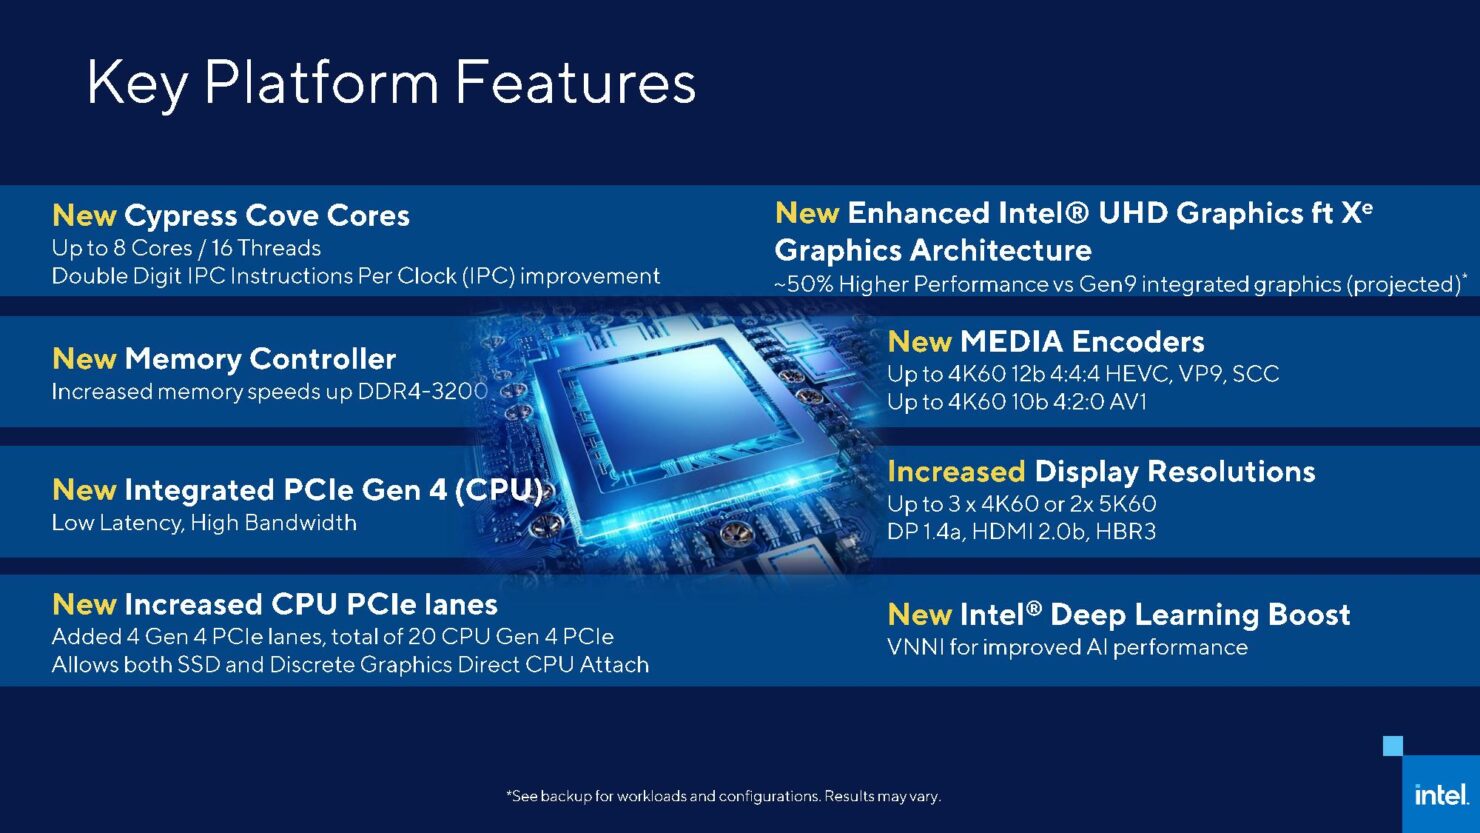
The Intel UHD Graphics Xe 750 (Rocket-Lake GPU with 32 EUs) is a integrated graphics card in the high end Rocket-Lake CPUs. It is using the new Xe architecture (Gen12) and was announced in March 2021.

Compared to the previous generation of UHD Graphics ,the Xe architecture and the improved shader count lead to a big leap in graphics performance. Still, the UHD 750 is only suited for low demanding games or very low settings. The 48 EU version in Tiger Lake SoCs e.g. reached 46 fps in The Witcher 3 low 1024x768 and no fluent framerates in Mafia Definitive Edition.

The Rocket Lake SoCs and therefore the integrated GPU are manufactured in the old 14nm+++ process at Intel.

NVIDIA GeForce GTX 675M SLI

► remove from comparison NVIDIA GeForce GTX 675M SLI

The NVIDIA GeForce GTX 675M SLI is a high-end graphics solution for laptops based on the two GTX 675M graphic cards in SLI mode. With SLI, each card usually renders a single frame (AFR mode). Therefore, it may suffer from micro stuttering in low fps ranges of 30fps. This happens because of different timespans between two frames (e.g., irregular delays between sequential frames).

The GeForce GTX 675M SLI supports the same features as a single GTX 675M card. Therefore, it supports DirectX 11 and is produced in a 40nm fabrication process at TSMC. Technically, the GTX 675M (SLI) is completely identical to the GTX 580M (SLI).

GF114 architecture

The GF114 core is a power-optimized version of the GF104 (used in the GTX 485M), but with no architectural changes. Therefore, the performance per MHz stays the same. Nvidia, however, was able to clock the shaders higher while still remaining in the same power envelope. The GTX 675M offers all 384 shader cores in the GF114. More information on the similar GF104 architecture can be found on the GeForce GTX 485M page.

Performance

Due to the higher clock speeds, the GeForce GTX 675M SLI is faster than the GTX 485M SLI an as fast as the GTX 580M SLI. Demanding games like Crysis 2, Witcher 2, Dirt 3 or even Metro 2033 can be played in 1920x1080 with maximum details and most Antialiasing features enabled.

Features

Similar to the older GF104 chip, the GF114 also supports Bitstream HD Audio (Blu-Ray) output via HDMI. That means it can transfer, for example, Dolby True HD or DTS-HD bitstream without quality loss to a HiFi receiver.

The GTX 675M offers the PureVideo HD technology for video decoding. The included Video Processor 4 (VP4) supports feature set C and is therefore able to fully decode MPEG-1, MPEG-2, MPEG-4 Part 2 (MPEG-4 ASP - e.g., DivX or Xvid), VC-1/WMV9, and H.264 (VLD, IDCT, Motion Compensation, and Deblocking). 

Furthermore, the GPU is able to decode two 1080p streams simultaneously (e.g. for Blu-Ray Picture-in-Picture).

Through CUDA, OpenCL, and DirectCompute 2.1 support, the GeForce GTX 675M can be of help in general calculations. For example, the stream processor can encode videos considerably faster than can a fast CPU. Furthermore, physics calculations can be done by the GPU using PhysX (e.g., supported by Mafia 2 or Metro 2033). As two 675M are used for the SLI combination, one card alone can be used for PhysX and the other for rendering the game graphics.

3D Vision enables the laptop to send 3D content (3D games, 3D Web Streaming, 3D photos, 3D Blu-Rays) to a built-in 3D enabled screen or an external 3D TV (only if supported by the laptop manufacturer).

The power consumption of the GeForce GTX 675M is in the same region as the old GTX 580M, which is supposedly about 100 Watt (TDP including the MXM board and memory). Therefore, the SLI system needs up to 200 Watt using both cards. Without load, the performance is clocked at 50/100 MHz (chip/shader) in 2D mode and 200/400 in 3D mode to save power. Furthermore, a single card can be deactivated to save power.

The similar desktop GeForce GTX 580 is based on the GF110 chip and much faster in comparison. Therefore, the 675M is more closely related to the GeForce GTX 560Ti, the latter of which is still faster due to higher clock speeds.

Intel UHD Graphics Xe 750 32EUs (Rocket Lake)NVIDIA GeForce GTX 675M SLI
GeForce GTX 600M Series
Iris Xe G7 96EUs compare 96 @ 0.4 - 1.35 GHz
Iris Xe G7 80EUs compare 80 @ 0.4 - 1.35 GHz
UHD Graphics 64EUs compare 64 @ 1.4 GHz
UHD Graphics Xe G4 48EUs compare 48 @ 0.35 - 1.45 GHz
UHD Graphics 32EUs compare 32 @ 1.25 GHz
UHD Graphics Xe 32EUs (Tiger Lake-H) compare 32 @ 0.35 - 1.45 GHz
UHD Graphics Xe 750 32EUs 32 @ 0.35 - 1.45 GHz
UHD Graphics 24EUs (Alder Lake-N) compare 24 @ 0.45 - 0.75 GHz
UHD Graphics Xe 16EUs (Tiger Lake-H) compare 16 @ 0.35 - 1.45 GHz
GeForce GTX 680M SLI compare 2688 @ 0.72 GHz2x 256 Bit @ 3600 MHz
GeForce GTX 680MX compare 1536 @ 0.72 GHz256 Bit @ 5000 MHz
GeForce GTX 675M SLI 768 @ 0.62 GHz256 Bit @ 3000 MHz
GeForce GTX 680M compare 1344 @ 0.72 GHz256 Bit @ 3600 MHz
GeForce GTX 670MX SLI compare 1920 @ 0.6 GHz2x 192 Bit @ 2800 MHz
GeForce GTX 675MX compare 960 @ 0.6 GHz256 Bit @ 3600 MHz
GeForce GTX 675M compare 384 @ 0.62 GHz256 Bit @ 3000 MHz
GeForce GTX 670MX compare 960 @ 0.6 GHz192 Bit @ 2800 MHz
GeForce GTX 670M compare 336 @ 0.6 GHz192 Bit @ 3000 MHz
GeForce GTX 660M compare 384 @ 0.84 GHz128 Bit @ 4000 MHz
CodenameRocket Lake XeN12E-GTX2
ArchitectureGen. 12Fermi
Pipelines32 - unified768 - unified
Core Speed350 - 1450 (Boost) MHz620 MHz
Shared Memoryyesno
APIDirectX 12_1, OpenGL 4.6DirectX 11, Shader 5.0
technology14 nm40 nm
FeaturesQuickSyncOptimus, SLI, PhysX, Verde Drivers, CUDA, 3D Vision, 3DTV Play
Date of Announcement30.03.2021 06.01.2011
Shader Speed1240 MHz
Memory Speed3000 MHz
Memory Bus Width256 Bit
Memory TypeGDDR5
Power Consumption2x 100 Watt
Notebook Sizelarge
Link to Manufacturer Pagewww.nvidia.com
CPU in UHD Graphics Xe 750 32EUsGPU Base SpeedGPU Boost / Turbo
Intel Core i9-11900K8 x 3500 MHz, 125 W350 MHz1300 MHz
Intel Core i7-11700K8 x 3600 MHz, 125 W350 MHz1300 MHz
Intel Core i5-11600K6 x 3900 MHz, 125 W350 MHz1300 MHz
min. - max.450 MHz750 - 1300 MHz

Benchmarks

Performance Rating - 3DMark 11 + Fire Strike + Time Spy - UHD Graphics Xe 750 32EUs
1 pt (3%)
3DMark - 3DMark Time Spy Score
min: 383     avg: 622     median: 735 (2%)     max: 747 Points
3DMark - 3DMark Time Spy Graphics
min: 342     avg: 539     median: 634 (2%)     max: 642 Points
3DMark - 3DMark Ice Storm Unlimited Graphics
50628 Points (6%)
3DMark - 3DMark Ice Storm Extreme Graphics
min: 25463     avg: 29673     median: 29673 (4%)     max: 33883 Points
3DMark - 3DMark Cloud Gate Score
min: 5545     avg: 10811     median: 12119 (13%)     max: 13460 Points
3DMark - 3DMark Cloud Gate Graphics
min: 7604     avg: 10689     median: 11315 (3%)     max: 12523 Points
3DMark - 3DMark Fire Strike Standard Score
min: 1024     avg: 1860     median: 2094 (4%)     max: 2227 Points
3DMark - 3DMark Fire Strike Standard Graphics
min: 1144     avg: 1955     median: 2174.5 (2%)     max: 2327 Points
3DMark - 3DMark Ice Storm Graphics
min: 35756     avg: 39116     median: 38682.5 (5%)     max: 43344 Points
3DMark - 3DMark Wild Life Unlimited
2660 Points (1%)
3DMark - 3DMark Wild Life Extreme Unlimited
732 Points (1%)
3DMark - 3DMark Night Raid
3692 Points (3%)
3DMark - 3DMark Night Raid Graphics Score
4435 Points (2%)
3DMark 11 - 3DM11 Performance Score
min: 1407     avg: 2653     median: 3264 (5%)     max: 3289 Points
6389 Points (9%)
3DMark 11 - 3DM11 Performance GPU
min: 1349     avg: 2328     median: 2811 (2%)     max: 2824 Points
6407 Points (6%)
3DMark Vantage
3DM Vant. Perf. total + Intel UHD Graphics Xe 750 32EUs (Rocket Lake)
3DMark Vantage - 3DM Vant. Perf. total
5134 Points (1%)
3DM Vant. Perf. total + NVIDIA GeForce GTX 675M SLI
18405 Points (5%)
3DM Vant. Perf. GPU no PhysX + Intel UHD Graphics Xe 750 32EUs (Rocket Lake)
3DMark Vantage - 3DM Vant. Perf. GPU no PhysX
4452 Points (3%)
3DM Vant. Perf. GPU no PhysX + NVIDIA GeForce GTX 675M SLI
17631 Points (10%)
3DMark 05 - 3DMark 05 - Standard
8935 Points (10%)
3DMark 06 3DMark 06 - Standard 1280x1024 + Intel UHD Graphics Xe 750 32EUs (Rocket Lake)
3DMark 06
min: 8090     avg: 14361     median: 17392 (23%)     max: 17601 Points
Unigine Valley 1.0 - Unigine Valley 1.0 DX
3.5 fps (1%)
Cinebench R10 Cinebench R10 Shading (32bit) + Intel UHD Graphics Xe 750 32EUs (Rocket Lake)
Cinebench R10 - Cinebench R10 Shading (32bit)
6088 Points (4%)
Cinebench R11.5 Cinebench R11.5 OpenGL 64 Bit + Intel UHD Graphics Xe 750 32EUs (Rocket Lake)
Cinebench R11.5 - Cinebench R11.5 OpenGL 64 Bit
min: 22.96     avg: 25.5     median: 25.5 (9%)     max: 28.12 fps
Cinebench R15
Cinebench R15 OpenGL 64 Bit + Intel UHD Graphics Xe 750 32EUs (Rocket Lake)
Cinebench R15 - Cinebench R15 OpenGL 64 Bit
min: 27.38     avg: 29.8     median: 28 (2%)     max: 34.1 fps
Cinebench R15 OpenGL Ref. Match 64 Bit + Intel UHD Graphics Xe 750 32EUs (Rocket Lake)
Cinebench R15 - Cinebench R15 OpenGL Ref. Match 64 Bit
97.8 % (98%)
Basemark GPU 1.2 - Basemark GPU 1.2 Vulkan Official Medium Offscreen 1080
31.7 fps (0%)
Basemark GPU 1.2 - Basemark GPU 1.2 Vulkan Official High Offscreen 2160
3 fps (1%)
Geekbench 6.2 - Geekbench 6.2 GPU OpenCL
2902 Points (1%)
Geekbench 6.2 - Geekbench 6.2 GPU Vulkan
3872 Points (1%)
LuxMark v2.0 64Bit - LuxMark v2.0 Room GPU
min: 129     avg: 336     median: 336 (2%)     max: 543 Samples/s
LuxMark v2.0 64Bit - LuxMark v2.0 Sala GPU
min: 369     avg: 742     median: 742 (1%)     max: 1115 Samples/s
ComputeMark v2.1 - ComputeMark v2.1 Result
min: 700     avg: 1024     median: 1024 (1%)     max: 1348 Points
Power Consumption - Furmark Stress Test Power Consumption - external Monitor *
min: 14.2     avg: 44.8     median: 56.9 (8%)     max: 63.4 Watt
Power Consumption - The Witcher 3 Power Consumption - external Monitor *
min: 70     avg: 86.4     median: 92.9 (13%)     max: 96.2 Watt

Average Benchmarks Intel UHD Graphics Xe 750 32EUs (Rocket Lake) → 100% n=4

Average Benchmarks NVIDIA GeForce GTX 675M SLI → 295% n=4

- Range of benchmark values for this graphics card
- Average benchmark values for this graphics card
* Smaller numbers mean a higher performance
1 This benchmark is not used for the average calculation

Game Benchmarks

The following benchmarks stem from our benchmarks of review laptops. The performance depends on the used graphics memory, clock rate, processor, system settings, drivers, and operating systems. So the results don't have to be representative for all laptops with this GPU. For detailed information on the benchmark results, click on the fps number.

F1 22

F1 22

2022
low 1920x1080
100%
UHD Graphics Xe 750 32EUs:
21.1  fps
med. 1920x1080
100%
UHD Graphics Xe 750 32EUs:
18.8  fps
low 1920x1080
100%
UHD Graphics Xe 750 32EUs:
12.9 (!)  fps
Valorant

Valorant

2020
low 1280x720
100%
UHD Graphics Xe 750 32EUs:
198.3  fps
med. 1920x1080
100%
UHD Graphics Xe 750 32EUs:
64.1  fps
high 1920x1080
100%
UHD Graphics Xe 750 32EUs:
50.8  fps
QHD 2560x1440
100%
UHD Graphics Xe 750 32EUs:
36.1  fps
low 1280x720
100%
UHD Graphics Xe 750 32EUs:
24  fps
med. 1920x1080
100%
UHD Graphics Xe 750 32EUs:
10.6  fps
high 1920x1080
100%
UHD Graphics Xe 750 32EUs:
7.7  fps
Strange Brigade

Strange Brigade

2018
low 1280x720
100%
UHD Graphics Xe 750 32EUs:
25.2 51.1 ~ 38 fps
med. 1920x1080
100%
UHD Graphics Xe 750 32EUs:
10.1 19 ~ 15 fps
high 1920x1080
100%
UHD Graphics Xe 750 32EUs:
9.2 15 ~ 12 fps
ultra 1920x1080
100%
UHD Graphics Xe 750 32EUs:
13.2  fps
low 1280x720
100%
UHD Graphics Xe 750 32EUs:
11.3 17.6 18.3 ~ 16 fps
med. 1920x1080
100%
UHD Graphics Xe 750 32EUs:
8.5 17.3 18.8 ~ 15 fps
high 1920x1080
100%
UHD Graphics Xe 750 32EUs:
7.6 16.4 18 ~ 14 fps
low 1280x720
100%
UHD Graphics Xe 750 32EUs:
5.9 23 23.6 ~ 18 fps
med. 1920x1080
100%
UHD Graphics Xe 750 32EUs:
3.5 12.3 12.4 ~ 9 fps
high 1920x1080
100%
UHD Graphics Xe 750 32EUs:
2.5 8.4 8.5 ~ 6 fps
QHD 2560x1440
100%
UHD Graphics Xe 750 32EUs:
6  fps
4K 3840x2160
100%
UHD Graphics Xe 750 32EUs:
3.5  fps
low 1280x720
100%
UHD Graphics Xe 750 32EUs:
35.1 84.8 126 132 133 ~ 102 fps
med. 1366x768
100%
UHD Graphics Xe 750 32EUs:
20.6 60.3 73.8 74.2 74.7 ~ 61 fps
high 1920x1080
100%
UHD Graphics Xe 750 32EUs:
10.9 32.6 34.9 35.5 35.6 ~ 30 fps
ultra 1920x1080
100%
UHD Graphics Xe 750 32EUs:
9.9 30 31.9 32.5 32.6 ~ 27 fps
4K 3840x2160
100%
UHD Graphics Xe 750 32EUs:
12.4  fps
GTA V

GTA V

2015
low 1024x768
100%
UHD Graphics Xe 750 32EUs:
36.8  fps
med. 1366x768
100%
UHD Graphics Xe 750 32EUs:
34.1  fps

Average Gaming Intel UHD Graphics Xe 750 32EUs (Rocket Lake) → 100%

Average Gaming 30-70 fps → 100%

Intel UHD Graphics Xe 750 32EUs (Rocket Lake)lowmed.highultraQHD4K
F1 2221.118.8
God of War12.9
Valorant198.364.150.836.1
Metro Exodus2410.67.74
Strange Brigade38151213.2
X-Plane 11.11161514
Final Fantasy XV Benchmark189663.48
Dota 2 Reborn10261302712.4
GTA V36.834.1
< 30 fps
< 60 fps
< 120 fps
≥ 120 fps
5
2
1
1
5
1
2
4
2

2


1
1

2


For more games that might be playable and a list of all games and graphics cards visit our Gaming List

Add one or more devices and compare

In the following list you can select (and also search for) devices that should be added to the comparison. You can select more than one device.

restrict list:

show all (including archived), 2024, 2023
v1.28
log 04. 18:32:25

#0 checking url part for id 10943 +0s ... 0s

#1 checking url part for id 3147 +0s ... 0s

#2 redirected to Ajax server, took 1720110745 +0s ... 0s

#3 did not recreate cache, as it is less than 5 days old! Created at Thu, 04 Jul 2024 05:15:44 +0200 +0s ... 0s

#4 composed specs +0.03s ... 0.03s

#5 did output specs +0s ... 0.03s

#6 start showIntegratedCPUs +0s ... 0.03s

#7 getting avg benchmarks for device 10943 +0.011s ... 0.042s

#8 got single benchmarks 10943 +0.002s ... 0.044s

#9 getting avg benchmarks for device 3147 +0s ... 0.044s

#10 got single benchmarks 3147 +0.003s ... 0.047s

#11 got avg benchmarks for devices +0s ... 0.047s

#12 min, max, avg, median took s +0.011s ... 0.058s

#13 before gaming benchmark output +0s ... 0.058s

#14 Got 60 rows for game benchmarks. +0.004s ... 0.062s

#15 composed SQL query for gamebenchmarks +0s ... 0.062s

#16 got data and put it in $dataArray +0.001s ... 0.063s

#17 benchmarks composed for output. +0.003s ... 0.066s

#18 calculated avg scores. +0s ... 0.066s

#19 return log +0.002s ... 0.068s

Please share our article, every link counts!
> Expert Reviews and News on Laptops, Smartphones and Tech Innovations > Benchmarks / Tech > Graphics Card Comparison - Head 2 Head
Redaktion, 2017-09- 8 (Update: 2023-07- 1)