Intel UHD Graphics 600 vs NVIDIA GeForce RTX 2070 Super Max-Q
Intel UHD Graphics 600 ► remove from comparison
The Intel UHD Graphics 600 is an integrated processor graphics unit from the Gemini Lake generation (e. g. Pentium N4100 ), which was announced late 2017. The GPU can convince with low consumption figures, but the performance is only in the low-end segment and is rarely sufficient for modern games. Being the lowest configuration of the Gemini Lake GPU, the UHD Graphics 600 is equipped with 12 of the 18 Execution Units (EUs) running at up to 700 MHz. The technical specifications of the GPU are based on Intel's Gen9 architecture, which is also used for the more expensive Skylake series and also in the predecessor HD Graphics 505.
Due to its lack of dedicated graphics memory or eDRAM cache, the UHD 605 has to access the main memory via processor (2x 64bit DDR4/LPDDR4-2400).
Performance
The UHD Graphics 600 offers a similar performance as the Intel HD Graphics 500 in the Apollo Lake SoCs (same Gen 9 architecture). Therefore, the GPU is only suited for some very low demanding games like Dirt Rally or Sims 4.
Features
The video engine decodes H.265/HEVC (8b and 10b) and VP9 completely in hardware. Up to three displays can be connected via DP 1.2a/eDP 1.3 or HDMI 2.0a (including HDCP 2.2).
Power Consumption
The TDP of the whole Pentium N4100 chip is 6 Watts by default, so the GPU is primarily used for (often passively cooled) netbooks or thin notebooks. The TDP can also be reduced to 4.8 Watts, but this will obviously affect the performance.
NVIDIA GeForce RTX 2070 Super Max-Q ► remove from comparison
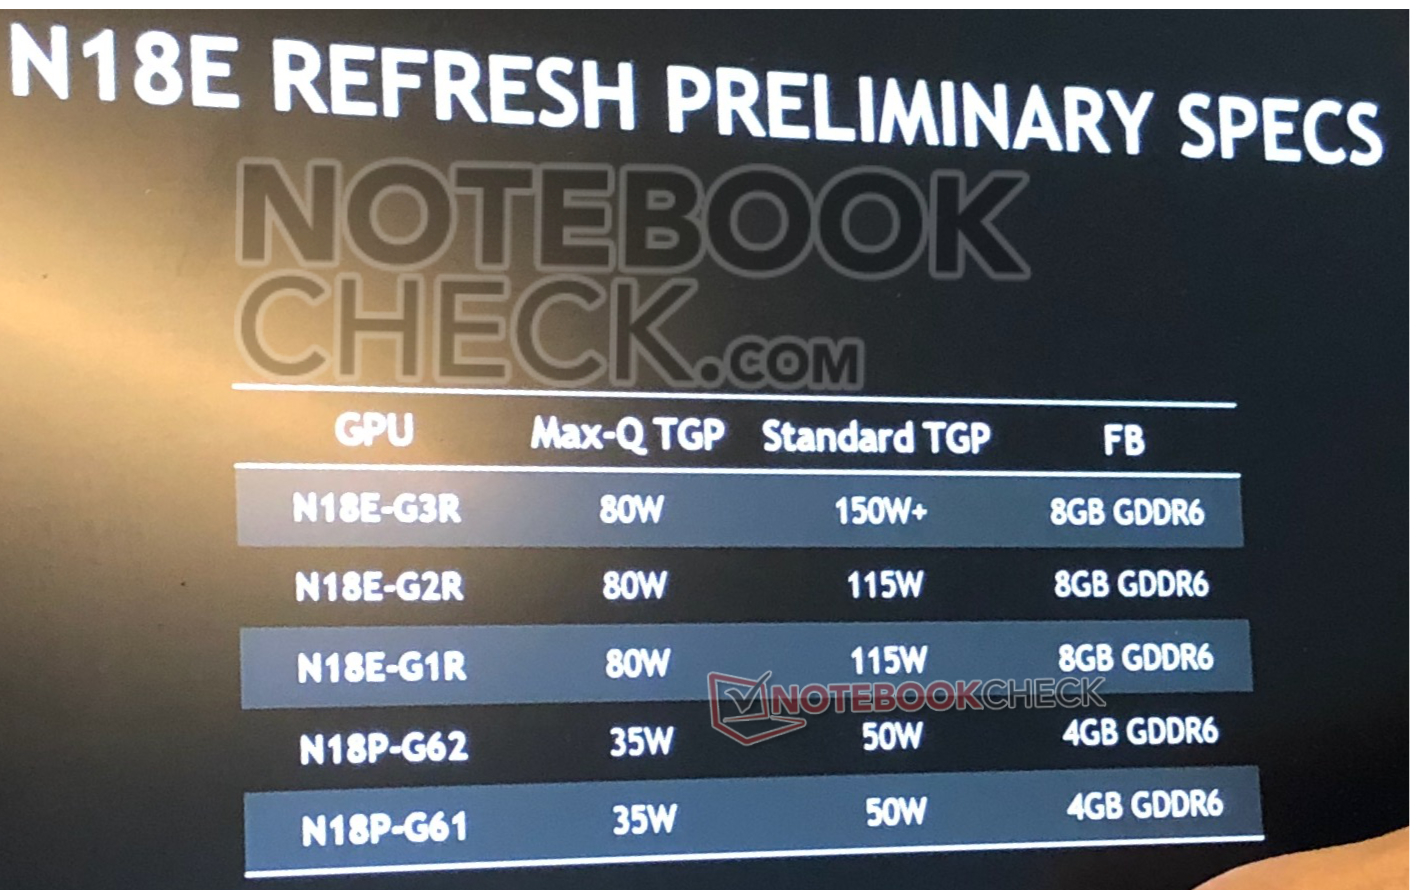
The NVIDIA GeForce RTX 2070 Super with Max-Q design is the power saving variant of the mobile GeForce RTX 2070 Super with reduced clock speeds, performance and of course power consumption. It is intended for thin gaming laptops. It is based on the same TU104-725-A1 chip with 2,560 shaders, 8 GB GDDR6 memory and a 256 Bit memory bus. Currently we know of three variants with a TGP of 80, 85 and 90 Watt, base clock speeds of 930, 1005, and 1080 MHz, and turbo clock speeds of 1155, 1230 and 1290 MHz. The mobile variant for comparison is rated at 115 W and 1140 - 1380 MHz.
With the refresh, Nvidia also reworked the Max-Q technologies for more efficiency. Low Voltage GDDR6 (lower clocked but more headroom for the GPU) and improved regulator efficiency should improve the performance per Watt. Two new optional features can also be implemented by the OEM. Max-Q Dynamic Boost is able to shift power from the CPU to the GPU on a per frame basis to increase overall performance. Furthermore, the laptop manufacturer can also implement Advanced Optimus with a dynamic display switch (hardware) to enable Optimus, G-SYNC and high refresh rate displays (up to 4K 120 Hz).
NVIDIA manufacturers the TU104 chip on a 12 nm FinFET process and includes features like Deep Learning Super Sampling (DLSS) and Real-Time Ray Tracing (RTRT), which should combine to create more realistic lighting effects than older GPUs based on the company's Pascal architecture (if the games supports it). The RTX 2070 Super Max-Q is also DisplayPort 1.4 ready, while there is also support for HDMI 2.0b, HDR, Simultaneous Multi-Projection (SMP) and H.265 video en/decoding (PlayReady 3.0).
Performance
Due to the lower clock rates, the Max-Q variant is clearly slower than the mobile RTX 2070 Super. The difference depends on the used variant, where the 90 W version is only slightly slower. Therefore, the performance should be sufficient for maximum detail settings at a QHD resolution. With raytracing enabled, you may have to reduce settings or resolution. Less demanding games can be easily played in 4k.
The power consumption of the card is between 80 - 90 Watt TGP and therefore clearly lower than the RTX 2070 Super Mobile (115 Watt).
Intel UHD Graphics 600 NVIDIA GeForce RTX 2070 Super Max-Q GeForce RTX 2000 Series Codename Gemini Lake N18E-G2R Architecture Gen. 9 Gemini Lake Turing Pipelines 12 - unified 2560 - unified Core Speed 300 - 700 (Boost) MHz 930 - 1155 (Boost) MHz Memory Bus Width 64/128 Bit 256 Bit Memory Type DDR4 / LPDDR4 GDDR6 Shared Memory yes no API DirectX 12_1, OpenGL 4.4 DirectX 12_1, OpenGL 4.6 technology 14 nm 12 nm Features QuickSync DLSS, Raytraycing, VR Ready, G-SYNC, Vulkan, Multi Monitor, 550 Watt system power recommended Date of Announcement 11.12.2017 02.04.2020 Memory Speed 11000 MHz Max. Amount of Memory 8 GB Power Consumption 80 Watt Notebook Size large
Benchmarks Performance Rating - 3DMark 11 + Fire Strike + Time Spy - UHD Graphics 600
0.2 pt (1%)
...
...
max:
Performance Rating - 3DMark 11 + Fire Strike + Time Spy - GeForce RTX 2070 Super Max-Q
9.5 pt (29%)
...
NVIDIA GeForce RTX 2070 Super Max-Q
...
max:
3DMark - 3DMark Time Spy Score
min: 97 avg: 123 median: 125 (0%) max: 143 Points
min: 7199 avg: 7605 median: 7611.5 (22%) max: 8066 Points
GPU TDP ? TDP 80 W TDP 115 W 40% 93% 100%
3DMark - 3DMark Time Spy Graphics
min: 85 avg: 107.5 median: 109 (0%) max: 124 Points
min: 7084 avg: 7445 median: 7373.5 (20%) max: 7891 Points
GPU TDP ? TDP 80 W TDP 115 W 39% 91% 100%
3DMark - 3DMark Ice Storm Unlimited Graphics
min: 17048 avg: 27966 median: 30149 (3%) max: 43067 Points
min: 461097 avg: 461649 median: 461648 (52%) max: 462200 Points
GPU TDP ? TDP 115 W 15% 100%
3DMark - 3DMark Ice Storm Extreme Graphics
min: 8277 avg: 13725 median: 14480 (2%) max: 19919 Points
3DMark - 3DMark Cloud Gate Score
min: 1932 avg: 2983 median: 3124 (3%) max: 4616 Points
min: 38593 avg: 45672 median: 47119 (50%) max: 49917 Points
GPU TDP ? TDP 115 W 32% 100%
3DMark - 3DMark Cloud Gate Graphics
min: 2346 avg: 3365 median: 3435.5 (1%) max: 4958 Points
min: 65295 avg: 117307 median: 126747 (33%) max: 134954 Points
GPU TDP ? TDP 115 W 23% 100%
3DMark - 3DMark Fire Strike Standard Score
min: 277 avg: 395.9 median: 401.5 (1%) max: 619 Points
min: 16736 avg: 18097 median: 18395 (32%) max: 18947 Points
GPU TDP ? TDP 80 W TDP 115 W 28% 91% 100%
3DMark - 3DMark Fire Strike Standard Graphics
min: 307 avg: 421.2 median: 433 (0%) max: 637 Points
min: 18559 avg: 20277 median: 20872.5 (24%) max: 21446 Points
GPU TDP ? TDP 80 W TDP 115 W 28% 87% 100%
3DMark - 3DMark Ice Storm Graphics
min: 14412 avg: 23582 median: 24012 (3%) max: 35101 Points
66977 Points (8%)
3DMark - 3DMark Sling Shot (ES 3.0) Unlimited
2272 Points (10%)
3DMark - 3DMark Sling Shot (ES 3.0) Unlimited Graphics
2776 Points (6%)
3DMark - 3DMark Wild Life Unlimited
48041 Points (24%)
3DMark - 3DMark Night Raid
1774 Points (2%)
3DMark - 3DMark Night Raid Graphics Score
1917 Points (1%)
3DMark 11 - 3DM11 Performance Score
min: 472 avg: 624 median: 647.5 (1%) max: 985 Points
min: 20666 avg: 23000 median: 23755.5 (33%) max: 24383 Points
GPU TDP ? TDP 80 W TDP 115 W 26% 95% 100%
3DMark 11 - 3DM11 Performance GPU
min: 410 avg: 558 median: 578 (0%) max: 854 Points
min: 24244 avg: 27104 median: 27724 (24%) max: 28900 Points
GPU TDP ? TDP 80 W TDP 115 W 25% 89% 100%
3DMark Vantage + Intel UHD Graphics 600 3DMark Vantage - 3DM Vant. Perf. total
min: 1856 avg: 2189 median: 2189 (1%) max: 2522 Points
3DM Vant. Perf. total + NVIDIA GeForce RTX 2070 Super Max-Q
65101 Points (19%)
3DM Vant. Perf. GPU no PhysX + Intel UHD Graphics 600 3DMark Vantage - 3DM Vant. Perf. GPU no PhysX
min: 1603 avg: 1836 median: 1836 (1%) max: 2069 Points
3DM Vant. Perf. GPU no PhysX + NVIDIA GeForce RTX 2070 Super Max-Q
69136 Points (39%)
3DMark 05 - 3DMark 05 - Standard
min: 6084 avg: 6352 median: 6351.5 (7%) max: 6619 Points
3DMark 06 3DMark 06 - Standard 1280x1024 + Intel UHD Graphics 600
min: 3052 avg: 3884 median: 3960 (5%) max: 4713 Points
3DMark 06 - Standard 1280x1024 + NVIDIA GeForce RTX 2070 Super Max-Q
43406 Points (57%)
Unigine Valley 1.0 - Unigine Valley 1.0 DX
1.1 fps (0%)
SPECviewperf 13 specvp13 sw-04 + NVIDIA GeForce RTX 2070 Super Max-Q SPECviewperf 13 - specvp13 sw-04
min: 80.2 avg: 85.8 median: 85.8 (23%) max: 91.3 fps
GPU TDP ? TDP 80 W 100% 88%
specvp13 snx-03 + NVIDIA GeForce RTX 2070 Super Max-Q SPECviewperf 13 - specvp13 snx-03
min: 19.65 avg: 19.9 median: 19.9 (2%) max: 20.06 fps
GPU TDP ? TDP 80 W 100% 98%
specvp13 showcase-02 + NVIDIA GeForce RTX 2070 Super Max-Q SPECviewperf 13 - specvp13 showcase-02
min: 94.1 avg: 95.6 median: 95.6 (21%) max: 97 fps
GPU TDP ? TDP 80 W 97% 100%
specvp13 medical-02 + NVIDIA GeForce RTX 2070 Super Max-Q SPECviewperf 13 - specvp13 medical-02
min: 48.6 avg: 50.6 median: 50.6 (11%) max: 52.6 fps
GPU TDP ? TDP 80 W 100% 92%
specvp13 maya-05 + NVIDIA GeForce RTX 2070 Super Max-Q SPECviewperf 13 - specvp13 maya-05
min: 199.7 avg: 210.6 median: 210.6 (24%) max: 221.5 fps
GPU TDP ? TDP 80 W 100% 90%
specvp13 energy-02 + NVIDIA GeForce RTX 2070 Super Max-Q SPECviewperf 13 - specvp13 energy-02
min: 18.47 avg: 18.7 median: 18.7 (6%) max: 18.95 fps
GPU TDP ? TDP 80 W 97% 100%
specvp13 creo-02 + NVIDIA GeForce RTX 2070 Super Max-Q SPECviewperf 13 - specvp13 creo-02
min: 160.4 avg: 166.2 median: 166.2 (24%) max: 172 fps
GPU TDP ? TDP 80 W 100% 93%
specvp13 catia-05 + NVIDIA GeForce RTX 2070 Super Max-Q SPECviewperf 13 - specvp13 catia-05
min: 124.3 avg: 126.6 median: 126.6 (14%) max: 128.9 fps
GPU TDP ? TDP 80 W 100% 96%
specvp13 3dsmax-06 + NVIDIA GeForce RTX 2070 Super Max-Q SPECviewperf 13 - specvp13 3dsmax-06
min: 171.5 avg: 176.4 median: 176.4 (31%) max: 181.2 fps
GPU TDP ? TDP 80 W 100% 95%
SPECviewperf 2020 specvp2020 solidworks-05 1080p + NVIDIA GeForce RTX 2070 Super Max-Q SPECviewperf 2020 - specvp2020 solidworks-05 1080p
152.8 fps (30%)
specvp2020 snx-04 1080p + NVIDIA GeForce RTX 2070 Super Max-Q SPECviewperf 2020 - specvp2020 snx-04 1080p
19.5 fps (3%)
specvp2020 medical-03 1080p + NVIDIA GeForce RTX 2070 Super Max-Q SPECviewperf 2020 - specvp2020 medical-03 1080p
24 fps (17%)
specvp2020 maya-06 1080p + NVIDIA GeForce RTX 2070 Super Max-Q SPECviewperf 2020 - specvp2020 maya-06 1080p
221.6 fps (32%)
specvp2020 energy-03 1080p + NVIDIA GeForce RTX 2070 Super Max-Q SPECviewperf 2020 - specvp2020 energy-03 1080p
19.2 fps (15%)
specvp2020 creo-03 1080p + NVIDIA GeForce RTX 2070 Super Max-Q SPECviewperf 2020 - specvp2020 creo-03 1080p
76.8 fps (38%)
specvp2020 catia-06 1080p + NVIDIA GeForce RTX 2070 Super Max-Q SPECviewperf 2020 - specvp2020 catia-06 1080p
49 fps (32%)
specvp2020 3dsmax-07 1080p + NVIDIA GeForce RTX 2070 Super Max-Q SPECviewperf 2020 - specvp2020 3dsmax-07 1080p
86.4 fps (39%)
Cinebench R10 Cinebench R10 Shading (32bit) + Intel UHD Graphics 600 Cinebench R10 - Cinebench R10 Shading (32bit)
min: 3002 avg: 3471 median: 3504 (2%) max: 3825 Points
Cinebench R10 Shading (32bit) + NVIDIA GeForce RTX 2070 Super Max-Q
6835 Points (5%)
Cinebench R11.5 Cinebench R11.5 OpenGL 64 Bit + Intel UHD Graphics 600 Cinebench R11.5 - Cinebench R11.5 OpenGL 64 Bit
min: 7.51 avg: 10.2 median: 10.8 (4%) max: 12.17 fps
Cinebench R11.5 OpenGL 64 Bit + NVIDIA GeForce RTX 2070 Super Max-Q
88.5 fps (31%)
Cinebench R15 + Intel UHD Graphics 600 Cinebench R15 - Cinebench R15 OpenGL 64 Bit
min: 6.47 avg: 15.3 median: 16.4 (1%) max: 20.26 fps
Cinebench R15 OpenGL 64 Bit + NVIDIA GeForce RTX 2070 Super Max-Q
min: 129 avg: 139.5 median: 138 (8%) max: 157 fps
GPU TDP ? TDP 80 W TDP 115 W 28% 100% 92%
Cinebench R15 OpenGL Ref. Match 64 Bit + Intel UHD Graphics 600 Cinebench R15 - Cinebench R15 OpenGL Ref. Match 64 Bit
97.8 % (98%)
Cinebench R15 OpenGL Ref. Match 64 Bit + NVIDIA GeForce RTX 2070 Super Max-Q
99.6 % (100%)
GPU TDP ? TDP 80 W TDP 115 W 99% 100% 100%
GFXBench - GFXBench 5.0 Aztec Ruins High Tier Offscreen
min: 3.4 avg: 3.7 median: 3.7 (1%) max: 3.9 fps
GFXBench - GFXBench 5.0 Aztec Ruins Normal Tier Offscreen
min: 9 avg: 10 median: 9.9 (1%) max: 11 fps
GFXBench - GFXBench Car Chase Offscreen
min: 5.4 avg: 7.7 median: 8.1 (1%) max: 9.2 fps
349 fps (39%)
GFXBench 3.1 - GFXBench Manhattan ES 3.1 Offscreen
min: 13.4 avg: 14.5 median: 15 (0%) max: 15 fps
GFXBench 3.0 - GFXBench 3.0 Manhattan Offscreen
min: 18.2 avg: 19.4 median: 19 (1%) max: 21 fps
GFXBench (DX / GLBenchmark) 2.7 + Intel UHD Graphics 600 GFXBench (DX / GLBenchmark) 2.7 - GFXBench T-Rex HD Offscreen C24Z16
min: 33.3 avg: 37.2 median: 37.2 (0%) max: 41 fps
Basemark GPU 1.2 - Basemark GPU 1.2 Vulkan Official Medium Offscreen 1080
min: 15.5 avg: 15.8 median: 15.8 (0%) max: 16 fps
Basemark GPU 1.2 - Basemark GPU 1.2 Vulkan Official High Offscreen 2160
1.3 fps (0%)
LuxMark v2.0 64Bit - LuxMark v2.0 Room GPU
min: 70 avg: 78.3 median: 76 (0%) max: 89 Samples/s
LuxMark v2.0 64Bit - LuxMark v2.0 Sala GPU
min: 122 avg: 135.3 median: 129 (0%) max: 155 Samples/s
ComputeMark v2.1 - ComputeMark v2.1 Result
min: 337 avg: 357.5 median: 358 (0%) max: 377 Points
14015 Points (15%)
Power Consumption - Furmark Stress Test Power Consumption - external Monitor *
min: 8.15 avg: 10.2 median: 10 (1%) max: 12.6 Watt
Power Consumption - The Witcher 3 Power Consumption - external Monitor *
153 Watt (21%)
Power Consumption - Witcher 3 Power Consumption *
14.7 Watt (3%)
min: 144 avg: 156 median: 155 (34%) max: 176 Watt
GPU TDP ? TDP 80 W TDP 115 W 114% 111% 100%
Power Consumption - Witcher 3 ultra Power Efficiency
min: 0.4324 avg: 0.5 median: 0.5 (43%) max: 0.531 fps per Watt
GPU TDP ? TDP 80 W TDP 115 W 91% 82% 100%
Power Consumption - Witcher 3 ultra Power Efficiency - external Monitor
0.5 fps per Watt (43%)
Emissions Witcher 3 Fan Noise + NVIDIA GeForce RTX 2070 Super Max-Q Emissions - Witcher 3 Fan Noise
min: 46 avg: 48.9 median: 48 (77%) max: 53 dB(A)
GPU TDP ? TDP 80 W TDP 115 W 92% 87% 100%
Clock Speed - GPU Clock Witcher 3 ultra
min: 1320 avg: 1363 median: 1350 (53%) max: 1440 MHz
GPU TDP ? TDP 115 W 99% 100%
Clock Speed - GPU Clock Speed Furmark
min: 500 avg: 519 median: 519 (21%) max: 538 MHz
Average Benchmarks Intel UHD Graphics 600 → 100% n=19 Average Benchmarks NVIDIA GeForce RTX 2070 Super Max-Q → 2935% n=19
- Range of benchmark values for this graphics card
- Average benchmark values for this graphics card
* Smaller numbers mean a higher performance
1 This benchmark is not used for the average calculation
Game Benchmarks The following benchmarks stem from our benchmarks of review laptops. The performance depends on the used graphics memory, clock rate, processor, system settings, drivers, and operating systems. So the results don't have to be representative for all laptops with this GPU. For detailed information on the benchmark results, click on the fps number.
GeForce RTX 2070 Super Max-Q:
117.8 fps
GeForce RTX 2070 Super Max-Q:
67.7 fps
GeForce RTX 2070 Super Max-Q:
56.7 fps
GeForce RTX 2070 Super Max-Q:
48.5 fps
GeForce RTX 2070 Super Max-Q:
135.7 fps
GeForce RTX 2070 Super Max-Q:
102.6 fps
GeForce RTX 2070 Super Max-Q:
101.6 fps
GeForce RTX 2070 Super Max-Q:
86.1 fps
GeForce RTX 2070 Super Max-Q:
163.7 fps
GeForce RTX 2070 Super Max-Q:
93.6 fps
GeForce RTX 2070 Super Max-Q:
86.2 fps
GeForce RTX 2070 Super Max-Q:
77.4 fps
GeForce RTX 2070 Super Max-Q:
118 fps
GeForce RTX 2070 Super Max-Q:
81 fps
GeForce RTX 2070 Super Max-Q:
70 fps
GeForce RTX 2070 Super Max-Q:
60 fps
GeForce RTX 2070 Super Max-Q:
160 fps
GeForce RTX 2070 Super Max-Q:
95.6 fps
GeForce RTX 2070 Super Max-Q:
78.2 fps
GeForce RTX 2070 Super Max-Q:
65.1 fps
GeForce RTX 2070 Super Max-Q:
100 fps
GeForce RTX 2070 Super Max-Q:
96 fps
GeForce RTX 2070 Super Max-Q:
84 fps
GeForce RTX 2070 Super Max-Q:
59 fps
GeForce RTX 2070 Super Max-Q:
127 fps
GeForce RTX 2070 Super Max-Q:
87.7 fps
GeForce RTX 2070 Super Max-Q:
81.9 fps
GeForce RTX 2070 Super Max-Q:
67.7 fps
GeForce RTX 2070 Super Max-Q:
145 fps
GeForce RTX 2070 Super Max-Q:
120 fps
GeForce RTX 2070 Super Max-Q:
107 fps
GeForce RTX 2070 Super Max-Q:
93 fps
GeForce RTX 2070 Super Max-Q:
164.3 fps
GeForce RTX 2070 Super Max-Q:
114.5 fps
GeForce RTX 2070 Super Max-Q:
104.3 fps
GeForce RTX 2070 Super Max-Q:
101.8 fps
GeForce RTX 2070 Super Max-Q:
258 [X] Aorus 15G XB Intel Core i7-10875H 2.3GHz
GeForce RTX 2070 Super Max-Q
min:
213 fps, max:
280 fps
fps
GeForce RTX 2070 Super Max-Q:
163 [X] Aorus 15G XB Intel Core i7-10875H 2.3GHz
GeForce RTX 2070 Super Max-Q
min:
153 fps, max:
178 fps
fps
GeForce RTX 2070 Super Max-Q:
145 [X] Aorus 15G XB Intel Core i7-10875H 2.3GHz
GeForce RTX 2070 Super Max-Q
min:
131 fps, max:
158 fps
fps
GeForce RTX 2070 Super Max-Q:
104 [X] Aorus 15G XB Intel Core i7-10875H 2.3GHz
GeForce RTX 2070 Super Max-Q
min:
88 fps, max:
122 fps
fps
100%
UHD Graphics 600:
31.9 fps
100%
UHD Graphics 600:
12.8 fps
100%
UHD Graphics 600:
11.3 fps
100%
UHD Graphics 600:
5.1 fps
5341%
GeForce RTX 2070 Super Max-Q:
272.4 fps
GeForce RTX 2070 Super Max-Q:
165.8 fps
GeForce RTX 2070 Super Max-Q:
79 82.2 90.6 ~ 84 fps
GeForce RTX 2070 Super Max-Q:
229.6 232.3 ~ 231 fps
GeForce RTX 2070 Super Max-Q:
99.6 fps
GeForce RTX 2070 Super Max-Q:
51.2 fps
GeForce RTX 2070 Super Max-Q:
109 fps
GeForce RTX 2070 Super Max-Q:
91.6 96.8 ~ 94 fps
GeForce RTX 2070 Super Max-Q:
56.8 fps
GeForce RTX 2070 Super Max-Q:
27.4 fps
GeForce RTX 2070 Super Max-Q:
121 fps
GeForce RTX 2070 Super Max-Q:
116 121 ~ 119 fps
GeForce RTX 2070 Super Max-Q:
107 119 ~ 113 fps
GeForce RTX 2070 Super Max-Q:
79.8 fps
GeForce RTX 2070 Super Max-Q:
36.8 fps
100%
UHD Graphics 600:
29 fps
100%
UHD Graphics 600:
28.9 fps
100%
UHD Graphics 600:
14.9 fps
100%
UHD Graphics 600:
11.3 [X] BMAX MaxBook Y11 H1M6 Intel Celeron N4100 1.1GHz
UHD Graphics 600
min:
3.96 fps, P0.1:
4.94 fps, P1:
8.44 fps, max:
91 fps
fps
GeForce RTX 2070 Super Max-Q:
132.8 fps
GeForce RTX 2070 Super Max-Q:
86.6 91.3 ~ 89 fps
GeForce RTX 2070 Super Max-Q:
32 34.3 ~ 33 fps
GeForce RTX 2070 Super Max-Q:
20.5 22 ~ 21 fps
GeForce RTX 2070 Super Max-Q:
108 109 ~ 109 fps
GeForce RTX 2070 Super Max-Q:
95 98.2 104 ~ 99 fps
GeForce RTX 2070 Super Max-Q:
71.3 fps
GeForce RTX 2070 Super Max-Q:
35.9 fps
GeForce RTX 2070 Super Max-Q:
103 fps
GeForce RTX 2070 Super Max-Q:
88.2 94 ~ 91 fps
GeForce RTX 2070 Super Max-Q:
80.7 82.6 ~ 82 fps
GeForce RTX 2070 Super Max-Q:
60.5 fps
GeForce RTX 2070 Super Max-Q:
33.4 fps
GeForce RTX 2070 Super Max-Q:
160.9 fps
GeForce RTX 2070 Super Max-Q:
116.2 134 ~ 125 fps
GeForce RTX 2070 Super Max-Q:
97.8 117 126 ~ 114 fps
GeForce RTX 2070 Super Max-Q:
72.3 fps
GeForce RTX 2070 Super Max-Q:
41 fps
GeForce RTX 2070 Super Max-Q:
131 fps
GeForce RTX 2070 Super Max-Q:
103 104 ~ 104 fps
GeForce RTX 2070 Super Max-Q:
69.7 71.1 ~ 70 fps
GeForce RTX 2070 Super Max-Q:
60.6 fps
GeForce RTX 2070 Super Max-Q:
39.7 fps
GeForce RTX 2070 Super Max-Q:
101 fps
GeForce RTX 2070 Super Max-Q:
89 92 ~ 91 fps
GeForce RTX 2070 Super Max-Q:
66 69 ~ 68 fps
GeForce RTX 2070 Super Max-Q:
49 50 ~ 50 fps
GeForce RTX 2070 Super Max-Q:
28 29 ~ 29 fps
GeForce RTX 2070 Super Max-Q:
271 fps
GeForce RTX 2070 Super Max-Q:
196 259 ~ 228 fps
GeForce RTX 2070 Super Max-Q:
190 257 ~ 224 fps
GeForce RTX 2070 Super Max-Q:
253 fps
GeForce RTX 2070 Super Max-Q:
186 fps
GeForce RTX 2070 Super Max-Q:
112 fps
GeForce RTX 2070 Super Max-Q:
41.7 45.6 ~ 44 fps
GeForce RTX 2070 Super Max-Q:
22.2 24.5 ~ 23 fps
GeForce RTX 2070 Super Max-Q:
92.6 fps
GeForce RTX 2070 Super Max-Q:
60.2 68.4 ~ 64 fps
GeForce RTX 2070 Super Max-Q:
40.6 43.9 ~ 42 fps
GeForce RTX 2070 Super Max-Q:
21.1 23.8 ~ 22 fps
100%
UHD Graphics 600:
5.7 9 ~ 7 fps
GeForce RTX 2070 Super Max-Q:
191 fps
GeForce RTX 2070 Super Max-Q:
152 [X] Aorus 17G XB Intel Core i7-10875H 2.3GHz
GeForce RTX 2070 Super Max-Q
min:
131 fps
159 ~ 156 fps
GeForce RTX 2070 Super Max-Q:
141 [X] Aorus 17G XB Intel Core i7-10875H 2.3GHz
GeForce RTX 2070 Super Max-Q
min:
123 fps
143 ~ 142 fps
GeForce RTX 2070 Super Max-Q:
107 fps
GeForce RTX 2070 Super Max-Q:
61 fps
100%
UHD Graphics 600:
42.5 fps
100%
UHD Graphics 600:
29.8 fps
100%
UHD Graphics 600:
22 fps
100%
UHD Graphics 600:
19.2 fps
100%
UHD Graphics 600:
9.8 fps
2633%
GeForce RTX 2070 Super Max-Q:
255.2 [X] Aorus 15G XB Intel Core i7-10875H 2.3GHz
GeForce RTX 2070 Super Max-Q
min:
186 fps, max:
332 fps
260.9 ~ 258 fps
GeForce RTX 2070 Super Max-Q:
122.8 [X] Aorus 15G XB Intel Core i7-10875H 2.3GHz
GeForce RTX 2070 Super Max-Q
min:
99 fps, max:
149 fps
141.2 ~ 132 fps
GeForce RTX 2070 Super Max-Q:
77.6 [X] Aorus 15G XB Intel Core i7-10875H 2.3GHz
GeForce RTX 2070 Super Max-Q
min:
59 fps, max:
95 fps
97.5 ~ 88 fps
GeForce RTX 2070 Super Max-Q:
54.8 [X] Aorus 15G XB Intel Core i7-10875H 2.3GHz
GeForce RTX 2070 Super Max-Q
min:
43 fps, max:
67 fps
68.7 ~ 62 fps
GeForce RTX 2070 Super Max-Q:
119 fps
GeForce RTX 2070 Super Max-Q:
97.5 99.5 ~ 99 fps
GeForce RTX 2070 Super Max-Q:
94.9 97.1 ~ 96 fps
GeForce RTX 2070 Super Max-Q:
62.8 fps
GeForce RTX 2070 Super Max-Q:
30.1 fps
100%
UHD Graphics 600:
8.3 fps
GeForce RTX 2070 Super Max-Q:
112 fps
GeForce RTX 2070 Super Max-Q:
84.2 85.5 ~ 85 fps
GeForce RTX 2070 Super Max-Q:
46.8 47.4 ~ 47 fps
GeForce RTX 2070 Super Max-Q:
36.6 37 ~ 37 fps
GeForce RTX 2070 Super Max-Q:
21.1 21.5 ~ 21 fps
100%
UHD Graphics 600:
0 (!) [X] Chuwi LapBook SE Intel Celeron N4100 1.1GHz
UHD Graphics 600
2 ~ 1 fps
GeForce RTX 2070 Super Max-Q:
123 fps
GeForce RTX 2070 Super Max-Q:
105 113 ~ 109 fps
GeForce RTX 2070 Super Max-Q:
77 81 ~ 79 fps
GeForce RTX 2070 Super Max-Q:
54 60 ~ 57 fps
GeForce RTX 2070 Super Max-Q:
29 29 ~ 29 fps
100%
UHD Graphics 600:
17.7 fps
GeForce RTX 2070 Super Max-Q:
183 fps
GeForce RTX 2070 Super Max-Q:
151 [X] Aorus 17G XB Intel Core i7-10875H 2.3GHz
GeForce RTX 2070 Super Max-Q
min:
132 fps
155 ~ 153 fps
GeForce RTX 2070 Super Max-Q:
85.8 86.9 [X] Aorus 17G XB Intel Core i7-10875H 2.3GHz
GeForce RTX 2070 Super Max-Q
min:
72 fps
~ 86 fps
GeForce RTX 2070 Super Max-Q:
66 fps
100%
UHD Graphics 600:
1 fps
GeForce RTX 2070 Super Max-Q:
98 fps
GeForce RTX 2070 Super Max-Q:
92 110 ~ 101 fps
GeForce RTX 2070 Super Max-Q:
83 98 ~ 91 fps
GeForce RTX 2070 Super Max-Q:
70 80 ~ 75 fps
GeForce RTX 2070 Super Max-Q:
43 45 ~ 44 fps
GeForce RTX 2070 Super Max-Q:
92 fps
GeForce RTX 2070 Super Max-Q:
72 75.4 ~ 74 fps
GeForce RTX 2070 Super Max-Q:
57.7 60.4 ~ 59 fps
GeForce RTX 2070 Super Max-Q:
46.7 49.1 ~ 48 fps
GeForce RTX 2070 Super Max-Q:
26.5 29.1 ~ 28 fps
100%
UHD Graphics 600:
7.8 fps
GeForce RTX 2070 Super Max-Q:
144 fps
GeForce RTX 2070 Super Max-Q:
140 144 ~ 142 fps
GeForce RTX 2070 Super Max-Q:
139 143 ~ 141 fps
GeForce RTX 2070 Super Max-Q:
109 fps
GeForce RTX 2070 Super Max-Q:
61.1 fps
100%
UHD Graphics 600:
3 fps
GeForce RTX 2070 Super Max-Q:
137 fps
GeForce RTX 2070 Super Max-Q:
101 fps
GeForce RTX 2070 Super Max-Q:
93.4 fps
GeForce RTX 2070 Super Max-Q:
63.6 fps
GeForce RTX 2070 Super Max-Q:
34.5 fps
100%
UHD Graphics 600:
7 fps
GeForce RTX 2070 Super Max-Q:
135 fps
GeForce RTX 2070 Super Max-Q:
118 fps
GeForce RTX 2070 Super Max-Q:
107 fps
GeForce RTX 2070 Super Max-Q:
71.6 fps
GeForce RTX 2070 Super Max-Q:
36.4 fps
GeForce RTX 2070 Super Max-Q:
144 fps
GeForce RTX 2070 Super Max-Q:
121 135 136 [X] Aorus 17G XB Intel Core i7-10875H 2.3GHz
GeForce RTX 2070 Super Max-Q
min:
110 fps
139 ~ 133 fps
GeForce RTX 2070 Super Max-Q:
113 125 126 [X] Aorus 17G XB Intel Core i7-10875H 2.3GHz
GeForce RTX 2070 Super Max-Q
min:
94 fps
130 ~ 124 fps
GeForce RTX 2070 Super Max-Q:
99.4 100 ~ 100 fps
GeForce RTX 2070 Super Max-Q:
56.8 58.2 ~ 58 fps
GeForce RTX 2070 Super Max-Q:
89.2 fps
GeForce RTX 2070 Super Max-Q:
83.2 fps
GeForce RTX 2070 Super Max-Q:
79.7 fps
GeForce RTX 2070 Super Max-Q:
76.1 fps
GeForce RTX 2070 Super Max-Q:
41.5 fps
100%
UHD Graphics 600:
4 fps
GeForce RTX 2070 Super Max-Q:
99 fps
GeForce RTX 2070 Super Max-Q:
81 fps
GeForce RTX 2070 Super Max-Q:
62 fps
GeForce RTX 2070 Super Max-Q:
47 fps
GeForce RTX 2070 Super Max-Q:
32 fps
100%
UHD Graphics 600:
0 (!) [X] Chuwi LapBook SE Intel Celeron N4100 1.1GHz
UHD Graphics 600
4 5.1 ~ 3 fps
100%
UHD Graphics 600:
4 fps
3325%
GeForce RTX 2070 Super Max-Q:
133 fps
GeForce RTX 2070 Super Max-Q:
112 118 ~ 115 fps
GeForce RTX 2070 Super Max-Q:
91 96 99 99 [X] Aorus 17G XB Intel Core i7-10875H 2.3GHz
GeForce RTX 2070 Super Max-Q
min:
77 fps
100 ~ 97 fps
GeForce RTX 2070 Super Max-Q:
68 68 ~ 68 fps
GeForce RTX 2070 Super Max-Q:
35 36 ~ 36 fps
100%
UHD Graphics 600:
8 9.5 [X] 1.47.22.14 D3D12
Intel Celeron N4100 1.1GHz
UHD Graphics 600
min:
5 fps, P1:
5 fps, max:
98.6 fps
~ 9 fps
100%
UHD Graphics 600:
6.1 [X] 1.47.22.14 D3D12
Intel Celeron N4100 1.1GHz
UHD Graphics 600
min:
5 fps, P1:
5 fps, max:
60.1 fps
fps
100%
UHD Graphics 600:
5.8 [X] 1.47.22.14 D3D12
Intel Celeron N4100 1.1GHz
UHD Graphics 600
min:
5 fps, P1:
5 fps, max:
100 fps
fps
100%
UHD Graphics 600:
3.6 [X] 1.47.22.14 D3D12
Intel Celeron N4100 1.1GHz
UHD Graphics 600
min:
5 fps, P1:
5 fps, max:
74.6 fps
fps
100%
UHD Graphics 600:
12 fps
GeForce RTX 2070 Super Max-Q:
113 fps
GeForce RTX 2070 Super Max-Q:
102 fps
GeForce RTX 2070 Super Max-Q:
84.2 fps
GeForce RTX 2070 Super Max-Q:
55.7 fps
GeForce RTX 2070 Super Max-Q:
27.5 fps
100%
UHD Graphics 600:
3 fps
4967%
GeForce RTX 2070 Super Max-Q:
149 fps
GeForce RTX 2070 Super Max-Q:
118 fps
GeForce RTX 2070 Super Max-Q:
111 fps
GeForce RTX 2070 Super Max-Q:
104 fps
100%
UHD Graphics 600:
34.8 34.8 ~ 35 fps
100%
UHD Graphics 600:
4.6 4.8 ~ 5 fps
100%
UHD Graphics 600:
3.4 [X] LincPlus P1 Intel Celeron N4000 1.1GHz
UHD Graphics 600
3.4 3.5 4 4.2 4.2 4.7 4.8 4.8 [X] Intel Celeron J4125 2GHz
UHD Graphics 600
4.9 4.9 [X] Intel Celeron N4100 1.1GHz
UHD Graphics 600
4.9 5 5.3 5.4 5.6 5.7 [X] Intel NUC7CJYSAMN Intel Celeron J4025 2GHz
UHD Graphics 600
5.8 ~ 5 fps
GeForce RTX 2070 Super Max-Q:
67.8 75.4 ~ 72 fps
GeForce RTX 2070 Super Max-Q:
127 fps
GeForce RTX 2070 Super Max-Q:
108 fps
GeForce RTX 2070 Super Max-Q:
75.9 fps
GeForce RTX 2070 Super Max-Q:
54.4 fps
GeForce RTX 2070 Super Max-Q:
27.9 fps
100%
UHD Graphics 600:
2.9 3.6 4 4.1 4.5 [X] 1.3
Intel Celeron N4100 1.1GHz
UHD Graphics 600
4.8 5.2 [X] 1.3
Intel Celeron J4125 2GHz
UHD Graphics 600
5.3 5.5 [X] Intel NUC7CJYSAMN 1.3
Intel Celeron J4025 2GHz
UHD Graphics 600
~ 4 fps
4050%
GeForce RTX 2070 Super Max-Q:
162 fps
100%
UHD Graphics 600:
2.1 [X] 1.3
Intel Celeron J4125 2GHz
UHD Graphics 600
2.2 [X] 1.3
Intel Celeron N4100 1.1GHz
UHD Graphics 600
2.3 2.4 [X] Intel NUC7CJYSAMN 1.3
Intel Celeron J4025 2GHz
UHD Graphics 600
~ 2 fps
5350%
GeForce RTX 2070 Super Max-Q:
104 110 ~ 107 fps
100%
UHD Graphics 600:
1.5 [X] 1.3
Intel Celeron J4125 2GHz
UHD Graphics 600
1.6 [X] 1.3
Intel Celeron N4100 1.1GHz
UHD Graphics 600
1.6 ~ 2 fps
4100%
GeForce RTX 2070 Super Max-Q:
80 83.7 ~ 82 fps
100%
UHD Graphics 600:
1.1 [X] 1.3
Intel Celeron N4100 1.1GHz
UHD Graphics 600
fps
GeForce RTX 2070 Super Max-Q:
33 fps
GeForce RTX 2070 Super Max-Q:
133 fps
GeForce RTX 2070 Super Max-Q:
132 fps
GeForce RTX 2070 Super Max-Q:
108 fps
GeForce RTX 2070 Super Max-Q:
86.2 fps
GeForce RTX 2070 Super Max-Q:
43 fps
100%
UHD Graphics 600:
9 fps
100%
UHD Graphics 600:
5.5 fps
100%
UHD Graphics 600:
35.3 fps
100%
UHD Graphics 600:
28.7 fps
100%
UHD Graphics 600:
8.8 14.6 ~ 12 fps
100%
UHD Graphics 600:
9.3 fps
100%
UHD Graphics 600:
9.3 fps
100%
UHD Graphics 600:
3 fps
100%
UHD Graphics 600:
5 fps
100%
UHD Graphics 600:
3 fps
100%
UHD Graphics 600:
17.1 fps
100%
UHD Graphics 600:
10.8 fps
100%
UHD Graphics 600:
20 fps
100%
UHD Graphics 600:
13.1 fps
100%
UHD Graphics 600:
5.5 5.5 5.8 5.9 [X] Chuwi Hi10 X Intel Celeron N4100 1.1GHz
UHD Graphics 600
min:
3.3 fps, max:
-1 fps
6 6.1 6.5 6.8 [X] GMK NucBox K1 Intel Celeron J4125 2GHz
UHD Graphics 600
min:
5.7 fps, max:
-1 fps
6.8 [X] GMK NucBox 3 Intel Celeron J4125 2GHz
UHD Graphics 600
min:
5.2 fps, max:
-1 fps
7.3 [X] Intel Celeron N4100 1.1GHz
UHD Graphics 600
min:
6.1 fps, max:
-1 fps
7.7 7.9 8 8.1 [X] Intel Celeron J4125 2GHz
UHD Graphics 600
min:
6.8 fps, max:
-1 fps
8.2 [X] Teclast F7 Air Intel Celeron N4120 1.1GHz
UHD Graphics 600
min:
6.7 fps, max:
-1 fps
8.6 8.8 8.8 [X] Intel NUC7CJYSAMN Intel Celeron J4025 2GHz
UHD Graphics 600
min:
4.1 fps, max:
-1 fps
~ 7 fps
100%
UHD Graphics 600:
5.2 5.4 5.5 5.7 5.7 [X] Chuwi Hi10 X Intel Celeron N4100 1.1GHz
UHD Graphics 600
min:
2.7 fps, max:
-1 fps
5.8 5.9 6.1 [X] GMK NucBox K1 Intel Celeron J4125 2GHz
UHD Graphics 600
min:
5.1 fps, max:
-1 fps
6.3 [X] GMK NucBox 3 Intel Celeron J4125 2GHz
UHD Graphics 600
min:
4.4 fps, max:
-1 fps
6.9 [X] Intel Celeron N4100 1.1GHz
UHD Graphics 600
min:
5.5 fps, max:
-1 fps
7.1 7.2 7.4 7.4 [X] Teclast F7 Air Intel Celeron N4120 1.1GHz
UHD Graphics 600
min:
5.9 fps, max:
-1 fps
7.4 [X] Intel Celeron J4125 2GHz
UHD Graphics 600
min:
6.3 fps, max:
-1 fps
7.7 7.8 [X] Intel NUC7CJYSAMN Intel Celeron J4025 2GHz
UHD Graphics 600
min:
4.9 fps, max:
-1 fps
8 ~ 7 fps
GeForce RTX 2070 Super Max-Q:
103 fps
100%
UHD Graphics 600:
4.7 fps
GeForce RTX 2070 Super Max-Q:
62.7 70.5 71.9 [X] MSI GS66 Stealth 10SFS BIOS-Update Intel Core i9-10980HK 2.4GHz
GeForce RTX 2070 Super Max-Q
min:
60 fps
73.6 [X] Aorus 17G XB Intel Core i7-10875H 2.3GHz
GeForce RTX 2070 Super Max-Q
min:
62 fps
74 75.3 75.5 [X] Aorus 15G XB Intel Core i7-10875H 2.3GHz
GeForce RTX 2070 Super Max-Q
min:
63 fps
76.2 [X] Gigabyte Aero 15 OLED XB Dynamic Boost Off Intel Core i7-10875H 2.3GHz
GeForce RTX 2070 Super Max-Q
min:
64 fps
79.1 92.5 ~ 75 fps
GeForce RTX 2070 Super Max-Q:
49.7 50.5 [X] Gigabyte Aero 15 OLED XB Dynamic Boost Off Intel Core i7-10875H 2.3GHz
GeForce RTX 2070 Super Max-Q
min:
43 fps
52.9 ~ 51 fps
100%
UHD Graphics 600:
43.3 fps
100%
UHD Graphics 600:
12.5 fps
100%
UHD Graphics 600:
12.5 fps
100%
UHD Graphics 600:
12.6 16 ~ 14 fps
1300%
GeForce RTX 2070 Super Max-Q:
182 182 182 182 [X] Aorus 17G XB Intel Core i7-10875H 2.3GHz
GeForce RTX 2070 Super Max-Q
min:
3.97 fps, P1:
143 fps, max:
340 fps
~ 182 fps
100%
UHD Graphics 600:
11.6 fps
1517%
GeForce RTX 2070 Super Max-Q:
174 175 176 177 [X] Aorus 17G XB Intel Core i7-10875H 2.3GHz
GeForce RTX 2070 Super Max-Q
min:
4.1 fps, P1:
125 fps, max:
374 fps
~ 176 fps
GeForce RTX 2070 Super Max-Q:
153 159 [X] Aorus 17G XB Intel Core i7-10875H 2.3GHz
GeForce RTX 2070 Super Max-Q
min:
4.33 fps, P1:
111 fps, max:
391 fps
160 161 ~ 158 fps
GeForce RTX 2070 Super Max-Q:
83.4 89.9 91.1 [X] Aorus 17G XB Intel Core i7-10875H 2.3GHz
GeForce RTX 2070 Super Max-Q
min:
9.54 fps, P1:
58.8 fps, max:
197 fps
91.3 ~ 89 fps
GeForce RTX 2070 Super Max-Q:
73.1 fps
100%
UHD Graphics 600:
77.8 fps
100%
UHD Graphics 600:
17.7 fps
100%
UHD Graphics 600:
10.2 fps
100%
UHD Graphics 600:
66.8 fps
100%
UHD Graphics 600:
18 fps
100%
UHD Graphics 600:
12.5 fps
1827%
GeForce RTX 2070 Super Max-Q:
420.2 fps
3268%
GeForce RTX 2070 Super Max-Q:
359.5 fps
3298%
GeForce RTX 2070 Super Max-Q:
329.8 fps
100%
UHD Graphics 600:
2 3.3 3.3 ~ 3 fps
5550%
GeForce RTX 2070 Super Max-Q:
166.5 fps
100%
UHD Graphics 600:
78.8 fps
100%
UHD Graphics 600:
16.3 fps
100%
UHD Graphics 600:
33 33.9 ~ 33 fps
100%
UHD Graphics 600:
16.2 16.4 ~ 16 fps
100%
UHD Graphics 600:
10.7 11.2 ~ 11 fps
100%
UHD Graphics 600:
5 fps
100%
UHD Graphics 600:
24.6 fps
100%
UHD Graphics 600:
15.8 fps
100%
UHD Graphics 600:
38 fps
100%
UHD Graphics 600:
18.5 fps
100%
UHD Graphics 600:
12.2 fps
100%
UHD Graphics 600:
19.2 fps
100%
UHD Graphics 600:
12.9 fps
100%
UHD Graphics 600:
9.6 fps
100%
UHD Graphics 600:
61.6 fps
100%
UHD Graphics 600:
14.9 fps
100%
UHD Graphics 600:
10.6 fps
100%
UHD Graphics 600:
153 fps
100%
UHD Graphics 600:
25.1 fps
100%
UHD Graphics 600:
12.3 fps
100%
UHD Graphics 600:
43.9 fps
100%
UHD Graphics 600:
3.3 fps
Average Gaming Intel UHD Graphics 600 → 100% Average Gaming 30-70 fps → 100%
Average Gaming NVIDIA GeForce RTX 2070 Super Max-Q → 3091%  Deutsch
 English
 Español
 Français
 Italiano
 Nederlands
 Polski
 Português
 Русский
 Türkçe
 Svenska
 Chinese
 Magyar