Intel UHD Graphics 32EUs (Alder Lake) vs NVIDIA Quadro RTX 6000 (Laptop) vs NVIDIA T500 Laptop GPU
Intel UHD Graphics 32EUs (Alder Lake) ► remove from comparison
Die Intel Xe Graphics 32 EUS (Alder Lake) ist eine Prozessorgrafikkarte, die Anfang 2023 vorgestellt wurde. Sie basiert auf die Xe Architektur (Gen12) und bietet in Alder Lake CPUs nur 32 der 96 verbauten Execution Units (EUs). Die GPU wird im verbesserten 10nm Verfahren (Intel 7) bei Intel gefertigt. Die Rohleistung ist vergleichbar mit der Radeon RX Vega 6 (in Ryzen 5000 CPUs), jedoch ist die Spieleleistung geringer durch den schwächeren Treibersupport (in 2022). Nur anspruchslose Spiele wie Dota 2 Reborn sind mit geringsten Settings flüssig spielbar (siehe unten).
NVIDIA Quadro RTX 6000 (Laptop) ► remove from comparison
The Nvidia Quadro RTX 6000 for laptops is a professional high-end graphics card for big and powerful laptops and mobile workstations. It is based on the same TU102 chip as the consumer GeForce RTX 2080 Ti . Compared to the desktop RTX 6000, the mobile variant offers lower clock speeds.
The Quadro GPUs offer certified drivers , which are optimized for stability and performance in professional applications (CAD, DCC, medical, prospection, and visualizing applications). The performance in these areas is therefore much better compared to corresponding consumer GPUs.
NVIDIA manufacturers the TU102 chip on a 12 nm FinFET process and includes features like Deep Learning Super Sampling (DLSS) and Real-Time Ray Tracing (RTRT), which should combine to create more realistic lighting effects than older GPUs based on the company's Pascal architecture (if the games support it). The Quadro RTX 6000 is also DisplayPort 1.4 ready, while there is also support for HDMI 2.0b, HDR, Simultaneous Multi-Projection (SMP) and H.265 video en/decoding (PlayReady 3.0).
Performance
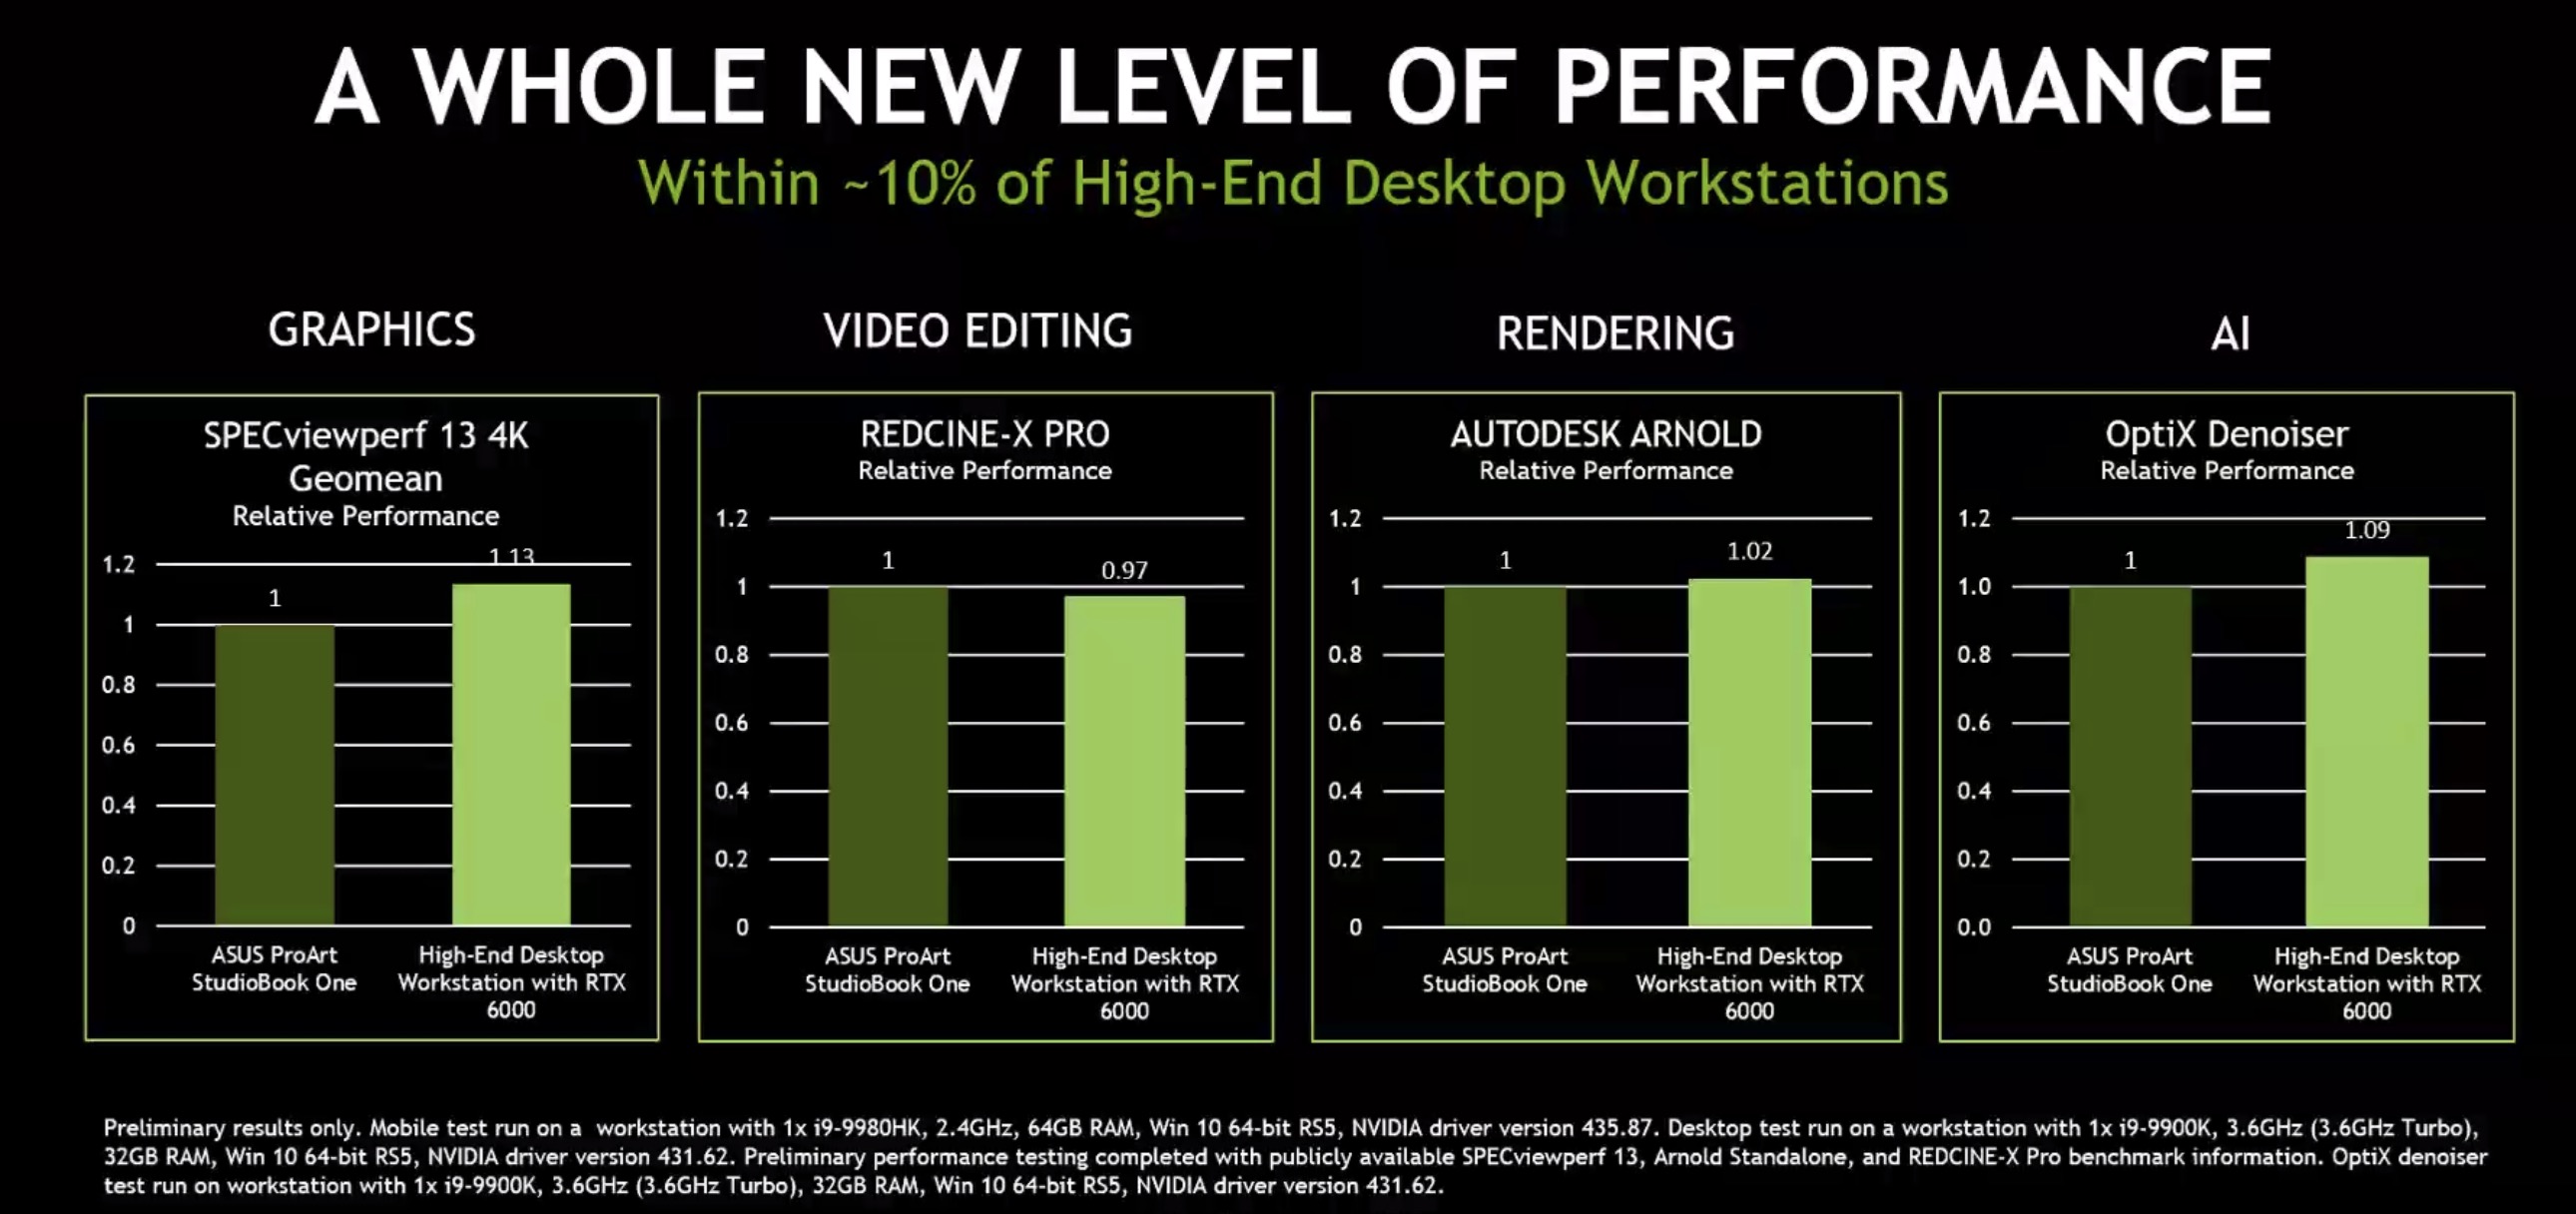
Due to the lower clock speeds, the mobile RTX 6000 lags slightly behind the desktop version with the same name. Nvidia states for example that a desktop system using the RTX 6000 is on average 13% faster in the SPECviewperf13 4k benchmark.
Due to the extremely high power consumption of 200 Watt (TDP), the mobile Quadro RTX 6000 needs an excellent cooling solution and will be used only in big laptops.
NVIDIA T500 Laptop GPU ► remove from comparison
The Nvidia T500 Mobile (formerly known as Quadro T500) for laptops is a professional mobile graphics card that is based on the Turing architecture (TU117 chip). It is based on the consumer GeForce MX450 and features the same 896 cores and a 64 Bit memory bus. Currently it is available with 2 or 4 GB graphics RAM (GDDR5 or GDDR6). The TDP ranges between 18 - 25 Watt depending on the variant. As the MX450, the T500 also supports PCIe 4.0. The chip is manufactured in 12nm FinFET at TSMC.
The Turing generation did not only introduce raytracing for the RTX cards, but also optimized the architecture of the cores and caches. According to Nvidia the CUDA cores offer now a concurrent execution of floating point and integer operations for increased performance in compute-heavy workloads of modern games. Furthermore, the caches were reworked (new unified memory architecture with twice the cache compared to Pascal). This leads to up to 50% more instructions per clock and a 40% more power efficient usage compared to Pascal. In contrary to the faster Quadro RTX cards, the T500 does not feature raytracing and Tensor cores.
Intel UHD Graphics 32EUs (Alder Lake) NVIDIA Quadro RTX 6000 (Laptop) NVIDIA T500 Laptop GPU Quadro Turing Series Codename Alder Lake Xe TU102 Pipelines 32 - unified 4608 - unified 896 - unified Core Speed 1250 MHz 1275 - 1455 (Boost) MHz 1365 - 1695 (Boost) MHz Shared Memory yes no no API DirectX 12_1, OpenGL 4.6 DirectX 12_1, OpenGL 4.6 DirectX 12_1, OpenGL 4.6 Architecture Turing Turing Memory Speed 14000 MHz 10000 MHz Memory Bus Width 384 Bit 64 Bit Memory Type GDDR6 GDDR5, GDDR6 Max. Amount of Memory 24 GB 4 GB Power Consumption 200 Watt 25 Watt Transistors 18.6 Billion technology 12 nm 12 nm Features NVLink, DLSS, Raytraycing, VR Ready, G-SYNC, Vulkan, Multi Monitor Notebook Size large medium sized Date of Announcement 04.09.2019 27.05.2019
CPU in UHD Graphics 32EUs GPU Base Speed GPU Boost / Turbo Intel Core i3-N305 8 x 1800 MHz, 15 W 1000 MHz 1250 MHz
Benchmarks Performance Rating - 3DMark 11 + Fire Strike + Time Spy - UHD Graphics 32EUs
0.9 pt (3%)
...
Intel UHD Graphics 32EUs (Alder Lake)
NVIDIA GeForce GTX 460 768MB
...
Performance Rating - 3DMark 11 + Fire Strike + Time Spy - T500 Laptop GPU
1.9 pt (6%)
...
...
3DMark - 3DMark Time Spy Score
min: 599 avg: 626 median: 613 (2%) max: 666 Points
11084 Points (32%)
GPU TDP ? TDP 200 W 6% 100%
min: 1627 avg: 1953 median: 1958 (6%) max: 2270 Points
GPU TDP ? TDP 18 W TDP 22 W TDP 25 W TDP 200 W 9% 15% 19% 16% 100%
3DMark - 3DMark Time Spy Graphics
min: 523 avg: 547 median: 536 (1%) max: 583 Points
min: 1554 avg: 1814 median: 1787.5 (5%) max: 2127 Points
GPU TDP ? TDP 18 W TDP 22 W TDP 25 W 49% 80% 100% 84%
3DMark - 3DMark Ice Storm Unlimited Graphics
min: 64090 avg: 76155 median: 76154.5 (9%) max: 88219 Points
3DMark - 3DMark Ice Storm Extreme Graphics
min: 38285 avg: 38839 median: 38839 (5%) max: 39393 Points
3DMark - 3DMark Cloud Gate Score
min: 7939 avg: 10785 median: 11402.5 (12%) max: 12397 Points
min: 15562 avg: 15975 median: 15851 (17%) max: 16513 Points
GPU TDP ? TDP 22 W TDP 25 W 71% 96% 100%
3DMark - 3DMark Cloud Gate Graphics
min: 10945 avg: 12633 median: 12687 (3%) max: 14214 Points
min: 22719 avg: 24657 median: 23453 (6%) max: 27800 Points
GPU TDP ? TDP 22 W TDP 25 W 67% 100% 97%
3DMark - 3DMark Fire Strike Standard Score
min: 1574 avg: 1726 median: 1733 (3%) max: 1862 Points
min: 3406 avg: 4047 median: 3973.5 (7%) max: 4833 Points
GPU TDP ? TDP 18 W TDP 22 W TDP 25 W 54% 78% 100% 83%
3DMark - 3DMark Fire Strike Standard Graphics
min: 1736 avg: 1880 median: 1894.5 (2%) max: 1995 Points
min: 3696 avg: 4322 median: 4224.5 (5%) max: 5141 Points
GPU TDP ? TDP 18 W TDP 22 W TDP 25 W 55% 80% 100% 82%
3DMark - 3DMark Ice Storm Graphics
min: 53717 avg: 54586 median: 54586 (7%) max: 55455 Points
80696 Points (10%)
GPU TDP ? TDP 22 W 68% 100%
3DMark 11 - 3DM11 Performance Score
min: 2390 avg: 2817 median: 2920 (4%) max: 3037 Points
min: 6293 avg: 7692 median: 8132 (11%) max: 8212 Points
GPU TDP ? TDP 18 W TDP 22 W TDP 25 W 47% 77% 99% 100%
3DMark 11 - 3DM11 Performance GPU
min: 2194 avg: 2527 median: 2612 (2%) max: 2688 Points
min: 6767 avg: 7808 median: 7995.5 (7%) max: 8475 Points
GPU TDP ? TDP 18 W TDP 22 W TDP 25 W 46% 84% 100% 98%
3DMark Vantage + Intel UHD Graphics 32EUs (Alder Lake) 3DMark Vantage - 3DM Vant. Perf. total
min: 7913 avg: 9108 median: 9462 (3%) max: 9948 Points
3DM Vant. Perf. GPU no PhysX + Intel UHD Graphics 32EUs (Alder Lake) 3DMark Vantage - 3DM Vant. Perf. GPU no PhysX
min: 6818 avg: 7570 median: 7729 (4%) max: 8163 Points
3DMark 06 3DMark 06 - Standard 1280x1024 + Intel UHD Graphics 32EUs (Alder Lake)
min: 9971 avg: 12006 median: 12006 (16%) max: 14041 Points
3DMark 06 - Standard 1280x1024 + NVIDIA T500 Laptop GPU
31133 Points (41%)
GPU TDP ? TDP 22 W 39% 100%
Unigine Valley 1.0 - Unigine Valley 1.0 DX
min: 5.7 avg: 5.9 median: 5.9 (2%) max: 6.1 fps
SPECviewperf 13 specvp13 sw-04 + NVIDIA Quadro RTX 6000 (Laptop) SPECviewperf 13 - specvp13 sw-04
217 fps (58%)
specvp13 sw-04 + NVIDIA T500 Laptop GPU
min: 64.9 avg: 80.7 median: 82.1 (22%) max: 93.6 fps
GPU TDP ? TDP 18 W TDP 22 W TDP 25 W TDP 200 W 43% 37% 39% 30% 100%
specvp13 3dsmax-06 + NVIDIA Quadro RTX 6000 (Laptop) SPECviewperf 13 - specvp13 3dsmax-06
217 fps (38%)
specvp13 3dsmax-06 + NVIDIA T500 Laptop GPU
min: 45.15 avg: 51 median: 50.4 (9%) max: 57.9 fps
GPU TDP ? TDP 18 W TDP 22 W TDP 25 W TDP 200 W 27% 22% 24% 21% 100%
specvp13 snx-03 + NVIDIA T500 Laptop GPU SPECviewperf 13 - specvp13 snx-03
min: 71.2 avg: 79.2 median: 77.5 (9%) max: 90.8 fps
GPU TDP ? TDP 18 W TDP 22 W TDP 25 W 100% 78% 91% 80%
specvp13 showcase-02 + NVIDIA T500 Laptop GPU SPECviewperf 13 - specvp13 showcase-02
min: 16.01 avg: 18.9 median: 16.9 (4%) max: 23.87 fps
GPU TDP ? TDP 18 W TDP 22 W 100% 71% 67%
specvp13 medical-02 + NVIDIA T500 Laptop GPU SPECviewperf 13 - specvp13 medical-02
min: 24.84 avg: 29.6 median: 28.7 (6%) max: 36.14 fps
GPU TDP ? TDP 18 W TDP 22 W TDP 25 W 100% 73% 86% 69%
specvp13 maya-05 + NVIDIA T500 Laptop GPU SPECviewperf 13 - specvp13 maya-05
min: 48.47 avg: 53.5 median: 51.9 (6%) max: 62 fps
GPU TDP ? TDP 18 W TDP 22 W TDP 25 W 100% 81% 86% 78%
specvp13 energy-02 + NVIDIA T500 Laptop GPU SPECviewperf 13 - specvp13 energy-02
min: 8.57 avg: 9.6 median: 8.7 (3%) max: 12.41 fps
GPU TDP ? TDP 18 W TDP 22 W TDP 25 W 100% 69% 71% 69%
specvp13 creo-02 + NVIDIA T500 Laptop GPU SPECviewperf 13 - specvp13 creo-02
min: 55.8 avg: 62.1 median: 59.2 (9%) max: 74.3 fps
GPU TDP ? TDP 18 W TDP 22 W TDP 25 W 100% 77% 83% 75%
specvp13 catia-05 + NVIDIA T500 Laptop GPU SPECviewperf 13 - specvp13 catia-05
min: 81.9 avg: 88.6 median: 88.3 (10%) max: 95.8 fps
GPU TDP ? TDP 18 W TDP 22 W TDP 25 W 100% 88% 97% 85%
SPECviewperf 2020 specvp2020 solidworks-05 1080p + NVIDIA T500 Laptop GPU SPECviewperf 2020 - specvp2020 solidworks-05 1080p
min: 37.82 avg: 40.2 median: 39.1 (8%) max: 43.59 fps
GPU TDP ? TDP 18 W TDP 25 W 100% 90% 87%
specvp2020 snx-04 1080p + NVIDIA T500 Laptop GPU SPECviewperf 2020 - specvp2020 snx-04 1080p
min: 66.2 avg: 76 median: 68.8 (11%) max: 93.1 fps
GPU TDP ? TDP 18 W TDP 25 W 100% 74% 71%
specvp2020 medical-03 1080p + NVIDIA T500 Laptop GPU SPECviewperf 2020 - specvp2020 medical-03 1080p
min: 10.73 avg: 12.1 median: 11 (8%) max: 14.74 fps
GPU TDP ? TDP 18 W TDP 25 W 100% 74% 73%
specvp2020 maya-06 1080p + NVIDIA T500 Laptop GPU SPECviewperf 2020 - specvp2020 maya-06 1080p
min: 59 avg: 65.5 median: 59.3 (9%) max: 78.1 fps
GPU TDP ? TDP 18 W TDP 25 W 100% 76% 76%
specvp2020 energy-03 1080p + NVIDIA T500 Laptop GPU SPECviewperf 2020 - specvp2020 energy-03 1080p
min: 8.62 avg: 9.7 median: 8.7 (7%) max: 11.96 fps
GPU TDP ? TDP 18 W TDP 25 W 100% 72% 72%
specvp2020 creo-03 1080p + NVIDIA T500 Laptop GPU SPECviewperf 2020 - specvp2020 creo-03 1080p
min: 29.28 avg: 34.7 median: 32.7 (16%) max: 41.95 fps
GPU TDP ? TDP 18 W TDP 25 W 100% 70% 78%
specvp2020 catia-06 1080p + NVIDIA T500 Laptop GPU SPECviewperf 2020 - specvp2020 catia-06 1080p
min: 16.48 avg: 19.2 median: 18 (12%) max: 23.22 fps
GPU TDP ? TDP 18 W TDP 25 W 100% 77% 71%
specvp2020 3dsmax-07 1080p + NVIDIA T500 Laptop GPU SPECviewperf 2020 - specvp2020 3dsmax-07 1080p
min: 19.56 avg: 23.3 median: 21.6 (10%) max: 28.9 fps
GPU TDP ? TDP 18 W TDP 25 W 100% 75% 68%
Cinebench R10 Cinebench R10 Shading (32bit) + Intel UHD Graphics 32EUs (Alder Lake) Cinebench R10 - Cinebench R10 Shading (32bit)
min: 5716 avg: 7533 median: 6964 (5%) max: 9920 Points
Cinebench R11.5 Cinebench R11.5 OpenGL 64 Bit + Intel UHD Graphics 32EUs (Alder Lake) Cinebench R11.5 - Cinebench R11.5 OpenGL 64 Bit
min: 28.92 avg: 40.1 median: 45.3 (16%) max: 46 fps
Cinebench R11.5 OpenGL 64 Bit + NVIDIA T500 Laptop GPU
156.6 fps (54%)
GPU TDP ? TDP 22 W 26% 100%
Cinebench R15 + Intel UHD Graphics 32EUs (Alder Lake) Cinebench R15 - Cinebench R15 OpenGL 64 Bit
min: 40.69 avg: 54.2 median: 58.6 (3%) max: 58.91 fps
Cinebench R15 OpenGL 64 Bit + NVIDIA T500 Laptop GPU
min: 134 avg: 168.8 median: 173 (10%) max: 195 fps
GPU TDP ? TDP 18 W TDP 22 W TDP 25 W 43% 69% 100% 79%
Cinebench R15 OpenGL Ref. Match 64 Bit + Intel UHD Graphics 32EUs (Alder Lake) Cinebench R15 - Cinebench R15 OpenGL Ref. Match 64 Bit
97.8 % (98%)
Cinebench R15 OpenGL Ref. Match 64 Bit + NVIDIA T500 Laptop GPU
99.6 % (100%)
GPU TDP ? TDP 18 W TDP 22 W TDP 25 W 99% 100% 100% 100%
GFXBench - GFXBench Car Chase Offscreen
119 fps (13%)
GFXBench 3.1 - GFXBench Manhattan ES 3.1 Offscreen
183 fps (4%)
GFXBench 3.0 - GFXBench 3.0 Manhattan Offscreen
236 fps (14%)
GFXBench (DX / GLBenchmark) 2.7 + NVIDIA T500 Laptop GPU GFXBench (DX / GLBenchmark) 2.7 - GFXBench T-Rex HD Offscreen C24Z16
503 fps (4%)
Basemark GPU 1.2 - Basemark GPU 1.2 Vulkan Official Medium Offscreen 1080
min: 72.1 avg: 88.4 median: 88.4 (1%) max: 104.6 fps
Basemark GPU 1.2 - Basemark GPU 1.2 Vulkan Official High Offscreen 2160
5.6 fps (1%)
Geekbench 6.2 - Geekbench 6.2 GPU OpenCL
min: 5031 avg: 5954 median: 6203.5 (2%) max: 6378 Points
Geekbench 6.2 - Geekbench 6.2 GPU Vulkan
min: 6193 avg: 6857 median: 6978 (2%) max: 7279 Points
LuxMark v2.0 64Bit - LuxMark v2.0 Room GPU
min: 232 avg: 275 median: 275 (1%) max: 318 Samples/s
653 Samples/s (3%)
GPU TDP ? TDP 22 W 42% 100%
LuxMark v2.0 64Bit - LuxMark v2.0 Sala GPU
min: 728 avg: 748 median: 748 (1%) max: 768 Samples/s
1976 Samples/s (3%)
GPU TDP ? TDP 22 W 38% 100%
ComputeMark v2.1 - ComputeMark v2.1 Result
min: 1042 avg: 1099 median: 1098.5 (1%) max: 1155 Points
4734 Points (5%)
GPU TDP ? TDP 22 W 23% 100%
Power Consumption - Furmark Stress Test Power Consumption - external Monitor *
min: 17.8 avg: 21.7 median: 21.5 (3%) max: 26.1 Watt
min: 45.1 avg: 47.1 median: 47.1 (7%) max: 49 Watt
GPU TDP ? TDP 18 W 103% 100%
Power Consumption - The Witcher 3 Power Consumption - external Monitor *
min: 21.5 avg: 23.1 median: 23.1 (3%) max: 24.7 Watt
min: 36.6 avg: 43.7 median: 43.7 (6%) max: 50.8 Watt
GPU TDP ? TDP 18 W 101% 100%
Power Consumption - Witcher 3 Power Consumption *
min: 26.6 avg: 27.4 median: 27.4 (6%) max: 28.2 Watt
min: 37.1 avg: 49.9 median: 53 (12%) max: 59.6 Watt
GPU TDP ? TDP 18 W TDP 22 W 106% 106% 100%
Power Consumption - Witcher 3 ultra Power Efficiency
0.3 fps per Watt (24%)
min: 0.3674 avg: 0.4 median: 0.4 (38%) max: 0.4555 fps per Watt
GPU TDP ? TDP 18 W TDP 22 W 75% 100% 81%
Power Consumption - Witcher 3 ultra Power Efficiency - external Monitor
min: 0.439 avg: 0.5 median: 0.5 (37%) max: 0.4617 fps per Watt
GPU TDP ? TDP 18 W 95% 100%
Emissions Witcher 3 Fan Noise + NVIDIA T500 Laptop GPU Emissions - Witcher 3 Fan Noise
min: 36.1 avg: 38.1 median: 38.1 (61%) max: 40.1 dB(A)
GPU TDP ? TDP 22 W 90% 100%
Average Benchmarks Intel UHD Graphics 32EUs (Alder Lake) → 100% n=1 Average Benchmarks NVIDIA Quadro RTX 6000 (Laptop) → 1808% n=1 Average Benchmarks NVIDIA T500 Laptop GPU → 319% n=1
- Range of benchmark values for this graphics card
- Average benchmark values for this graphics card
* Smaller numbers mean a higher performance
1 This benchmark is not used for the average calculation
Game Benchmarks The following benchmarks stem from our benchmarks of review laptops. The performance depends on the used graphics memory, clock rate, processor, system settings, drivers, and operating systems. So the results don't have to be representative for all laptops with this GPU. For detailed information on the benchmark results, click on the fps number.
100%
UHD Graphics 32EUs:
37 [X] Maxtang MTN-ALN50 Intel Core i3-N305 1.8GHz
UHD Graphics 32EUs
min:
8.84 fps, P0.1:
8.99 fps, P1:
22.3 fps, max:
263 fps
fps
100%
UHD Graphics 32EUs:
26.7 [X] Maxtang MTN-ALN50 Intel Core i3-N305 1.8GHz
UHD Graphics 32EUs
min:
7.15 fps, P0.1:
8.25 fps, P1:
14.6 fps, max:
101.8 fps
fps
100%
UHD Graphics 32EUs:
24 [X] Maxtang MTN-ALN50 Intel Core i3-N305 1.8GHz
UHD Graphics 32EUs
min:
6.98 fps, P0.1:
7 fps, P1:
14.5 fps, max:
84.7 fps
fps
100%
UHD Graphics 32EUs:
16.9 fps
100%
UHD Graphics 32EUs:
11.9 fps
100%
UHD Graphics 32EUs:
10.4 fps
100%
UHD Graphics 32EUs:
7.7 fps
100%
UHD Graphics 32EUs:
27.1 fps
100%
UHD Graphics 32EUs:
19.9 fps
100%
UHD Graphics 32EUs:
13 fps
100%
UHD Graphics 32EUs:
11.4 fps
100%
UHD Graphics 32EUs:
11.3 fps
100%
UHD Graphics 32EUs:
6.4 fps
100%
UHD Graphics 32EUs:
5.3 fps
100%
UHD Graphics 32EUs:
6.9 [X] Asus BR1402FG 2.01
Intel Core i3-N305 1.8GHz
UHD Graphics 32EUs
min:
2.25 fps, max:
16.4 fps
7.3 ~ 7 fps
100%
UHD Graphics 32EUs:
5.5 fps
100%
UHD Graphics 32EUs:
16.1 fps
100%
UHD Graphics 32EUs:
14.8 fps
100%
UHD Graphics 32EUs:
11.7 fps
100%
UHD Graphics 32EUs:
11.1 fps
100%
UHD Graphics 32EUs:
14.1 fps
100%
UHD Graphics 32EUs:
11.2 fps
100%
UHD Graphics 32EUs:
27.3 [X] Maxtang MTN-ALN50 800660
Intel Core i3-N305 1.8GHz
UHD Graphics 32EUs
min:
14.7 fps, max:
57.7 fps
fps
100%
UHD Graphics 32EUs:
21.1 [X] Maxtang MTN-ALN50 800660
Intel Core i3-N305 1.8GHz
UHD Graphics 32EUs
min:
14.5 fps, max:
37.1 fps
fps
100%
UHD Graphics 32EUs:
15.9 [X] Maxtang MTN-ALN50 800660
Intel Core i3-N305 1.8GHz
UHD Graphics 32EUs
min:
10.9 fps, max:
30.9 fps
fps
100%
UHD Graphics 32EUs:
46 [X] Maxtang MTN-ALN50 874931
Intel Core i3-N305 1.8GHz
UHD Graphics 32EUs
min:
35 fps, P1:
34 fps, max:
52 fps
fps
100%
UHD Graphics 32EUs:
18.3 [X] Maxtang MTN-ALN50 874931
Intel Core i3-N305 1.8GHz
UHD Graphics 32EUs
min:
14 fps, P1:
14 fps, max:
20 fps
fps
100%
UHD Graphics 32EUs:
16.5 [X] Maxtang MTN-ALN50 874931
Intel Core i3-N305 1.8GHz
UHD Graphics 32EUs
min:
13 fps, P1:
13 fps, max:
18 fps
fps
100%
UHD Graphics 32EUs:
10.5 [X] Maxtang MTN-ALN50 874931
Intel Core i3-N305 1.8GHz
UHD Graphics 32EUs
min:
7 fps, P1:
8 fps, max:
12 fps
fps
T500 Laptop GPU:
10.9 15 ~ 13 fps
100%
UHD Graphics 32EUs:
35.4 fps
282%
T500 Laptop GPU:
100 fps
100%
UHD Graphics 32EUs:
18.8 fps
318%
T500 Laptop GPU:
59.8 fps
100%
UHD Graphics 32EUs:
14 fps
314%
T500 Laptop GPU:
44 fps
100%
UHD Graphics 32EUs:
8.7 fps
337%
T500 Laptop GPU:
29.3 fps
100%
UHD Graphics 32EUs:
21 fps
100%
UHD Graphics 32EUs:
11 fps
100%
UHD Graphics 32EUs:
10 fps
100%
UHD Graphics 32EUs:
9 fps
100%
UHD Graphics 32EUs:
16.5 fps
100%
UHD Graphics 32EUs:
9.2 fps
100%
UHD Graphics 32EUs:
8.6 fps
100%
UHD Graphics 32EUs:
32.5 [X] Zotac ZBOX PI430AJ 1.47.22.14 D3D12
Intel Core i3-N300 GHz
UHD Graphics 32EUs
min:
5 fps, P1:
9.8 fps, max:
142 fps
39.2 [X] Asus BR1402FG 1.47.22.14 D3D12
Intel Core i3-N305 1.8GHz
UHD Graphics 32EUs
min:
8.9 fps, P1:
12.8 fps, max:
240 fps
41.3 [X] Maxtang MTN-ALN50 1.47.22.14 D3D12
Intel Core i3-N305 1.8GHz
UHD Graphics 32EUs
min:
9.9 fps, P1:
13.1 fps, max:
216 fps
44.1 ~ 39 fps
285%
T500 Laptop GPU:
108 113 ~ 111 fps
100%
UHD Graphics 32EUs:
13.5 [X] Maxtang MTN-ALN50 1.47.22.14 D3D12
Intel Core i3-N305 1.8GHz
UHD Graphics 32EUs
min:
5 fps, P1:
5.14 fps, max:
149.3 fps
13.7 [X] Zotac ZBOX PI430AJ 1.47.22.14 D3D12
Intel Core i3-N300 GHz
UHD Graphics 32EUs
min:
5 fps, P1:
5.33 fps, max:
107.4 fps
15.2 [X] Asus BR1402FG 1.47.22.14 D3D12
Intel Core i3-N305 1.8GHz
UHD Graphics 32EUs
min:
5 fps, P1:
5.2 fps, max:
176.4 fps
17.2 ~ 15 fps
100%
UHD Graphics 32EUs:
11.5 [X] Zotac ZBOX PI430AJ 1.47.22.14 D3D12
Intel Core i3-N300 GHz
UHD Graphics 32EUs
min:
5 fps, P1:
5 fps, max:
125.8 fps
13.4 [X] Asus BR1402FG 1.47.22.14 D3D12
Intel Core i3-N305 1.8GHz
UHD Graphics 32EUs
min:
5 fps, P1:
5 fps, max:
198.8 fps
13.5 [X] Maxtang MTN-ALN50 1.47.22.14 D3D12
Intel Core i3-N305 1.8GHz
UHD Graphics 32EUs
min:
5 fps, P1:
5 fps, max:
181.9 fps
13.8 ~ 13 fps
100%
UHD Graphics 32EUs:
14.5 [X] Maxtang MTN-ALN50 1.47.22.14 D3D12
Intel Core i3-N305 1.8GHz
UHD Graphics 32EUs
min:
5 fps, P1:
5 fps, max:
232 fps
fps
100%
UHD Graphics 32EUs:
20 21 ~ 21 fps
248%
T500 Laptop GPU:
31 72 ~ 52 fps
100%
UHD Graphics 32EUs:
9 10 ~ 10 fps
300%
T500 Laptop GPU:
25 34 ~ 30 fps
100%
UHD Graphics 32EUs:
9 9 ~ 9 fps
311%
T500 Laptop GPU:
22 33 ~ 28 fps
100%
UHD Graphics 32EUs:
8 8 ~ 8 fps
338%
T500 Laptop GPU:
21 32 ~ 27 fps
100%
UHD Graphics 32EUs:
16 38.1 [X] Maxtang MTN-ALN50 Intel Core i3-N305 1.8GHz
UHD Graphics 32EUs
min:
11.2 fps, P0.1:
17.5 fps, P1:
20.5 fps, max:
132.2 fps
38.7 ~ 31 fps
100%
UHD Graphics 32EUs:
12 25.1 ~ 19 fps
100%
UHD Graphics 32EUs:
12.3 [X] Maxtang MTN-ALN50 Intel Core i3-N305 1.8GHz
UHD Graphics 32EUs
min:
4.16 fps, P0.1:
5.96 fps, P1:
6.76 fps, max:
52.8 fps
13 ~ 13 fps
100%
UHD Graphics 32EUs:
5.4 [X] Asus BR1402FG Intel Core i3-N305 1.8GHz
UHD Graphics 32EUs
min:
4 fps, P1:
5 fps, max:
6 fps
5.5 [X] Maxtang MTN-ALN50 Intel Core i3-N305 1.8GHz
UHD Graphics 32EUs
min:
3.3 fps, P0.1:
3.31 fps, P1:
3.4 fps, max:
13.5 fps
7 ~ 6 fps
100%
UHD Graphics 32EUs:
35.7 [X] Zotac ZBOX PI430AJ Intel Core i3-N300 GHz
UHD Graphics 32EUs
min:
2.51 fps, P1:
15.9 fps, max:
59.5 fps
50.8 [X] Asus BR1402FG Intel Core i3-N305 1.8GHz
UHD Graphics 32EUs
min:
2.27 fps, P1:
23.8 fps, max:
88.3 fps
55.6 [X] Maxtang MTN-ALN50 Intel Core i3-N305 1.8GHz
UHD Graphics 32EUs
min:
14.1 fps, P1:
35.7 fps, max:
87.7 fps
61.9 ~ 51 fps
276%
T500 Laptop GPU:
133 148 ~ 141 fps
226%
T500 Laptop GPU:
76.1 118 ~ 97 fps
100%
UHD Graphics 32EUs:
9.4 fps
100%
UHD Graphics 32EUs:
4 fps
528%
T500 Laptop GPU:
19 23.2 ~ 21 fps
Average Gaming Intel UHD Graphics 32EUs (Alder Lake) → 100% Average Gaming 30-70 fps → 100%
Average Gaming NVIDIA T500 Laptop GPU → 296% Average Gaming 30-70 fps → 311%
Intel UHD Graphics 32EUs (Alder Lake) low med. high ultra QHD 4K Prince of Persia The Lost Crown 37 26.7 24 The Finals 16.9 11.9 10.4 7.74 Total War Pharaoh 27.1 19.9 13 11.4 Counter-Strike 2 11.3 6.38 5.29 Cyberpunk 2077 2.1 Phantom Liberty 7 5.53 Diablo 4 16.1 14.8 11.7 11.1 The Witcher 3 v4.00 14.1 11.2 GRID Legends 27.3 21.1 15.9 F1 2021 46 18.3 16.5 10.5 F1 2020 35.4 18.8 14 8.7 Far Cry New Dawn 21 11 10 9 Shadow of the Tomb Raider 16.5 9.2 8.6 Strange Brigade 39 15 13 14.5 Far Cry 5 21 10 9 8 X-Plane 11.11 23 18 16 Final Fantasy XV Benchmark 18 9 7 Dota 2 Reborn 62 45 27 25 The Witcher 3 31 19 13 6 GTA V 51 43 9.43 3.98 < 30 fps < 60 fps < 120 fps ≥ 120 fps 12 5 1 16 3 17 12
NVIDIA T500 Laptop GPU low med. high ultra QHD 4K Cyberpunk 2077 1.0 31 17 13 10.1 Immortals Fenyx Rising 65 35 29 24 Star Wars Squadrons 54.7 47.2 42.4 F1 2020 100 59.8 44 29.3 Strange Brigade 111 34 29 25 17.9 9.6 Far Cry 5 52 30 28 27 X-Plane 11.11 70 63 55 29.4 Final Fantasy XV Benchmark 50 24 17 12.4 5.73 Dota 2 Reborn 128 118 90 79 27.7 The Witcher 3 96 52 29 20 GTA V 141 97 42 21 13.2 14 < 30 fps < 60 fps < 120 fps ≥ 120 fps 3 5 2 2 6 3 6 4 1 7 1 1 3 5
For more games that might be playable and a list of all games and graphics cards visit our Gaming List
v1.28
log 02. 09:49:43
#0 checking url part for id 12292 +0s ... 0s
#1 checking url part for id 9923 +0s ... 0s
#2 checking url part for id 10605 +0s ... 0s
#3 redirected to Ajax server, took 1719906583 +0s ... 0s
#4 did not recreate cache, as it is less than 5 days old! Created at Mon, 01 Jul 2024 05:16:07 +0200 +0s ... 0s
#5 composed specs +0.028s ... 0.029s
#6 did output specs +0s ... 0.029s
#7 start showIntegratedCPUs +0s ... 0.029s
#8 getting avg benchmarks for device 12292 +0.03s ... 0.058s
#9 got single benchmarks 12292 +0.007s ... 0.066s
#10 getting avg benchmarks for device 9923 +0s ... 0.066s
#11 got single benchmarks 9923 +0.002s ... 0.069s
#12 getting avg benchmarks for device 10605 +0.004s ... 0.072s
#13 got single benchmarks 10605 +0.007s ... 0.08s
#14 got avg benchmarks for devices +0s ... 0.08s
#15 min, max, avg, median took s +0.037s ... 0.117s
#16 before gaming benchmark output +0s ... 0.117s
#17 Got 224 rows for game benchmarks. +0.015s ... 0.132s
#18 composed SQL query for gamebenchmarks +0s ... 0.132s
#19 got data and put it in $dataArray +0.001s ... 0.133s
#20 benchmarks composed for output. +0.007s ... 0.141s
#21 calculated avg scores. +0s ... 0.141s
#22 return log +0s ... 0.141s
Please share our article, every link counts!
Redaktion, 2017-09- 8 (Update: 2023-07- 1)
 Deutsch
 English
 Español
 Français
 Italiano
 Nederlands
 Polski
 Português
 Русский
 Türkçe
 Svenska
 Chinese
 Magyar