Intel UHD Graphics 32EUs (Alder Lake) vs NVIDIA Quadro RTX 6000 (Laptop) vs NVIDIA Quadro RTX 5000 Max-Q
Intel UHD Graphics 32EUs (Alder Lake) ► remove from comparison
Die Intel Xe Graphics 32 EUS (Alder Lake) ist eine Prozessorgrafikkarte, die Anfang 2023 vorgestellt wurde. Sie basiert auf die Xe Architektur (Gen12) und bietet in Alder Lake CPUs nur 32 der 96 verbauten Execution Units (EUs). Die GPU wird im verbesserten 10nm Verfahren (Intel 7) bei Intel gefertigt. Die Rohleistung ist vergleichbar mit der Radeon RX Vega 6 (in Ryzen 5000 CPUs), jedoch ist die Spieleleistung geringer durch den schwächeren Treibersupport (in 2022). Nur anspruchslose Spiele wie Dota 2 Reborn sind mit geringsten Settings flüssig spielbar (siehe unten).
NVIDIA Quadro RTX 6000 (Laptop) ► remove from comparison
The Nvidia Quadro RTX 6000 for laptops is a professional high-end graphics card for big and powerful laptops and mobile workstations. It is based on the same TU102 chip as the consumer GeForce RTX 2080 Ti . Compared to the desktop RTX 6000, the mobile variant offers lower clock speeds.
The Quadro GPUs offer certified drivers , which are optimized for stability and performance in professional applications (CAD, DCC, medical, prospection, and visualizing applications). The performance in these areas is therefore much better compared to corresponding consumer GPUs.
NVIDIA manufacturers the TU102 chip on a 12 nm FinFET process and includes features like Deep Learning Super Sampling (DLSS) and Real-Time Ray Tracing (RTRT), which should combine to create more realistic lighting effects than older GPUs based on the company's Pascal architecture (if the games support it). The Quadro RTX 6000 is also DisplayPort 1.4 ready, while there is also support for HDMI 2.0b, HDR, Simultaneous Multi-Projection (SMP) and H.265 video en/decoding (PlayReady 3.0).
Performance
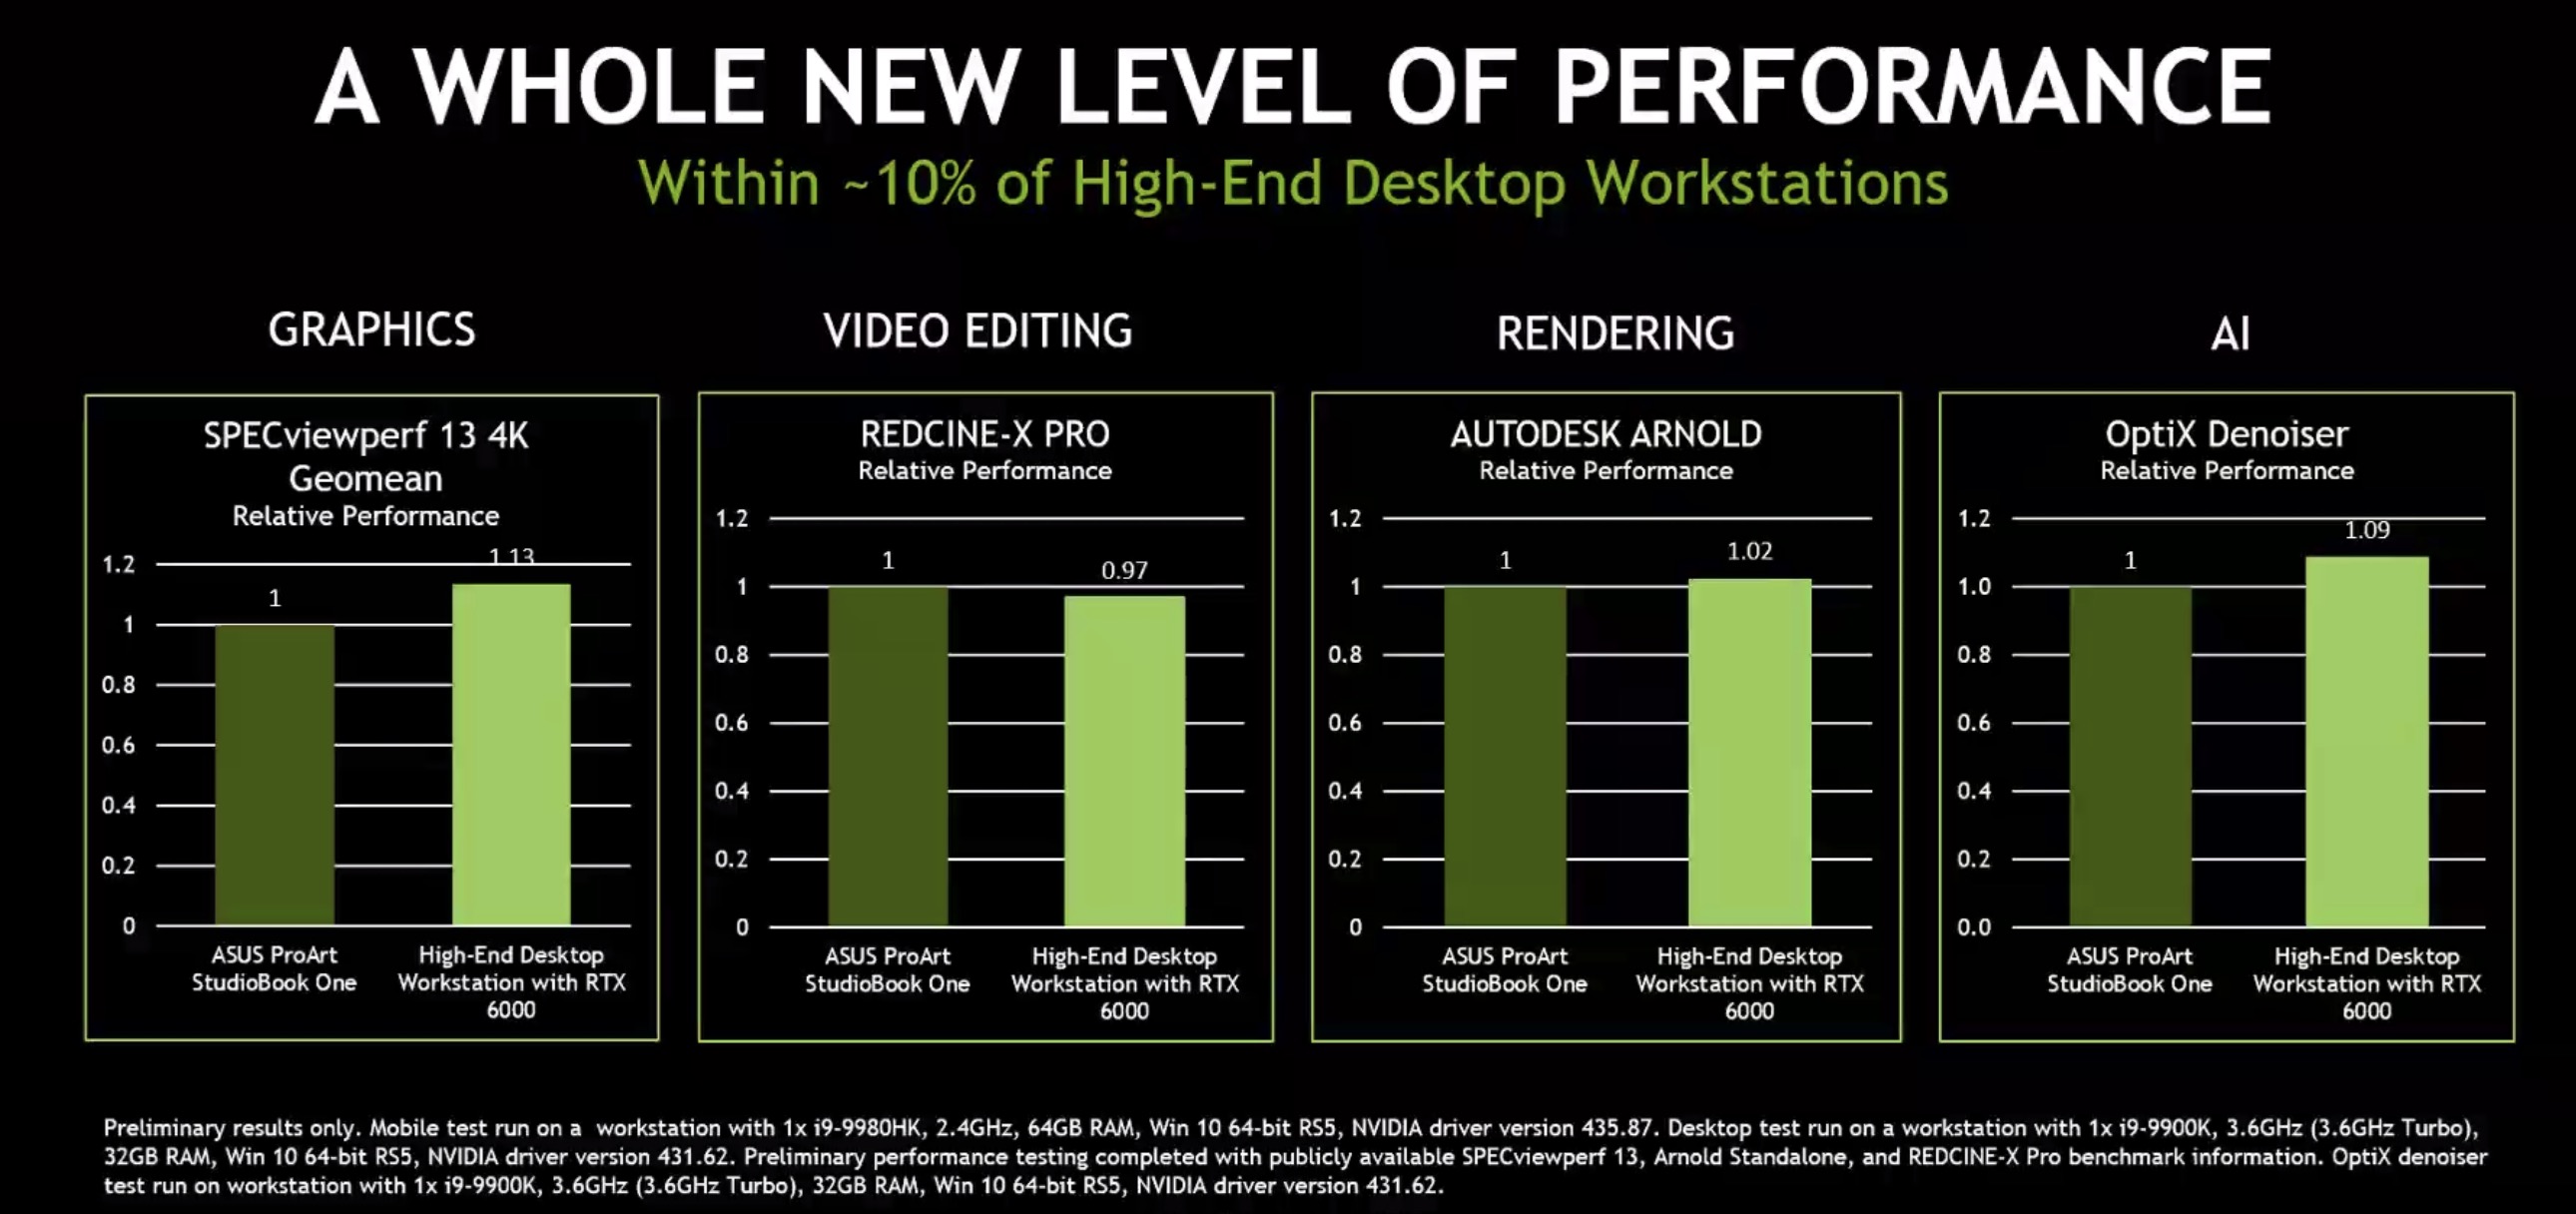
Due to the lower clock speeds, the mobile RTX 6000 lags slightly behind the desktop version with the same name. Nvidia states for example that a desktop system using the RTX 6000 is on average 13% faster in the SPECviewperf13 4k benchmark.
Due to the extremely high power consumption of 200 Watt (TDP), the mobile Quadro RTX 6000 needs an excellent cooling solution and will be used only in big laptops.
NVIDIA Quadro RTX 5000 Max-Q ► remove from comparison
The Nvidia Quadro RTX 5000 with Max-Q Design is a professional high-end graphics card for powerful laptops and mobile workstations. The Max-Q variants are lower clocked versions that are running more efficient and can be used in smaller chassis than the regular versions. It is based on the same TU104 chip as the consumer GeForce RTX 2080 Max-Q but offers more shaders (128 more). Compared to the desktop RTX 5000, the mobile variant offers lower clock speeds. There are different versions available with 90, 85 and 80 Watt TGP power consumption.
Model TGP (W) Base (MHz) Boost (MHz) Quadro RTX 5000 Desktop 230 1620 1815 Quadro RTX 5000 Mobile 150 1350 1770 Quadro RTX 5000 Mobile 110 1035 1545 Quadro RTX 5000 Max-Q 90 930 1455 Quadro RTX 5000 Max-Q 85 765 1395 Quadro RTX 5000 Max-Q 80 600 1350
The Quadro GPUs offer certified drivers , which are optimized for stability and performance in professional applications (CAD, DCC, medical, prospection, and visualizing applications). The performance in these areas is therefore much better compared to corresponding consumer GPUs.
NVIDIA manufacturers the TU104 chip on a 12 nm FinFET process and includes features like Deep Learning Super Sampling (DLSS) and Real-Time Ray Tracing (RTRT), which should combine to create more realistic lighting effects than older GPUs based on the company's Pascal architecture (if the games support it). The Quadro RTX 5000 is also DisplayPort 1.4 ready, while there is also support for HDMI 2.0b, HDR, Simultaneous Multi-Projection (SMP) and H.265 video en/decoding (PlayReady 3.0).
Performance
Compared to the regular Quadro RTX 5000 version, the Max-Q variants can be up to 27% slower (lower Turbo speeds) and therefore reach levels of the slower RTX 4000. Compared to consumer verisons, the Quadro variants have advantages due to the professional drivers and the large VRAM.
The still relatively high power consumption of the RTX5000 Max-Q makes the card most suited for big laptops.
Intel UHD Graphics 32EUs (Alder Lake) NVIDIA Quadro RTX 6000 (Laptop) NVIDIA Quadro RTX 5000 Max-Q Quadro Turing Series Codename Alder Lake Xe TU102 N19E-Q5 MAX-Q Pipelines 32 - unified 4608 - unified 3072 - unified Core Speed 1250 MHz 1275 - 1455 (Boost) MHz 600 - 930 - 1350 - 1455 (Boost) MHz Shared Memory yes no no API DirectX 12_1, OpenGL 4.6 DirectX 12_1, OpenGL 4.6 DirectX 12_1, OpenGL 4.6 Architecture Turing Turing Memory Speed 14000 MHz 14000 MHz Memory Bus Width 384 Bit 256 Bit Memory Type GDDR6 GDDR6 Max. Amount of Memory 24 GB 16 GB Power Consumption 200 Watt 80 - 90 Watt Transistors 18.6 Billion 13.6 Billion technology 12 nm 12 nm Features NVLink, DLSS, Raytraycing, VR Ready, G-SYNC, Vulkan, Multi Monitor NVLink, DLSS, Raytraycing, VR Ready, G-SYNC, Vulkan, Multi Monitor Notebook Size large large Date of Announcement 04.09.2019 27.05.2019
CPU in UHD Graphics 32EUs GPU Base Speed GPU Boost / Turbo Intel Core i3-N305 8 x 1800 MHz, 15 W 1000 MHz 1250 MHz
Benchmarks Performance Rating - 3DMark 11 + Fire Strike + Time Spy - UHD Graphics 32EUs
0.9 pt (3%)
...
Intel UHD Graphics 32EUs (Alder Lake)
NVIDIA GeForce GTX 460 768MB
...
Performance Rating - 3DMark 11 + Fire Strike + Time Spy - Quadro RTX 5000 Max-Q
9 pt (27%)
...
NVIDIA Quadro RTX 5000 Max-Q
...
3DMark - 3DMark Time Spy Score
min: 599 avg: 626 median: 613 (2%) max: 666 Points
11084 Points (32%)
GPU TDP ? TDP 200 W 6% 100%
min: 6801 avg: 7289 median: 7282.5 (21%) max: 7920 Points
GPU TDP ? TDP 80 W TDP 200 W 51% 63% 100%
3DMark - 3DMark Time Spy Graphics
min: 523 avg: 547 median: 536 (1%) max: 583 Points
min: 6999 avg: 7432 median: 7396 (20%) max: 7977 Points
GPU TDP ? TDP 80 W 79% 100%
3DMark - 3DMark Ice Storm Unlimited Graphics
min: 64090 avg: 76155 median: 76154.5 (9%) max: 88219 Points
min: 414147 avg: 428807 median: 433183 (49%) max: 439090 Points
GPU TDP ? TDP 80 W 57% 100%
3DMark - 3DMark Ice Storm Extreme Graphics
min: 38285 avg: 38839 median: 38839 (5%) max: 39393 Points
47453 Points (6%)
3DMark - 3DMark Cloud Gate Score
min: 7939 avg: 10785 median: 11402.5 (12%) max: 12397 Points
min: 25769 avg: 34615 median: 32096 (34%) max: 52005 Points
GPU TDP ? TDP 80 W 87% 100%
3DMark - 3DMark Cloud Gate Graphics
min: 10945 avg: 12633 median: 12687 (3%) max: 14214 Points
min: 50993 avg: 78524 median: 64768 (17%) max: 126073 Points
GPU TDP ? TDP 80 W 97% 100%
3DMark - 3DMark Fire Strike Standard Score
min: 1574 avg: 1726 median: 1733 (3%) max: 1862 Points
min: 16005 avg: 16773 median: 16600.5 (29%) max: 18226 Points
GPU TDP ? TDP 80 W 71% 100%
3DMark - 3DMark Fire Strike Standard Graphics
min: 1736 avg: 1880 median: 1894.5 (2%) max: 1995 Points
min: 18247 avg: 19825 median: 19790 (22%) max: 21115 Points
GPU TDP ? TDP 80 W 73% 100%
3DMark - 3DMark Ice Storm Graphics
min: 53717 avg: 54586 median: 54586 (7%) max: 55455 Points
min: 70493 avg: 94644 median: 94644 (11%) max: 118795 Points
3DMark 11 - 3DM11 Performance Score
min: 2390 avg: 2817 median: 2920 (4%) max: 3037 Points
min: 19250 avg: 21300 median: 20890 (29%) max: 23789 Points
GPU TDP ? TDP 80 W 73% 100%
3DMark 11 - 3DM11 Performance GPU
min: 2194 avg: 2527 median: 2612 (2%) max: 2688 Points
min: 24156 avg: 26602 median: 26465 (23%) max: 28524 Points
GPU TDP ? TDP 80 W 71% 100%
3DMark Vantage + Intel UHD Graphics 32EUs (Alder Lake) 3DMark Vantage - 3DM Vant. Perf. total
min: 7913 avg: 9108 median: 9462 (3%) max: 9948 Points
3DM Vant. Perf. total + NVIDIA Quadro RTX 5000 Max-Q
min: 52289 avg: 53221 median: 53221 (15%) max: 54153 Points
3DM Vant. Perf. GPU no PhysX + Intel UHD Graphics 32EUs (Alder Lake) 3DMark Vantage - 3DM Vant. Perf. GPU no PhysX
min: 6818 avg: 7570 median: 7729 (4%) max: 8163 Points
3DM Vant. Perf. GPU no PhysX + NVIDIA Quadro RTX 5000 Max-Q
min: 62319 avg: 62862 median: 62861.5 (36%) max: 63404 Points
3DMark 06 3DMark 06 - Standard 1280x1024 + Intel UHD Graphics 32EUs (Alder Lake)
min: 9971 avg: 12006 median: 12006 (16%) max: 14041 Points
3DMark 06 - Standard 1280x1024 + NVIDIA Quadro RTX 5000 Max-Q
min: 38739 avg: 40510 median: 40509.5 (53%) max: 42280 Points
Unigine Valley 1.0 - Unigine Valley 1.0 DX
min: 5.7 avg: 5.9 median: 5.9 (2%) max: 6.1 fps
94.6 fps (31%)
Unigine Heaven 3.0 - Unigine Heaven 3.0 DX 11
236.6 fps (78%)
Unigine Heaven 3.0 - Unigine Heaven 3.0 OpenGL
174.6 fps (77%)
Unigine Heaven 2.1 - Heaven 2.1 high
236.1 fps (44%)
SPECviewperf 12 + NVIDIA Quadro RTX 5000 Max-Q SPECviewperf 12 - specvp12 sw-03
min: 106.8 avg: 125.7 median: 122.8 (30%) max: 156.9 fps
GPU TDP ? TDP 80 W 100% 93%
specvp12 snx-02 + NVIDIA Quadro RTX 5000 Max-Q SPECviewperf 12 - specvp12 snx-02
min: 120.7 avg: 139.8 median: 138.4 (20%) max: 165 fps
GPU TDP ? TDP 80 W 100% 88%
specvp12 showcase-01 + NVIDIA Quadro RTX 5000 Max-Q SPECviewperf 12 - specvp12 showcase-01
min: 89 avg: 95.8 median: 96.5 (21%) max: 100.3 fps
GPU TDP ? TDP 80 W 100% 92%
specvp12 mediacal-01 + NVIDIA Quadro RTX 5000 Max-Q SPECviewperf 12 - specvp12 mediacal-01
min: 57.8 avg: 62.6 median: 62.7 (16%) max: 66.4 fps
GPU TDP ? TDP 80 W 100% 91%
specvp12 maya-04 + NVIDIA Quadro RTX 5000 Max-Q SPECviewperf 12 - specvp12 maya-04
min: 70.3 avg: 83.4 median: 81.6 (22%) max: 105.4 fps
GPU TDP ? TDP 80 W 100% 87%
specvp12 energy-01 + NVIDIA Quadro RTX 5000 Max-Q SPECviewperf 12 - specvp12 energy-01
min: 13.3 avg: 14.5 median: 14.3 (13%) max: 16.1 fps
GPU TDP ? TDP 80 W 100% 95%
specvp12 creo-01 + NVIDIA Quadro RTX 5000 Max-Q SPECviewperf 12 - specvp12 creo-01
min: 114.1 avg: 127 median: 125.2 (50%) max: 145.1 fps
GPU TDP ? TDP 80 W 100% 89%
specvp12 catia-04 + NVIDIA Quadro RTX 5000 Max-Q SPECviewperf 12 - specvp12 catia-04
min: 113.1 avg: 126.4 median: 123.6 (20%) max: 154.9 fps
GPU TDP ? TDP 80 W 100% 88%
specvp12 3dsmax-05 + NVIDIA Quadro RTX 5000 Max-Q SPECviewperf 12 - specvp12 3dsmax-05
min: 158.9 avg: 176.3 median: 180.9 (32%) max: 184.3 fps
GPU TDP ? TDP 80 W 100% 87%
SPECviewperf 13 specvp13 sw-04 + NVIDIA Quadro RTX 6000 (Laptop) SPECviewperf 13 - specvp13 sw-04
217 fps (58%)
specvp13 sw-04 + NVIDIA Quadro RTX 5000 Max-Q
min: 119.7 avg: 135.3 median: 134 (36%) max: 158.9 fps
GPU TDP ? TDP 80 W TDP 200 W 63% 55% 100%
specvp13 3dsmax-06 + NVIDIA Quadro RTX 6000 (Laptop) SPECviewperf 13 - specvp13 3dsmax-06
217 fps (38%)
specvp13 3dsmax-06 + NVIDIA Quadro RTX 5000 Max-Q
min: 157.3 avg: 174.8 median: 176.5 (31%) max: 181.8 fps
GPU TDP ? TDP 80 W TDP 200 W 82% 72% 100%
specvp13 snx-03 + NVIDIA Quadro RTX 5000 Max-Q SPECviewperf 13 - specvp13 snx-03
min: 244.1 avg: 287 median: 289.8 (32%) max: 306.1 fps
GPU TDP ? TDP 80 W 100% 83%
specvp13 showcase-02 + NVIDIA Quadro RTX 5000 Max-Q SPECviewperf 13 - specvp13 showcase-02
min: 89.2 avg: 95.2 median: 95.5 (21%) max: 98.7 fps
GPU TDP ? TDP 80 W 100% 93%
specvp13 medical-02 + NVIDIA Quadro RTX 5000 Max-Q SPECviewperf 13 - specvp13 medical-02
min: 79 avg: 89.8 median: 89.9 (19%) max: 102.5 fps
GPU TDP ? TDP 80 W 100% 99%
specvp13 maya-05 + NVIDIA Quadro RTX 5000 Max-Q SPECviewperf 13 - specvp13 maya-05
min: 179.5 avg: 206.4 median: 206 (23%) max: 231.3 fps
GPU TDP ? TDP 80 W 100% 85%
specvp13 energy-02 + NVIDIA Quadro RTX 5000 Max-Q SPECviewperf 13 - specvp13 energy-02
min: 35.39 avg: 37.3 median: 36.9 (12%) max: 39.92 fps
GPU TDP ? TDP 80 W 100% 94%
specvp13 creo-02 + NVIDIA Quadro RTX 5000 Max-Q SPECviewperf 13 - specvp13 creo-02
min: 181.9 avg: 217.7 median: 220.5 (32%) max: 238.4 fps
GPU TDP ? TDP 80 W 100% 82%
specvp13 catia-05 + NVIDIA Quadro RTX 5000 Max-Q SPECviewperf 13 - specvp13 catia-05
min: 186.9 avg: 222.1 median: 220.4 (24%) max: 259.7 fps
GPU TDP ? TDP 80 W 100% 82%
Cinebench R10 Cinebench R10 Shading (32bit) + Intel UHD Graphics 32EUs (Alder Lake) Cinebench R10 - Cinebench R10 Shading (32bit)
min: 5716 avg: 7533 median: 6964 (5%) max: 9920 Points
Cinebench R10 Shading (32bit) + NVIDIA Quadro RTX 5000 Max-Q
min: 6814 avg: 6821 median: 6819 (5%) max: 6830 Points
Cinebench R11.5 Cinebench R11.5 OpenGL 64 Bit + Intel UHD Graphics 32EUs (Alder Lake) Cinebench R11.5 - Cinebench R11.5 OpenGL 64 Bit
min: 28.92 avg: 40.1 median: 45.3 (16%) max: 46 fps
Cinebench R11.5 OpenGL 64 Bit + NVIDIA Quadro RTX 5000 Max-Q
min: 130.9 avg: 140.2 median: 140.2 (49%) max: 149.4 fps
Cinebench R15 + Intel UHD Graphics 32EUs (Alder Lake) Cinebench R15 - Cinebench R15 OpenGL 64 Bit
min: 40.69 avg: 54.2 median: 58.6 (3%) max: 58.91 fps
Cinebench R15 OpenGL 64 Bit + NVIDIA Quadro RTX 5000 Max-Q
min: 175.3 avg: 205.9 median: 210 (12%) max: 230 fps
GPU TDP ? TDP 80 W 90% 100%
Cinebench R15 OpenGL Ref. Match 64 Bit + Intel UHD Graphics 32EUs (Alder Lake) Cinebench R15 - Cinebench R15 OpenGL Ref. Match 64 Bit
97.8 % (98%)
Cinebench R15 OpenGL Ref. Match 64 Bit + NVIDIA Quadro RTX 5000 Max-Q
99.6 % (100%)
GPU TDP ? TDP 80 W 99% 100%
GFXBench - GFXBench 5.0 Aztec Ruins High Tier Offscreen
min: 138.7 avg: 153 median: 153 (28%) max: 167.2 fps
GFXBench - GFXBench 5.0 Aztec Ruins Normal Tier Offscreen
min: 343.2 avg: 383.1 median: 383.1 (28%) max: 422.9 fps
GFXBench - GFXBench Car Chase Offscreen
min: 300.8 avg: 311.8 median: 311.8 (35%) max: 322.7 fps
GFXBench 3.1 - GFXBench Manhattan ES 3.1 Offscreen
min: 447.1 avg: 466.7 median: 466.7 (10%) max: 486.3 fps
GFXBench 3.0 - GFXBench 3.0 Manhattan Offscreen
min: 512 avg: 522 median: 522 (31%) max: 532 fps
GFXBench (DX / GLBenchmark) 2.7 + NVIDIA Quadro RTX 5000 Max-Q GFXBench (DX / GLBenchmark) 2.7 - GFXBench T-Rex HD Offscreen C24Z16
min: 1282 avg: 1335 median: 1334.5 (11%) max: 1387 fps
Basemark GPU 1.2 - Basemark GPU 1.2 Vulkan Official Medium Offscreen 1080
min: 72.1 avg: 88.4 median: 88.4 (1%) max: 104.6 fps
Basemark GPU 1.2 - Basemark GPU 1.2 Vulkan Official High Offscreen 2160
5.6 fps (1%)
Geekbench 6.2 - Geekbench 6.2 GPU OpenCL
min: 5031 avg: 5954 median: 6203.5 (2%) max: 6378 Points
Geekbench 6.2 - Geekbench 6.2 GPU Vulkan
min: 6193 avg: 6857 median: 6978 (2%) max: 7279 Points
LuxMark v2.0 64Bit - LuxMark v2.0 Room GPU
min: 232 avg: 275 median: 275 (1%) max: 318 Samples/s
min: 1972 avg: 1990 median: 1990 (9%) max: 2008 Samples/s
LuxMark v2.0 64Bit - LuxMark v2.0 Sala GPU
min: 728 avg: 748 median: 748 (1%) max: 768 Samples/s
min: 4913 avg: 4983 median: 4983 (9%) max: 5053 Samples/s
ComputeMark v2.1 - ComputeMark v2.1 Result
min: 1042 avg: 1099 median: 1098.5 (1%) max: 1155 Points
min: 14095 avg: 14179 median: 14178.5 (15%) max: 14262 Points
Power Consumption - Furmark Stress Test Power Consumption - external Monitor *
min: 17.8 avg: 21.7 median: 21.5 (3%) max: 26.1 Watt
min: 117 avg: 126 median: 126 (18%) max: 135 Watt
GPU TDP ? TDP 80 W 112% 100%
Power Consumption - The Witcher 3 Power Consumption - external Monitor *
min: 21.5 avg: 23.1 median: 23.1 (3%) max: 24.7 Watt
min: 122 avg: 123 median: 123 (17%) max: 124 Watt
GPU TDP ? TDP 80 W 111% 100%
Power Consumption - Witcher 3 Power Consumption *
min: 26.6 avg: 27.4 median: 27.4 (6%) max: 28.2 Watt
min: 145 avg: 151.9 median: 151.6 (33%) max: 157.5 Watt
Power Consumption - Witcher 3 ultra Power Efficiency
0.3 fps per Watt (24%)
min: 0.4765 avg: 0.5 median: 0.5 (46%) max: 0.577 fps per Watt
Power Consumption - Witcher 3 ultra Power Efficiency - external Monitor
min: 0.682 avg: 0.7 median: 0.7 (57%) max: 0.685 fps per Watt
GPU TDP ? TDP 80 W 100% 100%
Emissions Witcher 3 Fan Noise + NVIDIA Quadro RTX 5000 Max-Q Emissions - Witcher 3 Fan Noise
min: 38.3 avg: 46.6 median: 47.4 (76%) max: 51.9 dB(A)
Clock Speed - GPU Clock Witcher 3 ultra
min: 1137 avg: 1171 median: 1170.5 (46%) max: 1204 MHz
GPU TDP ? TDP 80 W 100% 94%
Clock Speed - GPU Clock Speed Furmark
min: 465 avg: 920 median: 919.5 (36%) max: 1374 MHz
GPU TDP ? TDP 80 W 34% 100%
Average Benchmarks Intel UHD Graphics 32EUs (Alder Lake) → 100% n=1 Average Benchmarks NVIDIA Quadro RTX 6000 (Laptop) → 1808% n=1 Average Benchmarks NVIDIA Quadro RTX 5000 Max-Q → 1188% n=1
- Range of benchmark values for this graphics card
- Average benchmark values for this graphics card
* Smaller numbers mean a higher performance
1 This benchmark is not used for the average calculation
Game Benchmarks The following benchmarks stem from our benchmarks of review laptops. The performance depends on the used graphics memory, clock rate, processor, system settings, drivers, and operating systems. So the results don't have to be representative for all laptops with this GPU. For detailed information on the benchmark results, click on the fps number.
100%
UHD Graphics 32EUs:
37 [X] Maxtang MTN-ALN50 Intel Core i3-N305 1.8GHz
UHD Graphics 32EUs
min:
8.84 fps, P0.1:
8.99 fps, P1:
22.3 fps, max:
263 fps
fps
100%
UHD Graphics 32EUs:
26.7 [X] Maxtang MTN-ALN50 Intel Core i3-N305 1.8GHz
UHD Graphics 32EUs
min:
7.15 fps, P0.1:
8.25 fps, P1:
14.6 fps, max:
101.8 fps
fps
100%
UHD Graphics 32EUs:
24 [X] Maxtang MTN-ALN50 Intel Core i3-N305 1.8GHz
UHD Graphics 32EUs
min:
6.98 fps, P0.1:
7 fps, P1:
14.5 fps, max:
84.7 fps
fps
100%
UHD Graphics 32EUs:
16.9 fps
100%
UHD Graphics 32EUs:
11.9 fps
100%
UHD Graphics 32EUs:
10.4 fps
100%
UHD Graphics 32EUs:
7.7 fps
100%
UHD Graphics 32EUs:
27.1 fps
100%
UHD Graphics 32EUs:
19.9 fps
100%
UHD Graphics 32EUs:
13 fps
100%
UHD Graphics 32EUs:
11.4 fps
100%
UHD Graphics 32EUs:
11.3 fps
100%
UHD Graphics 32EUs:
6.4 fps
100%
UHD Graphics 32EUs:
5.3 fps
100%
UHD Graphics 32EUs:
6.9 [X] Asus BR1402FG 2.01
Intel Core i3-N305 1.8GHz
UHD Graphics 32EUs
min:
2.25 fps, max:
16.4 fps
7.3 ~ 7 fps
100%
UHD Graphics 32EUs:
5.5 fps
100%
UHD Graphics 32EUs:
16.1 fps
100%
UHD Graphics 32EUs:
14.8 fps
100%
UHD Graphics 32EUs:
11.7 fps
100%
UHD Graphics 32EUs:
11.1 fps
100%
UHD Graphics 32EUs:
14.1 fps
100%
UHD Graphics 32EUs:
11.2 fps
100%
UHD Graphics 32EUs:
27.3 [X] Maxtang MTN-ALN50 800660
Intel Core i3-N305 1.8GHz
UHD Graphics 32EUs
min:
14.7 fps, max:
57.7 fps
fps
100%
UHD Graphics 32EUs:
21.1 [X] Maxtang MTN-ALN50 800660
Intel Core i3-N305 1.8GHz
UHD Graphics 32EUs
min:
14.5 fps, max:
37.1 fps
fps
100%
UHD Graphics 32EUs:
15.9 [X] Maxtang MTN-ALN50 800660
Intel Core i3-N305 1.8GHz
UHD Graphics 32EUs
min:
10.9 fps, max:
30.9 fps
fps
100%
UHD Graphics 32EUs:
46 [X] Maxtang MTN-ALN50 874931
Intel Core i3-N305 1.8GHz
UHD Graphics 32EUs
min:
35 fps, P1:
34 fps, max:
52 fps
fps
100%
UHD Graphics 32EUs:
18.3 [X] Maxtang MTN-ALN50 874931
Intel Core i3-N305 1.8GHz
UHD Graphics 32EUs
min:
14 fps, P1:
14 fps, max:
20 fps
fps
100%
UHD Graphics 32EUs:
16.5 [X] Maxtang MTN-ALN50 874931
Intel Core i3-N305 1.8GHz
UHD Graphics 32EUs
min:
13 fps, P1:
13 fps, max:
18 fps
fps
100%
UHD Graphics 32EUs:
10.5 [X] Maxtang MTN-ALN50 874931
Intel Core i3-N305 1.8GHz
UHD Graphics 32EUs
min:
7 fps, P1:
8 fps, max:
12 fps
fps
Quadro RTX 5000 Max-Q:
90 fps
Quadro RTX 5000 Max-Q:
85 fps
Quadro RTX 5000 Max-Q:
75 fps
Quadro RTX 5000 Max-Q:
51 fps
Quadro RTX 5000 Max-Q:
37 fps
Quadro RTX 5000 Max-Q:
21 fps
Quadro RTX 5000 Max-Q:
208.3 fps
Quadro RTX 5000 Max-Q:
188.7 fps
Quadro RTX 5000 Max-Q:
181.6 fps
Quadro RTX 5000 Max-Q:
170 fps
Quadro RTX 5000 Max-Q:
143 fps
Quadro RTX 5000 Max-Q:
84.4 fps
Quadro RTX 5000 Max-Q:
296 fps
Quadro RTX 5000 Max-Q:
225.7 fps
Quadro RTX 5000 Max-Q:
203.3 fps
Quadro RTX 5000 Max-Q:
185.3 fps
Quadro RTX 5000 Max-Q:
125.9 fps
Quadro RTX 5000 Max-Q:
70.4 fps
Quadro RTX 5000 Max-Q:
113.6 fps
Quadro RTX 5000 Max-Q:
90.3 fps
Quadro RTX 5000 Max-Q:
82.9 fps
Quadro RTX 5000 Max-Q:
56.7 fps
Quadro RTX 5000 Max-Q:
30.2 fps
Quadro RTX 5000 Max-Q:
106 fps
Quadro RTX 5000 Max-Q:
84.7 fps
Quadro RTX 5000 Max-Q:
79.8 fps
Quadro RTX 5000 Max-Q:
69.6 fps
Quadro RTX 5000 Max-Q:
57.5 fps
Quadro RTX 5000 Max-Q:
34.9 fps
Quadro RTX 5000 Max-Q:
58.3 fps
Quadro RTX 5000 Max-Q:
49 fps
Quadro RTX 5000 Max-Q:
44 fps
Quadro RTX 5000 Max-Q:
34.3 fps
Quadro RTX 5000 Max-Q:
26.9 fps
Quadro RTX 5000 Max-Q:
16.1 fps
Quadro RTX 5000 Max-Q:
120 fps
Quadro RTX 5000 Max-Q:
103 fps
Quadro RTX 5000 Max-Q:
93 fps
Quadro RTX 5000 Max-Q:
86 89 [X] Asus ProArt StudioBook Pro 15 W500G5T rendering
Intel Core i7-9750H 2.6GHz
Quadro RTX 5000 Max-Q
~ 88 fps
Quadro RTX 5000 Max-Q:
69 fps
Quadro RTX 5000 Max-Q:
42 fps
Quadro RTX 5000 Max-Q:
70 73.7 ~ 72 fps
Quadro RTX 5000 Max-Q:
39 41.1 ~ 40 fps
100%
UHD Graphics 32EUs:
35.4 fps
613%
Quadro RTX 5000 Max-Q:
214 219 ~ 217 fps
100%
UHD Graphics 32EUs:
18.8 fps
862%
Quadro RTX 5000 Max-Q:
158 166 ~ 162 fps
100%
UHD Graphics 32EUs:
14 fps
993%
Quadro RTX 5000 Max-Q:
135 143 ~ 139 fps
100%
UHD Graphics 32EUs:
8.7 fps
1241%
Quadro RTX 5000 Max-Q:
107 108 ~ 108 fps
Quadro RTX 5000 Max-Q:
82.8 83 ~ 83 fps
Quadro RTX 5000 Max-Q:
44.4 47 ~ 46 fps
Quadro RTX 5000 Max-Q:
126.6 151 ~ 139 fps
Quadro RTX 5000 Max-Q:
73.6 84.6 ~ 79 fps
Quadro RTX 5000 Max-Q:
50 54.3 ~ 52 fps
Quadro RTX 5000 Max-Q:
24 27.6 ~ 26 fps
Quadro RTX 5000 Max-Q:
142.3 145 ~ 144 fps
Quadro RTX 5000 Max-Q:
137.8 140.6 145.3 [X] Asus ProArt StudioBook Pro 15 W500G5T Rendering
Intel Core i7-9750H 2.6GHz
Quadro RTX 5000 Max-Q
~ 141 fps
Quadro RTX 5000 Max-Q:
47.1 54.5 ~ 51 fps
Quadro RTX 5000 Max-Q:
158.2 fps
Quadro RTX 5000 Max-Q:
106.2 fps
Quadro RTX 5000 Max-Q:
94 fps
Quadro RTX 5000 Max-Q:
52.5 fps
Quadro RTX 5000 Max-Q:
26.7 fps
Quadro RTX 5000 Max-Q:
84.8 89.1 ~ 87 fps
Quadro RTX 5000 Max-Q:
54.8 63.9 ~ 59 fps
Quadro RTX 5000 Max-Q:
39.7 41.3 ~ 41 fps
Quadro RTX 5000 Max-Q:
32 32.9 ~ 32 fps
Quadro RTX 5000 Max-Q:
19.8 25.2 ~ 23 fps
Quadro RTX 5000 Max-Q:
88.5 105 ~ 97 fps
Quadro RTX 5000 Max-Q:
83.1 99.5 ~ 91 fps
Quadro RTX 5000 Max-Q:
80.4 89.7 ~ 85 fps
Quadro RTX 5000 Max-Q:
64 66.3 ~ 65 fps
Quadro RTX 5000 Max-Q:
33.5 34 ~ 34 fps
Quadro RTX 5000 Max-Q:
92.3 fps
Quadro RTX 5000 Max-Q:
84.4 fps
Quadro RTX 5000 Max-Q:
77.5 fps
Quadro RTX 5000 Max-Q:
72.1 fps
Quadro RTX 5000 Max-Q:
65.4 fps
Quadro RTX 5000 Max-Q:
36.9 fps
Quadro RTX 5000 Max-Q:
99 103.6 ~ 101 fps
Quadro RTX 5000 Max-Q:
86.7 91.8 ~ 89 fps
Quadro RTX 5000 Max-Q:
62.2 65.2 ~ 64 fps
Quadro RTX 5000 Max-Q:
34 35.2 ~ 35 fps
Quadro RTX 5000 Max-Q:
79.2 87.2 ~ 83 fps
Quadro RTX 5000 Max-Q:
61.4 62.7 ~ 62 fps
Quadro RTX 5000 Max-Q:
36.8 38.6 ~ 38 fps
Quadro RTX 5000 Max-Q:
117 127 ~ 122 fps
Quadro RTX 5000 Max-Q:
96 105 ~ 101 fps
Quadro RTX 5000 Max-Q:
92 93 ~ 93 fps
Quadro RTX 5000 Max-Q:
65 68 ~ 67 fps
Quadro RTX 5000 Max-Q:
47 49 ~ 48 fps
Quadro RTX 5000 Max-Q:
26 28 ~ 27 fps
Quadro RTX 5000 Max-Q:
118.8 fps
Quadro RTX 5000 Max-Q:
99.9 fps
Quadro RTX 5000 Max-Q:
78.4 fps
Quadro RTX 5000 Max-Q:
62.5 fps
Quadro RTX 5000 Max-Q:
42.9 fps
Quadro RTX 5000 Max-Q:
22.8 fps
Quadro RTX 5000 Max-Q:
93.2 96.7 ~ 95 fps
Quadro RTX 5000 Max-Q:
66.5 69.9 ~ 68 fps
Quadro RTX 5000 Max-Q:
42.7 43 ~ 43 fps
Quadro RTX 5000 Max-Q:
19.1 20 ~ 20 fps
Quadro RTX 5000 Max-Q:
113 192 ~ 153 fps
Quadro RTX 5000 Max-Q:
101 165 ~ 133 fps
Quadro RTX 5000 Max-Q:
93 131 ~ 112 fps
Quadro RTX 5000 Max-Q:
88 118 ~ 103 fps
Quadro RTX 5000 Max-Q:
83 86 ~ 85 fps
Quadro RTX 5000 Max-Q:
52 56 ~ 54 fps
Quadro RTX 5000 Max-Q:
120.2 129 ~ 125 fps
Quadro RTX 5000 Max-Q:
80.9 87.3 ~ 84 fps
Quadro RTX 5000 Max-Q:
57.5 64.9 ~ 61 fps
Quadro RTX 5000 Max-Q:
34.1 43.5 ~ 39 fps
Quadro RTX 5000 Max-Q:
18.5 21.5 ~ 20 fps
Quadro RTX 5000 Max-Q:
224 fps
Quadro RTX 5000 Max-Q:
114.8 fps
Quadro RTX 5000 Max-Q:
96.4 fps
Quadro RTX 5000 Max-Q:
94.3 fps
Quadro RTX 5000 Max-Q:
59.4 fps
Quadro RTX 5000 Max-Q:
28.7 fps
Quadro RTX 5000 Max-Q:
94.5 95.8 ~ 95 fps
Quadro RTX 5000 Max-Q:
90.9 97.8 ~ 94 fps
Quadro RTX 5000 Max-Q:
69.3 73.9 ~ 72 fps
Quadro RTX 5000 Max-Q:
37.4 38.9 ~ 38 fps
Quadro RTX 5000 Max-Q:
31.5 34.7 ~ 33 fps
Quadro RTX 5000 Max-Q:
21.2 fps
Quadro RTX 5000 Max-Q:
144 fps
Quadro RTX 5000 Max-Q:
112 fps
Quadro RTX 5000 Max-Q:
97 fps
Quadro RTX 5000 Max-Q:
56 fps
Quadro RTX 5000 Max-Q:
51 fps
Quadro RTX 5000 Max-Q:
27 fps
Quadro RTX 5000 Max-Q:
241.2 275 ~ 258 fps
Quadro RTX 5000 Max-Q:
153 160.3 ~ 157 fps
Quadro RTX 5000 Max-Q:
89.3 90.7 ~ 90 fps
Quadro RTX 5000 Max-Q:
66.8 70.2 ~ 69 fps
Quadro RTX 5000 Max-Q:
39.8 fps
100%
UHD Graphics 32EUs:
21 fps
505%
Quadro RTX 5000 Max-Q:
104 107 ~ 106 fps
100%
UHD Graphics 32EUs:
11 fps
855%
Quadro RTX 5000 Max-Q:
90 98 ~ 94 fps
100%
UHD Graphics 32EUs:
10 fps
890%
Quadro RTX 5000 Max-Q:
88 90 ~ 89 fps
100%
UHD Graphics 32EUs:
9 fps
933%
Quadro RTX 5000 Max-Q:
81 86 ~ 84 fps
Quadro RTX 5000 Max-Q:
72 74 ~ 73 fps
Quadro RTX 5000 Max-Q:
43 43 ~ 43 fps
Quadro RTX 5000 Max-Q:
87.8 96.3 ~ 92 fps
Quadro RTX 5000 Max-Q:
66.9 72.8 ~ 70 fps
Quadro RTX 5000 Max-Q:
55.4 59.2 ~ 57 fps
Quadro RTX 5000 Max-Q:
25.4 45.6 ~ 36 fps
Quadro RTX 5000 Max-Q:
25.2 27 ~ 26 fps
Quadro RTX 5000 Max-Q:
144 fps
Quadro RTX 5000 Max-Q:
144 fps
Quadro RTX 5000 Max-Q:
144 fps
Quadro RTX 5000 Max-Q:
142.8 fps
Quadro RTX 5000 Max-Q:
104.9 fps
Quadro RTX 5000 Max-Q:
53.4 fps
Quadro RTX 5000 Max-Q:
87.7 fps
Quadro RTX 5000 Max-Q:
85.3 fps
Quadro RTX 5000 Max-Q:
78.4 fps
Quadro RTX 5000 Max-Q:
75.3 fps
Quadro RTX 5000 Max-Q:
73.3 fps
Quadro RTX 5000 Max-Q:
46.6 fps
Quadro RTX 5000 Max-Q:
95 107 ~ 101 fps
Quadro RTX 5000 Max-Q:
80 91 ~ 86 fps
Quadro RTX 5000 Max-Q:
75 80 ~ 78 fps
Quadro RTX 5000 Max-Q:
54 57 ~ 56 fps
Quadro RTX 5000 Max-Q:
47 48 ~ 48 fps
Quadro RTX 5000 Max-Q:
30 31 ~ 31 fps
100%
UHD Graphics 32EUs:
16.5 fps
703%
Quadro RTX 5000 Max-Q:
105 127 ~ 116 fps
100%
UHD Graphics 32EUs:
9.2 fps
1065%
Quadro RTX 5000 Max-Q:
94 102 ~ 98 fps
100%
UHD Graphics 32EUs:
8.6 fps
1105%
Quadro RTX 5000 Max-Q:
91 98 ~ 95 fps
Quadro RTX 5000 Max-Q:
85 87 90 [X] Razer Blade 15 Studio Edition 2020 Max. CPU, max. GPU
Intel Core i7-10875H 2.3GHz
Quadro RTX 5000 Max-Q
~ 87 fps
Quadro RTX 5000 Max-Q:
59 62 ~ 61 fps
Quadro RTX 5000 Max-Q:
29 33 ~ 31 fps
100%
UHD Graphics 32EUs:
32.5 [X] Zotac ZBOX PI430AJ 1.47.22.14 D3D12
Intel Core i3-N300 GHz
UHD Graphics 32EUs
min:
5 fps, P1:
9.8 fps, max:
142 fps
39.2 [X] Asus BR1402FG 1.47.22.14 D3D12
Intel Core i3-N305 1.8GHz
UHD Graphics 32EUs
min:
8.9 fps, P1:
12.8 fps, max:
240 fps
41.3 [X] Maxtang MTN-ALN50 1.47.22.14 D3D12
Intel Core i3-N305 1.8GHz
UHD Graphics 32EUs
min:
9.9 fps, P1:
13.1 fps, max:
216 fps
44.1 ~ 39 fps
100%
UHD Graphics 32EUs:
13.5 [X] Maxtang MTN-ALN50 1.47.22.14 D3D12
Intel Core i3-N305 1.8GHz
UHD Graphics 32EUs
min:
5 fps, P1:
5.14 fps, max:
149.3 fps
13.7 [X] Zotac ZBOX PI430AJ 1.47.22.14 D3D12
Intel Core i3-N300 GHz
UHD Graphics 32EUs
min:
5 fps, P1:
5.33 fps, max:
107.4 fps
15.2 [X] Asus BR1402FG 1.47.22.14 D3D12
Intel Core i3-N305 1.8GHz
UHD Graphics 32EUs
min:
5 fps, P1:
5.2 fps, max:
176.4 fps
17.2 ~ 15 fps
100%
UHD Graphics 32EUs:
11.5 [X] Zotac ZBOX PI430AJ 1.47.22.14 D3D12
Intel Core i3-N300 GHz
UHD Graphics 32EUs
min:
5 fps, P1:
5 fps, max:
125.8 fps
13.4 [X] Asus BR1402FG 1.47.22.14 D3D12
Intel Core i3-N305 1.8GHz
UHD Graphics 32EUs
min:
5 fps, P1:
5 fps, max:
198.8 fps
13.5 [X] Maxtang MTN-ALN50 1.47.22.14 D3D12
Intel Core i3-N305 1.8GHz
UHD Graphics 32EUs
min:
5 fps, P1:
5 fps, max:
181.9 fps
13.8 ~ 13 fps
100%
UHD Graphics 32EUs:
14.5 [X] Maxtang MTN-ALN50 1.47.22.14 D3D12
Intel Core i3-N305 1.8GHz
UHD Graphics 32EUs
min:
5 fps, P1:
5 fps, max:
232 fps
fps
100%
UHD Graphics 32EUs:
20 21 ~ 21 fps
610%
Quadro RTX 5000 Max-Q:
128 fps
100%
UHD Graphics 32EUs:
9 10 ~ 10 fps
1060%
Quadro RTX 5000 Max-Q:
106 fps
100%
UHD Graphics 32EUs:
9 9 ~ 9 fps
1122%
Quadro RTX 5000 Max-Q:
101 fps
100%
UHD Graphics 32EUs:
8 8 ~ 8 fps
1200%
Quadro RTX 5000 Max-Q:
96 fps
Quadro RTX 5000 Max-Q:
74 fps
Quadro RTX 5000 Max-Q:
40 fps
Quadro RTX 5000 Max-Q:
595 fps
Quadro RTX 5000 Max-Q:
367.5 fps
Quadro RTX 5000 Max-Q:
175.5 fps
Quadro RTX 5000 Max-Q:
109.6 fps
Quadro RTX 5000 Max-Q:
52.3 fps
Quadro RTX 5000 Max-Q:
56 58.4 ~ 57 fps
Quadro RTX 5000 Max-Q:
113 fps
Quadro RTX 5000 Max-Q:
108 fps
Quadro RTX 5000 Max-Q:
98 fps
Quadro RTX 5000 Max-Q:
86 fps
Quadro RTX 5000 Max-Q:
38 fps
Quadro RTX 5000 Max-Q:
130.4 fps
Quadro RTX 5000 Max-Q:
91.9 fps
Quadro RTX 5000 Max-Q:
85.7 fps
Quadro RTX 5000 Max-Q:
58.7 fps
Quadro RTX 5000 Max-Q:
38.6 fps
Quadro RTX 5000 Max-Q:
246.1 fps
Quadro RTX 5000 Max-Q:
162.1 fps
Quadro RTX 5000 Max-Q:
156 fps
Quadro RTX 5000 Max-Q:
123.2 fps
Quadro RTX 5000 Max-Q:
48.1 fps
Quadro RTX 5000 Max-Q:
84.4 fps
Quadro RTX 5000 Max-Q:
77.7 fps
Quadro RTX 5000 Max-Q:
75.4 fps
Quadro RTX 5000 Max-Q:
42.3 fps
Quadro RTX 5000 Max-Q:
281.4 fps
Quadro RTX 5000 Max-Q:
198.6 fps
Quadro RTX 5000 Max-Q:
134.5 fps
Quadro RTX 5000 Max-Q:
110.1 fps
Quadro RTX 5000 Max-Q:
45.4 fps
Quadro RTX 5000 Max-Q:
254.8 fps
Quadro RTX 5000 Max-Q:
226.7 fps
Quadro RTX 5000 Max-Q:
191.8 fps
Quadro RTX 5000 Max-Q:
183.4 fps
Quadro RTX 5000 Max-Q:
86.9 fps
100%
UHD Graphics 32EUs:
16 38.1 [X] Maxtang MTN-ALN50 Intel Core i3-N305 1.8GHz
UHD Graphics 32EUs
min:
11.2 fps, P0.1:
17.5 fps, P1:
20.5 fps, max:
132.2 fps
38.7 ~ 31 fps
100%
UHD Graphics 32EUs:
12 25.1 ~ 19 fps
100%
UHD Graphics 32EUs:
12.3 [X] Maxtang MTN-ALN50 Intel Core i3-N305 1.8GHz
UHD Graphics 32EUs
min:
4.16 fps, P0.1:
5.96 fps, P1:
6.76 fps, max:
52.8 fps
13 ~ 13 fps
100%
UHD Graphics 32EUs:
5.4 [X] Asus BR1402FG Intel Core i3-N305 1.8GHz
UHD Graphics 32EUs
min:
4 fps, P1:
5 fps, max:
6 fps
5.5 [X] Maxtang MTN-ALN50 Intel Core i3-N305 1.8GHz
UHD Graphics 32EUs
min:
3.3 fps, P0.1:
3.31 fps, P1:
3.4 fps, max:
13.5 fps
7 ~ 6 fps
1367%
Quadro RTX 5000 Max-Q:
71 77.3 79.5 81.1 83.3 83.6 84.6 85 [X] Razer Blade 15 Studio Edition 2020 Max. CPU, Max. GPU
Intel Core i7-10875H 2.3GHz
Quadro RTX 5000 Max-Q
85.3 [X] Asus ProArt StudioBook Pro 15 W500G5T Rendering
Intel Core i7-9750H 2.6GHz
Quadro RTX 5000 Max-Q
88.5 [X] Razer Blade 15 Studio Edition Max. CPU, max. GPU
Intel Core i7-9750H 2.6GHz
Quadro RTX 5000 Max-Q
~ 82 fps
100%
UHD Graphics 32EUs:
35.7 [X] Zotac ZBOX PI430AJ Intel Core i3-N300 GHz
UHD Graphics 32EUs
min:
2.51 fps, P1:
15.9 fps, max:
59.5 fps
50.8 [X] Asus BR1402FG Intel Core i3-N305 1.8GHz
UHD Graphics 32EUs
min:
2.27 fps, P1:
23.8 fps, max:
88.3 fps
55.6 [X] Maxtang MTN-ALN50 Intel Core i3-N305 1.8GHz
UHD Graphics 32EUs
min:
14.1 fps, P1:
35.7 fps, max:
87.7 fps
61.9 ~ 51 fps
339%
Quadro RTX 5000 Max-Q:
169.1 177 ~ 173 fps
388%
Quadro RTX 5000 Max-Q:
163.4 170 ~ 167 fps
100%
UHD Graphics 32EUs:
9.4 fps
100%
UHD Graphics 32EUs:
4 fps
1884%
Quadro RTX 5000 Max-Q:
72 77.6 ~ 75 fps
Quadro RTX 5000 Max-Q:
68.4 89.1 ~ 79 fps
Quadro RTX 5000 Max-Q:
265 296.5 ~ 281 fps
Quadro RTX 5000 Max-Q:
167.2 168.5 174.3 [X] Razer Blade 15 Studio Edition 2020 Max. CPU, max. GPU
Intel Core i7-10875H 2.3GHz
Quadro RTX 5000 Max-Q
~ 170 fps
Average Gaming Intel UHD Graphics 32EUs (Alder Lake) → 100% Average Gaming 30-70 fps → 100%
Average Gaming NVIDIA Quadro RTX 5000 Max-Q → 862%  Deutsch
 English
 Español
 Français
 Italiano
 Nederlands
 Polski
 Português
 Русский
 Türkçe
 Svenska
 Chinese
 Magyar