Intel UHD Graphics 32EUs (Alder Lake) vs Intel HD Graphics (Broadwell) vs Intel HD Graphics (Cherry Trail)
Intel UHD Graphics 32EUs (Alder Lake) ► remove from comparison
Die Intel Xe Graphics 32 EUS (Alder Lake) ist eine Prozessorgrafikkarte, die Anfang 2023 vorgestellt wurde. Sie basiert auf die Xe Architektur (Gen12) und bietet in Alder Lake CPUs nur 32 der 96 verbauten Execution Units (EUs). Die GPU wird im verbesserten 10nm Verfahren (Intel 7) bei Intel gefertigt. Die Rohleistung ist vergleichbar mit der Radeon RX Vega 6 (in Ryzen 5000 CPUs), jedoch ist die Spieleleistung geringer durch den schwächeren Treibersupport (in 2022). Nur anspruchslose Spiele wie Dota 2 Reborn sind mit geringsten Settings flüssig spielbar (siehe unten).
Intel HD Graphics (Broadwell) ► remove from comparison
The Intel HD Graphics (Broadwell) (GT1) is an integrated Broadwell graphics card revealed in Q1 2015. It can be found in several low-end CPUs such as the Pentium 3805U or Celeron 3755U . The so-called GT1 GPU offers 12 EUs (Execution Units) and therefore somewhat more shader power than the previous HD Graphics (Haswell) . The clock range may depend on the specific model it is built into.
Architecture and Features
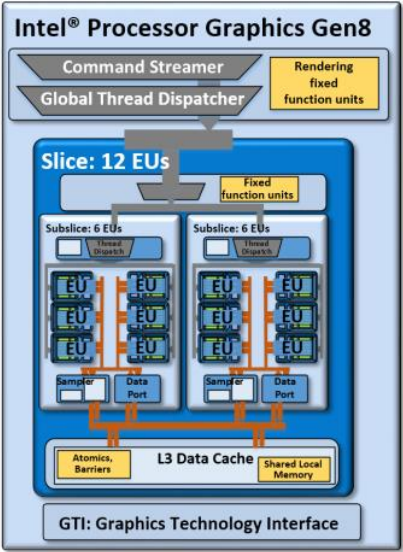
Broadwell features a GPU based on the Intel Gen8 architecture, which has been optimized in various aspects compared to the previous Gen7.5 (Haswell). In case of the GT1 version, the shader arrays called "subslice" have been reorganized and now offer 6 Execution Units (EUs) each. Two subslices form a "slice" for a total of 12 EUs. Combined with other improvements such as larger L1 caches and an optimized frontend, the integrated GPU has become faster and more efficient than its predecessor.
The HD Graphics (Broadwell) represents the low-end version of the Broadwell GPU family and consists of one slice with 12 EUs. Beyond that, there is also a mid-range variant (GT2, 24 EUs) as well as higher-end models (GT3/GT3e + eDRAM, 48 EUs).
All Broadwell GPUs support OpenCL 2.0 and DirectX 12 (FL 11_1). The video engine can now decode H.265 using both fixed function hardware as well as available GPU shaders. Up to three displays can be connected via DP 1.2/eDP 1.3 (max. 3840 x 2160 @ 60 Hz) or HDMI 1.4a (max. 3840 x 2160 @ 24 Hz). HDMI 2.0, however, is not supported.
Performance
Even though the HD Graphics (Broadwell) is clocked a bit lower, the performance should be clearly above the HD Graphics (Haswell) and similar to the HD Graphics 4000 . Nevertheless, only a few games as of 2014/2015 will run fluently at (very) low settings, e.g. Dota 2 or Sims 4.
Power Consumption
Utilizing a new 14 nm process, the HD Graphics (Broadwell) can be found in ULV models (15 W) as well as regular dual core CPUs (37 W, not yet presented). The TDP is flexible and can be further reduced, which has a significant impact on performance.
Intel HD Graphics (Cherry Trail) ► remove from comparison
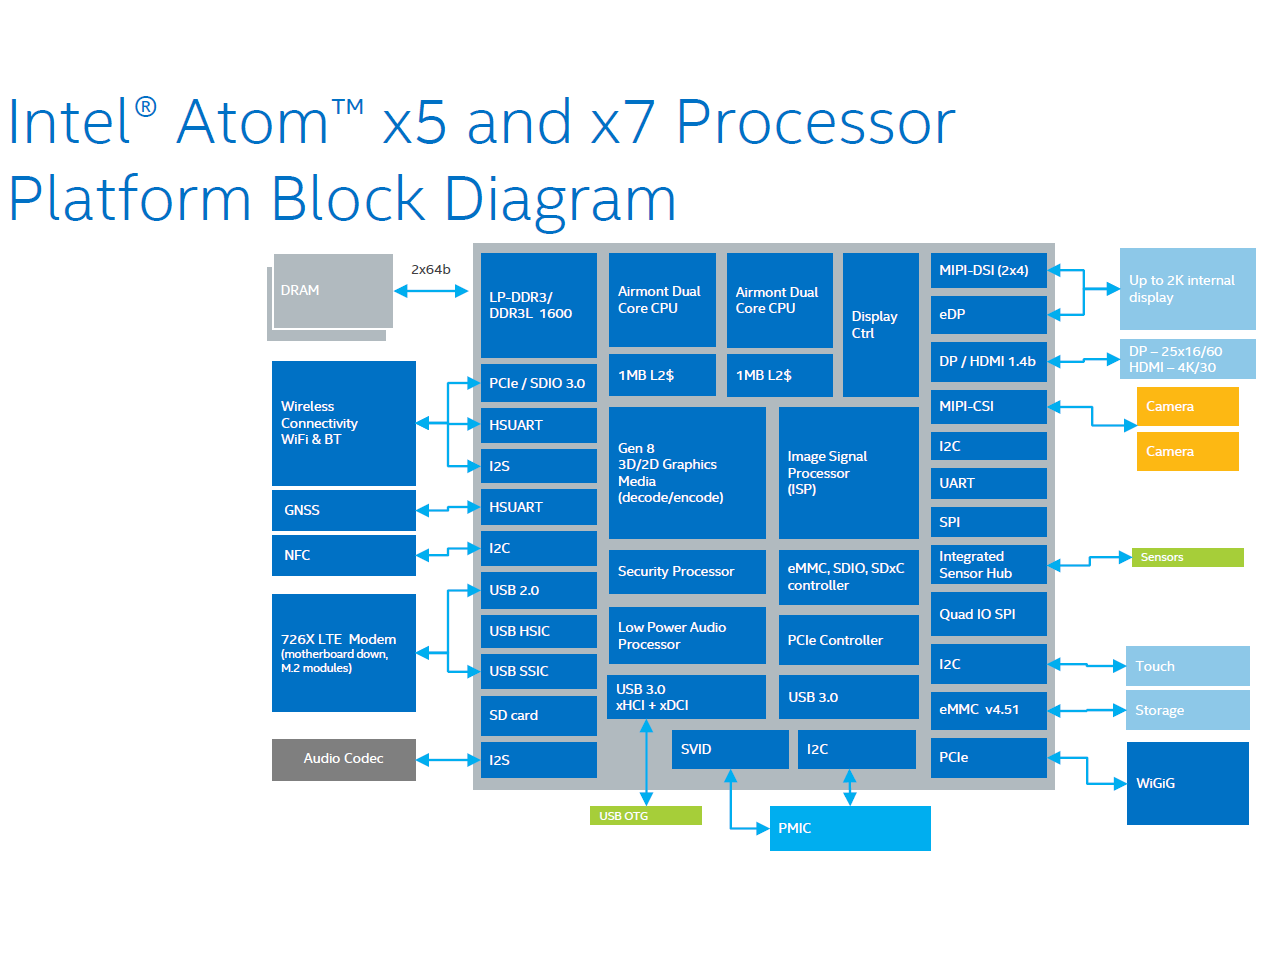
The Intel HD Graphics (Cherry Trail) is an integrated graphics card in the Cherry-Trail SoCs (e.g. Atom x7-Z8700). Based on a Broadwell GPU (Intel Gen8) and supports DirectX 11.2. Depending on the SoC offers 12 or 16 EUs.
Atom x7-Z8700: 16 EUs @ 200 - 600 MHz, dual-channel memory
In Windows, gaming is limited to less demanding or quite old games. Using Android, even high end 3D games should run fluently. For example Team Fortress 2 was running on the Surface 3 (x7-Z8700) only in lowest settings and 1280x720 fluently (11 - 69 fps range).
The integrated video decoder is able to display even 4K videos (H.264 tested) fluently.
The Intel HD Graphics GPU in our review sample of the MS Surface 3 (Atom x7-Z8700) only supported DisplayPort 1.1 as it seems, as 4K (3840x2160) with 30 Hz was the maximum Refresh Rate we could achieve (no 60 Hz selectable with the pre-installed drivers).
Intel UHD Graphics 32EUs (Alder Lake) Intel HD Graphics (Broadwell) Intel HD Graphics (Cherry Trail) HD Graphics Series Codename Alder Lake Xe Broadwell GT1 Cherry Trail Pipelines 32 - unified 12 - unified 16 - unified Core Speed 1250 MHz 100 - 850 (Boost) MHz 200 - 600 (Boost) MHz Shared Memory yes yes yes API DirectX 12_1, OpenGL 4.6 DirectX 12 (FL 11_1), OpenGL 4.3 DirectX 12 (FL 11_1), Shader 5.0, OpenGL 4.3 Architecture Gen. 8 Broadwell Gen. 8 Memory Bus Width 64/128 Bit 64/128 Bit technology 14 nm 14 nm Features QuickSync Date of Announcement 05.01.2015 02.03.2015
Benchmarks Performance Rating - 3DMark 11 + Fire Strike + Time Spy - UHD Graphics 32EUs
0.9 pt (3%)
...
Intel UHD Graphics 32EUs (Alder Lake)
NVIDIA GeForce GTX 460 768MB
...
Performance Rating - 3DMark 11 + Fire Strike + Time Spy - HD Graphics (Broadwell)
0.2 pt (1%)
...
Intel HD Graphics (Broadwell)
...
Performance Rating - 3DMark 11 + Fire Strike + Time Spy - HD Graphics (Cherry Trail)
0.1 pt (0%)
Intel HD Graphics (Cherry Trail)
...
3DMark - 3DMark Time Spy Score
min: 599 avg: 626 median: 613 (2%) max: 666 Points
3DMark - 3DMark Time Spy Graphics
min: 523 avg: 547 median: 536 (1%) max: 583 Points
3DMark - 3DMark Ice Storm Unlimited Graphics
min: 64090 avg: 76155 median: 76154.5 (9%) max: 88219 Points
min: 18563 avg: 20873 median: 19303 (2%) max: 27537 Points
3DMark - 3DMark Ice Storm Extreme Graphics
min: 38285 avg: 38839 median: 38839 (5%) max: 39393 Points
3DMark - 3DMark Cloud Gate Score
min: 7939 avg: 10785 median: 11402.5 (12%) max: 12397 Points
3398 Points (4%)
min: 769 avg: 1454 median: 1488 (2%) max: 1905 Points
3DMark - 3DMark Cloud Gate Graphics
min: 10945 avg: 12633 median: 12687 (3%) max: 14214 Points
4015 Points (1%)
min: 1537 avg: 1851 median: 1783.5 (0%) max: 2272 Points
3DMark - 3DMark Fire Strike Standard Score
min: 1574 avg: 1726 median: 1733 (3%) max: 1862 Points
428 Points (1%)
min: 174 avg: 390.4 median: 248 (0%) max: 1059 Points
3DMark - 3DMark Fire Strike Standard Graphics
min: 1736 avg: 1880 median: 1894.5 (2%) max: 1995 Points
463 Points (1%)
min: 193 avg: 233 median: 225 (0%) max: 281 Points
3DMark - 3DMark Ice Storm Graphics
min: 53717 avg: 54586 median: 54586 (7%) max: 55455 Points
45539 Points (5%)
min: 7544 avg: 16078 median: 17063.5 (2%) max: 23395 Points
3DMark - 3DMark Sling Shot (ES 3.0) Unlimited
min: 1445 avg: 1525 median: 1525 (7%) max: 1605 Points
3DMark - 3DMark Sling Shot (ES 3.0) Unlimited Graphics
min: 1598 avg: 1684 median: 1684 (4%) max: 1770 Points
3DMark - 3DMark Sling Shot Extreme (ES 3.1) Unlimited
min: 1072 avg: 1215 median: 1159 (6%) max: 1414 Points
3DMark - 3DMark Sling Shot Extreme (ES 3.1) Unlimited Graphics
min: 1058 avg: 1251 median: 1142 (3%) max: 1554 Points
3DMark 11 - 3DM11 Performance Score
min: 2390 avg: 2817 median: 2920 (4%) max: 3037 Points
729 Points (1%)
min: 314 avg: 359.4 median: 343 (0%) max: 562 Points
3DMark 11 - 3DM11 Performance GPU
min: 2194 avg: 2527 median: 2612 (2%) max: 2688 Points
641 Points (1%)
min: 278 avg: 319.9 median: 298 (0%) max: 494 Points
3DMark Vantage + Intel UHD Graphics 32EUs (Alder Lake) 3DMark Vantage - 3DM Vant. Perf. total
min: 7913 avg: 9108 median: 9462 (3%) max: 9948 Points
3DM Vant. Perf. total + Intel HD Graphics (Broadwell)
2651 Points (1%)
3DM Vant. Perf. GPU no PhysX + Intel UHD Graphics 32EUs (Alder Lake) 3DMark Vantage - 3DM Vant. Perf. GPU no PhysX
min: 6818 avg: 7570 median: 7729 (4%) max: 8163 Points
3DM Vant. Perf. GPU no PhysX + Intel HD Graphics (Broadwell)
2196 Points (1%)
3DMark 06 3DMark 06 - Standard 1280x1024 + Intel UHD Graphics 32EUs (Alder Lake)
min: 9971 avg: 12006 median: 12006 (16%) max: 14041 Points
3DMark 06 - Standard 1280x1024 + Intel HD Graphics (Broadwell)
5077 Points (7%)
3DMark 06 - Standard 1280x1024 + Intel HD Graphics (Cherry Trail)
min: 2403 avg: 2833 median: 2595 (3%) max: 3330 Points
3DMark 06 - Standard 1024x768 + Intel HD Graphics (Cherry Trail)
2877 Points (4%)
Unigine Valley 1.0 - Unigine Valley 1.0 DX
min: 5.7 avg: 5.9 median: 5.9 (2%) max: 6.1 fps
1.2 fps (0%)
Unigine Heaven 2.1 - Heaven 2.1 high
10.9 fps (2%)
5.7 fps (1%)
Cinebench R10 Cinebench R10 Shading (32bit) + Intel UHD Graphics 32EUs (Alder Lake) Cinebench R10 - Cinebench R10 Shading (32bit)
min: 5716 avg: 7533 median: 6964 (5%) max: 9920 Points
Cinebench R10 Shading (32bit) + Intel HD Graphics (Broadwell)
4886 Points (3%)
Cinebench R10 Shading (32bit) + Intel HD Graphics (Cherry Trail)
min: 1192 avg: 2009 median: 1973 (1%) max: 2551 Points
Cinebench R11.5 Cinebench R11.5 OpenGL 64 Bit + Intel UHD Graphics 32EUs (Alder Lake) Cinebench R11.5 - Cinebench R11.5 OpenGL 64 Bit
min: 28.92 avg: 40.1 median: 45.3 (16%) max: 46 fps
Cinebench R11.5 OpenGL 64 Bit + Intel HD Graphics (Broadwell)
12.8 fps (4%)
Cinebench R11.5 OpenGL 64 Bit + Intel HD Graphics (Cherry Trail)
min: 4.01 avg: 8.8 median: 8.4 (3%) max: 11.71 fps
Cinebench R15 + Intel UHD Graphics 32EUs (Alder Lake) Cinebench R15 - Cinebench R15 OpenGL 64 Bit
min: 40.69 avg: 54.2 median: 58.6 (3%) max: 58.91 fps
Cinebench R15 OpenGL 64 Bit + Intel HD Graphics (Broadwell)
17.8 fps (1%)
Cinebench R15 OpenGL 64 Bit + Intel HD Graphics (Cherry Trail)
min: 6.64 avg: 10.3 median: 9.7 (1%) max: 15.52 fps
Cinebench R15 OpenGL Ref. Match 64 Bit + Intel UHD Graphics 32EUs (Alder Lake) Cinebench R15 - Cinebench R15 OpenGL Ref. Match 64 Bit
97.8 % (98%)
Cinebench R15 OpenGL Ref. Match 64 Bit + Intel HD Graphics (Broadwell)
98 % (98%)
Cinebench R15 OpenGL Ref. Match 64 Bit + Intel HD Graphics (Cherry Trail)
min: 98 avg: 98 median: 98 (98%) max: 98.6 %
GFXBench - GFXBench Car Chase Offscreen
min: 6.3 avg: 7.3 median: 7 (1%) max: 9 fps
GFXBench 3.1 - GFXBench Manhattan ES 3.1 Offscreen
17.4 fps (0%)
min: 9.2 avg: 10.8 median: 11 (0%) max: 13 fps
GFXBench 3.0 - GFXBench 3.0 Manhattan Offscreen
21.5 fps (1%)
min: 8.4 avg: 13.8 median: 13.5 (1%) max: 18 fps
GFXBench (DX / GLBenchmark) 2.7 + Intel HD Graphics (Broadwell) GFXBench (DX / GLBenchmark) 2.7 - GFXBench T-Rex HD Offscreen C24Z16
47.1 fps (0%)
GFXBench T-Rex HD Offscreen C24Z16 + Intel HD Graphics (Cherry Trail) min: 22 avg: 30.5 median: 32 (0%) max: 38.5 fps
Basemark GPU 1.2 - Basemark GPU 1.2 Vulkan Official Medium Offscreen 1080
min: 72.1 avg: 88.4 median: 88.4 (1%) max: 104.6 fps
Basemark GPU 1.2 - Basemark GPU 1.2 Vulkan Official High Offscreen 2160
5.6 fps (1%)
Geekbench 6.2 - Geekbench 6.2 GPU OpenCL
min: 5031 avg: 5954 median: 6203.5 (2%) max: 6378 Points
Geekbench 6.2 - Geekbench 6.2 GPU Vulkan
min: 6193 avg: 6857 median: 6978 (2%) max: 7279 Points
LuxMark v2.0 64Bit - LuxMark v2.0 Room GPU
min: 232 avg: 275 median: 275 (1%) max: 318 Samples/s
86 Samples/s (0%)
min: 48 avg: 58.7 median: 59 (0%) max: 69 Samples/s
LuxMark v2.0 64Bit - LuxMark v2.0 Sala GPU
min: 728 avg: 748 median: 748 (1%) max: 768 Samples/s
182 Samples/s (0%)
min: 69 avg: 87.7 median: 89 (0%) max: 105 Samples/s
ComputeMark v2.1 - ComputeMark v2.1 Result
min: 1042 avg: 1099 median: 1098.5 (1%) max: 1155 Points
374 Points (0%)
277 Points (0%)
Power Consumption - Furmark Stress Test Power Consumption - external Monitor *
min: 17.8 avg: 21.7 median: 21.5 (3%) max: 26.1 Watt
Power Consumption - The Witcher 3 Power Consumption - external Monitor *
min: 21.5 avg: 23.1 median: 23.1 (3%) max: 24.7 Watt
Power Consumption - Witcher 3 Power Consumption *
min: 26.6 avg: 27.4 median: 27.4 (6%) max: 28.2 Watt
Power Consumption - Witcher 3 ultra Power Efficiency
0.3 fps per Watt (24%)
Average Benchmarks Intel UHD Graphics 32EUs (Alder Lake) → 100% n=15 Average Benchmarks Intel HD Graphics (Broadwell) → 40% n=15 Average Benchmarks Intel HD Graphics (Cherry Trail) → 23% n=15
- Range of benchmark values for this graphics card
- Average benchmark values for this graphics card
* Smaller numbers mean a higher performance
1 This benchmark is not used for the average calculation
Game Benchmarks The following benchmarks stem from our benchmarks of review laptops. The performance depends on the used graphics memory, clock rate, processor, system settings, drivers, and operating systems. So the results don't have to be representative for all laptops with this GPU. For detailed information on the benchmark results, click on the fps number.
100%
UHD Graphics 32EUs:
37 [X] Maxtang MTN-ALN50 Intel Core i3-N305 1.8GHz
UHD Graphics 32EUs
min:
8.84 fps, P0.1:
8.99 fps, P1:
22.3 fps, max:
263 fps
fps
100%
UHD Graphics 32EUs:
26.7 [X] Maxtang MTN-ALN50 Intel Core i3-N305 1.8GHz
UHD Graphics 32EUs
min:
7.15 fps, P0.1:
8.25 fps, P1:
14.6 fps, max:
101.8 fps
fps
100%
UHD Graphics 32EUs:
24 [X] Maxtang MTN-ALN50 Intel Core i3-N305 1.8GHz
UHD Graphics 32EUs
min:
6.98 fps, P0.1:
7 fps, P1:
14.5 fps, max:
84.7 fps
fps
100%
UHD Graphics 32EUs:
16.9 fps
100%
UHD Graphics 32EUs:
11.9 fps
100%
UHD Graphics 32EUs:
10.4 fps
100%
UHD Graphics 32EUs:
7.7 fps
100%
UHD Graphics 32EUs:
27.1 fps
100%
UHD Graphics 32EUs:
19.9 fps
100%
UHD Graphics 32EUs:
13 fps
100%
UHD Graphics 32EUs:
11.4 fps
100%
UHD Graphics 32EUs:
11.3 fps
100%
UHD Graphics 32EUs:
6.4 fps
100%
UHD Graphics 32EUs:
5.3 fps
100%
UHD Graphics 32EUs:
6.9 [X] Asus BR1402FG 2.01
Intel Core i3-N305 1.8GHz
UHD Graphics 32EUs
min:
2.25 fps, max:
16.4 fps
7.3 ~ 7 fps
100%
UHD Graphics 32EUs:
5.5 fps
100%
UHD Graphics 32EUs:
16.1 fps
100%
UHD Graphics 32EUs:
14.8 fps
100%
UHD Graphics 32EUs:
11.7 fps
100%
UHD Graphics 32EUs:
11.1 fps
100%
UHD Graphics 32EUs:
14.1 fps
100%
UHD Graphics 32EUs:
11.2 fps
100%
UHD Graphics 32EUs:
27.3 [X] Maxtang MTN-ALN50 800660
Intel Core i3-N305 1.8GHz
UHD Graphics 32EUs
min:
14.7 fps, max:
57.7 fps
fps
100%
UHD Graphics 32EUs:
21.1 [X] Maxtang MTN-ALN50 800660
Intel Core i3-N305 1.8GHz
UHD Graphics 32EUs
min:
14.5 fps, max:
37.1 fps
fps
100%
UHD Graphics 32EUs:
15.9 [X] Maxtang MTN-ALN50 800660
Intel Core i3-N305 1.8GHz
UHD Graphics 32EUs
min:
10.9 fps, max:
30.9 fps
fps
100%
UHD Graphics 32EUs:
46 [X] Maxtang MTN-ALN50 874931
Intel Core i3-N305 1.8GHz
UHD Graphics 32EUs
min:
35 fps, P1:
34 fps, max:
52 fps
fps
100%
UHD Graphics 32EUs:
18.3 [X] Maxtang MTN-ALN50 874931
Intel Core i3-N305 1.8GHz
UHD Graphics 32EUs
min:
14 fps, P1:
14 fps, max:
20 fps
fps
100%
UHD Graphics 32EUs:
16.5 [X] Maxtang MTN-ALN50 874931
Intel Core i3-N305 1.8GHz
UHD Graphics 32EUs
min:
13 fps, P1:
13 fps, max:
18 fps
fps
100%
UHD Graphics 32EUs:
10.5 [X] Maxtang MTN-ALN50 874931
Intel Core i3-N305 1.8GHz
UHD Graphics 32EUs
min:
7 fps, P1:
8 fps, max:
12 fps
fps
100%
UHD Graphics 32EUs:
35.4 fps
100%
UHD Graphics 32EUs:
18.8 fps
100%
UHD Graphics 32EUs:
14 fps
100%
UHD Graphics 32EUs:
8.7 fps
100%
UHD Graphics 32EUs:
21 fps
100%
UHD Graphics 32EUs:
11 fps
100%
UHD Graphics 32EUs:
10 fps
100%
UHD Graphics 32EUs:
9 fps
100%
UHD Graphics 32EUs:
16.5 fps
100%
UHD Graphics 32EUs:
9.2 fps
100%
UHD Graphics 32EUs:
8.6 fps
100%
UHD Graphics 32EUs:
32.5 [X] Zotac ZBOX PI430AJ 1.47.22.14 D3D12
Intel Core i3-N300 GHz
UHD Graphics 32EUs
min:
5 fps, P1:
9.8 fps, max:
142 fps
39.2 [X] Asus BR1402FG 1.47.22.14 D3D12
Intel Core i3-N305 1.8GHz
UHD Graphics 32EUs
min:
8.9 fps, P1:
12.8 fps, max:
240 fps
41.3 [X] Maxtang MTN-ALN50 1.47.22.14 D3D12
Intel Core i3-N305 1.8GHz
UHD Graphics 32EUs
min:
9.9 fps, P1:
13.1 fps, max:
216 fps
44.1 ~ 39 fps
100%
UHD Graphics 32EUs:
13.5 [X] Maxtang MTN-ALN50 1.47.22.14 D3D12
Intel Core i3-N305 1.8GHz
UHD Graphics 32EUs
min:
5 fps, P1:
5.14 fps, max:
149.3 fps
13.7 [X] Zotac ZBOX PI430AJ 1.47.22.14 D3D12
Intel Core i3-N300 GHz
UHD Graphics 32EUs
min:
5 fps, P1:
5.33 fps, max:
107.4 fps
15.2 [X] Asus BR1402FG 1.47.22.14 D3D12
Intel Core i3-N305 1.8GHz
UHD Graphics 32EUs
min:
5 fps, P1:
5.2 fps, max:
176.4 fps
17.2 ~ 15 fps
100%
UHD Graphics 32EUs:
11.5 [X] Zotac ZBOX PI430AJ 1.47.22.14 D3D12
Intel Core i3-N300 GHz
UHD Graphics 32EUs
min:
5 fps, P1:
5 fps, max:
125.8 fps
13.4 [X] Asus BR1402FG 1.47.22.14 D3D12
Intel Core i3-N305 1.8GHz
UHD Graphics 32EUs
min:
5 fps, P1:
5 fps, max:
198.8 fps
13.5 [X] Maxtang MTN-ALN50 1.47.22.14 D3D12
Intel Core i3-N305 1.8GHz
UHD Graphics 32EUs
min:
5 fps, P1:
5 fps, max:
181.9 fps
13.8 ~ 13 fps
100%
UHD Graphics 32EUs:
14.5 [X] Maxtang MTN-ALN50 1.47.22.14 D3D12
Intel Core i3-N305 1.8GHz
UHD Graphics 32EUs
min:
5 fps, P1:
5 fps, max:
232 fps
fps
100%
UHD Graphics 32EUs:
20 21 ~ 21 fps
100%
UHD Graphics 32EUs:
9 10 ~ 10 fps
100%
UHD Graphics 32EUs:
9 9 ~ 9 fps
100%
UHD Graphics 32EUs:
8 8 ~ 8 fps
HD Graphics (Cherry Trail):
21.4 fps
HD Graphics (Cherry Trail):
15.5 fps
HD Graphics (Cherry Trail):
22.6 [X] Chuwi Hi12 Intel Atom x5-Z8300 1.4GHz
HD Graphics (Cherry Trail)
min:
21 fps, max:
27 fps
fps
HD Graphics (Cherry Trail):
11.5 fps
HD Graphics (Cherry Trail):
7 fps
HD Graphics (Broadwell):
15.3 fps
HD Graphics (Cherry Trail):
8.8 fps
HD Graphics (Broadwell):
8.5 fps
HD Graphics (Cherry Trail):
4.8 fps
HD Graphics (Cherry Trail):
8.1 fps
HD Graphics (Cherry Trail):
3.9 fps
HD Graphics (Broadwell):
38.1 fps
HD Graphics (Broadwell):
20.6 fps
HD Graphics (Broadwell):
29 fps
HD Graphics (Cherry Trail):
13.9 [X] Chuwi Hi12 Intel Atom x5-Z8300 1.4GHz
HD Graphics (Cherry Trail)
min:
7 fps, max:
19 fps
16.8 ~ 15 fps
HD Graphics (Broadwell):
20.8 fps
HD Graphics (Cherry Trail):
15.1 fps
HD Graphics (Cherry Trail):
9.8 fps
32%
HD Graphics (Cherry Trail):
20 [X] Chuwi Hi12 Intel Atom x5-Z8300 1.4GHz
HD Graphics (Cherry Trail)
min:
18 fps
fps
34%
HD Graphics (Cherry Trail):
15.2 [X] Chuwi Hi12 Intel Atom x5-Z8300 1.4GHz
HD Graphics (Cherry Trail)
min:
13 fps
fps
27%
HD Graphics (Cherry Trail):
7.2 [X] Chuwi Hi12 Intel Atom x5-Z8300 1.4GHz
HD Graphics (Cherry Trail)
min:
6 fps
fps
100%
UHD Graphics 32EUs:
16 38.1 [X] Maxtang MTN-ALN50 Intel Core i3-N305 1.8GHz
UHD Graphics 32EUs
min:
11.2 fps, P0.1:
17.5 fps, P1:
20.5 fps, max:
132.2 fps
38.7 ~ 31 fps
100%
UHD Graphics 32EUs:
12 25.1 ~ 19 fps
100%
UHD Graphics 32EUs:
12.3 [X] Maxtang MTN-ALN50 Intel Core i3-N305 1.8GHz
UHD Graphics 32EUs
min:
4.16 fps, P0.1:
5.96 fps, P1:
6.76 fps, max:
52.8 fps
13 ~ 13 fps
100%
UHD Graphics 32EUs:
5.4 [X] Asus BR1402FG Intel Core i3-N305 1.8GHz
UHD Graphics 32EUs
min:
4 fps, P1:
5 fps, max:
6 fps
5.5 [X] Maxtang MTN-ALN50 Intel Core i3-N305 1.8GHz
UHD Graphics 32EUs
min:
3.3 fps, P0.1:
3.31 fps, P1:
3.4 fps, max:
13.5 fps
7 ~ 6 fps
HD Graphics (Broadwell):
50 fps
HD Graphics (Cherry Trail):
20.1 fps
HD Graphics (Broadwell):
13.5 fps
HD Graphics (Cherry Trail):
12.5 fps
100%
UHD Graphics 32EUs:
35.7 [X] Zotac ZBOX PI430AJ Intel Core i3-N300 GHz
UHD Graphics 32EUs
min:
2.51 fps, P1:
15.9 fps, max:
59.5 fps
50.8 [X] Asus BR1402FG Intel Core i3-N305 1.8GHz
UHD Graphics 32EUs
min:
2.27 fps, P1:
23.8 fps, max:
88.3 fps
55.6 [X] Maxtang MTN-ALN50 Intel Core i3-N305 1.8GHz
UHD Graphics 32EUs
min:
14.1 fps, P1:
35.7 fps, max:
87.7 fps
61.9 ~ 51 fps
21%
HD Graphics (Cherry Trail):
10.8 (!) [X] Microsoft Surface 3 Intel Atom x7-Z8700 1.6GHz
HD Graphics (Cherry Trail)
fps
100%
UHD Graphics 32EUs:
9.4 fps
100%
UHD Graphics 32EUs:
4 fps
HD Graphics (Broadwell):
23.9 fps
HD Graphics (Broadwell):
16.4 fps
HD Graphics (Broadwell):
13.9 fps
HD Graphics (Cherry Trail):
9.5 fps
HD Graphics (Broadwell):
9.4 fps
HD Graphics (Cherry Trail):
5.7 fps
HD Graphics (Cherry Trail):
16.2 fps
HD Graphics (Cherry Trail):
6.1 fps
HD Graphics (Broadwell):
34 fps
HD Graphics (Cherry Trail):
16 fps
HD Graphics (Broadwell):
24 fps
HD Graphics (Cherry Trail):
12 fps
HD Graphics (Cherry Trail):
15.6 fps
HD Graphics (Broadwell):
113.6 fps
HD Graphics (Broadwell):
26.3 fps
HD Graphics (Cherry Trail):
5.5 10 ~ 8 fps
HD Graphics (Broadwell):
57.6 fps
HD Graphics (Cherry Trail):
22 27.3 ~ 25 fps
HD Graphics (Broadwell):
22.6 fps
HD Graphics (Cherry Trail):
12.5 13.5 ~ 13 fps
HD Graphics (Cherry Trail):
13.3 fps
HD Graphics (Cherry Trail):
58 fps
HD Graphics (Cherry Trail):
47 fps
HD Graphics (Cherry Trail):
29.7 fps
HD Graphics (Cherry Trail):
16.5 fps
HD Graphics (Cherry Trail):
24 fps
HD Graphics (Cherry Trail):
13.5 fps
HD Graphics (Broadwell):
13.7 fps
HD Graphics (Broadwell):
10.7 fps
HD Graphics (Broadwell):
7 fps
HD Graphics (Broadwell):
25.3 fps
HD Graphics (Cherry Trail):
16 18 18.9 [X] Medion Akoya E2215T Intel Atom x5-Z8350 1.4GHz
HD Graphics (Cherry Trail)
19.8 20.1 20.5 ~ 19 fps
HD Graphics (Broadwell):
14.1 fps
HD Graphics (Cherry Trail):
6.4 7.9 [X] Medion Akoya E2215T Intel Atom x5-Z8350 1.4GHz
HD Graphics (Cherry Trail)
9.3 9.8 10 10 ~ 9 fps
HD Graphics (Broadwell):
11.7 fps
HD Graphics (Cherry Trail):
5.6 5.7 [X] Medion Akoya E2215T Intel Atom x5-Z8350 1.4GHz
HD Graphics (Cherry Trail)
6.7 7.6 7.9 8.4 ~ 7 fps
HD Graphics (Cherry Trail):
2.4 2.6 ~ 2 fps
HD Graphics (Broadwell):
34.7 fps
HD Graphics (Broadwell):
17.7 fps
HD Graphics (Broadwell):
11.7 fps
HD Graphics (Cherry Trail):
7 8.3 9 ~ 8 fps
HD Graphics (Cherry Trail):
3.7 3.8 ~ 4 fps
HD Graphics (Cherry Trail):
34 fps
HD Graphics (Broadwell):
15.6 fps
HD Graphics (Broadwell):
11.4 fps
HD Graphics (Broadwell):
5.3 fps
HD Graphics (Cherry Trail):
15.2 fps
HD Graphics (Cherry Trail):
11.6 fps
HD Graphics (Cherry Trail):
0 (!) [X] Microsoft Surface 3 Intel Atom x7-Z8700 1.6GHz
HD Graphics (Cherry Trail)
fps
HD Graphics (Cherry Trail):
0 (!) [X] Microsoft Surface 3 Intel Atom x7-Z8700 1.6GHz
HD Graphics (Cherry Trail)
fps
HD Graphics (Broadwell):
43.7 fps
HD Graphics (Broadwell):
31.5 fps
HD Graphics (Broadwell):
23.9 fps
HD Graphics (Cherry Trail):
20.3 fps
HD Graphics (Cherry Trail):
11.4 fps
HD Graphics (Broadwell):
38.4 fps
HD Graphics (Cherry Trail):
24.3 [X] Chuwi Hi12 Intel Atom x5-Z8300 1.4GHz
HD Graphics (Cherry Trail)
min:
20 fps, max:
29 fps
31.9 ~ 28 fps
HD Graphics (Broadwell):
24.9 fps
HD Graphics (Cherry Trail):
16 [X] Chuwi Hi12 Intel Atom x5-Z8300 1.4GHz
HD Graphics (Cherry Trail)
min:
13 fps, max:
19 fps
19 ~ 18 fps
HD Graphics (Broadwell):
19.7 fps
HD Graphics (Cherry Trail):
8 fps
HD Graphics (Cherry Trail):
15.5 18.9 ~ 17 fps
HD Graphics (Cherry Trail):
7.2 8.5 ~ 8 fps
HD Graphics (Cherry Trail):
25.6 fps
HD Graphics (Cherry Trail):
12 fps
HD Graphics (Cherry Trail):
28.1 fps
HD Graphics (Cherry Trail):
12.5 fps
HD Graphics (Cherry Trail):
18.7 fps
HD Graphics (Cherry Trail):
63.2 64 ~ 64 fps
HD Graphics (Cherry Trail):
18 18.8 ~ 18 fps
HD Graphics (Cherry Trail):
14 fps
HD Graphics (Cherry Trail):
7 fps
HD Graphics (Cherry Trail):
44 50.9 [X] Chuwi Hi12 Intel Atom x5-Z8300 1.4GHz
HD Graphics (Cherry Trail)
min:
40 fps, max:
60 fps
~ 47 fps
HD Graphics (Cherry Trail):
18.3 [X] Chuwi Hi12 Intel Atom x5-Z8300 1.4GHz
HD Graphics (Cherry Trail)
min:
13 fps, max:
29 fps
fps
Average Gaming Intel UHD Graphics 32EUs (Alder Lake) → 100% Average Gaming 30-70 fps → 100%
Average Gaming Intel HD Graphics (Cherry Trail) → 28%  Deutsch
 English
 Español
 Français
 Italiano
 Nederlands
 Polski
 Português
 Русский
 Türkçe
 Svenska
 Chinese
 Magyar