Intel UHD Graphics 32EUs (Alder Lake) vs Intel HD Graphics (Broadwell) vs Intel HD Graphics (Bay Trail)
Intel UHD Graphics 32EUs (Alder Lake) ► remove from comparison
Die Intel Xe Graphics 32 EUS (Alder Lake) ist eine Prozessorgrafikkarte, die Anfang 2023 vorgestellt wurde. Sie basiert auf die Xe Architektur (Gen12) und bietet in Alder Lake CPUs nur 32 der 96 verbauten Execution Units (EUs). Die GPU wird im verbesserten 10nm Verfahren (Intel 7) bei Intel gefertigt. Die Rohleistung ist vergleichbar mit der Radeon RX Vega 6 (in Ryzen 5000 CPUs), jedoch ist die Spieleleistung geringer durch den schwächeren Treibersupport (in 2022). Nur anspruchslose Spiele wie Dota 2 Reborn sind mit geringsten Settings flüssig spielbar (siehe unten).
Intel HD Graphics (Broadwell) ► remove from comparison
The Intel HD Graphics (Broadwell) (GT1) is an integrated Broadwell graphics card revealed in Q1 2015. It can be found in several low-end CPUs such as the Pentium 3805U or Celeron 3755U . The so-called GT1 GPU offers 12 EUs (Execution Units) and therefore somewhat more shader power than the previous HD Graphics (Haswell) . The clock range may depend on the specific model it is built into.
Architecture and Features
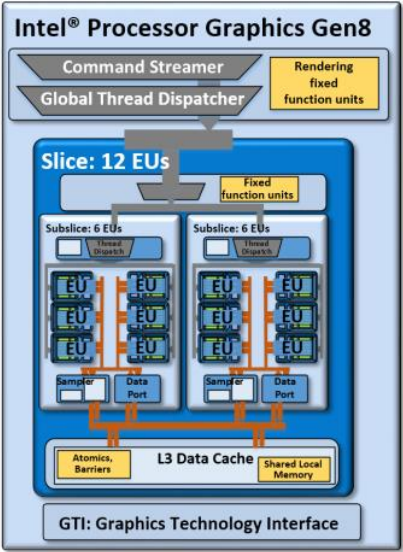
Broadwell features a GPU based on the Intel Gen8 architecture, which has been optimized in various aspects compared to the previous Gen7.5 (Haswell). In case of the GT1 version, the shader arrays called "subslice" have been reorganized and now offer 6 Execution Units (EUs) each. Two subslices form a "slice" for a total of 12 EUs. Combined with other improvements such as larger L1 caches and an optimized frontend, the integrated GPU has become faster and more efficient than its predecessor.
The HD Graphics (Broadwell) represents the low-end version of the Broadwell GPU family and consists of one slice with 12 EUs. Beyond that, there is also a mid-range variant (GT2, 24 EUs) as well as higher-end models (GT3/GT3e + eDRAM, 48 EUs).
All Broadwell GPUs support OpenCL 2.0 and DirectX 12 (FL 11_1). The video engine can now decode H.265 using both fixed function hardware as well as available GPU shaders. Up to three displays can be connected via DP 1.2/eDP 1.3 (max. 3840 x 2160 @ 60 Hz) or HDMI 1.4a (max. 3840 x 2160 @ 24 Hz). HDMI 2.0, however, is not supported.
Performance
Even though the HD Graphics (Broadwell) is clocked a bit lower, the performance should be clearly above the HD Graphics (Haswell) and similar to the HD Graphics 4000 . Nevertheless, only a few games as of 2014/2015 will run fluently at (very) low settings, e.g. Dota 2 or Sims 4.
Power Consumption
Utilizing a new 14 nm process, the HD Graphics (Broadwell) can be found in ULV models (15 W) as well as regular dual core CPUs (37 W, not yet presented). The TDP is flexible and can be further reduced, which has a significant impact on performance.
Intel HD Graphics (Bay Trail) ► remove from comparison
The Intel HD Graphics (Bay Trail) is a low-end integrated Bay Trail graphics card found in certain Atom models (Z3770 ), nettops (J2850 ) and notebook SoCs (N3510 ). It supports DirectX 11 and is based on the Ivy Bridge GPU. Clock rates and shader cores, however, are considerably lower.
Compared to Ivy Bridge, which offers either 6 or 16 Execution Units, the HD Graphics (Bay Trail) comes with only 4 EUs. The core clock is significantly lower as well. Depending on the specific model, the maximum Turbo Boost is 896 MHz or less and the memory controller can support DDR3(L), DDR3L-RS or LPDDR3 in single- or dual-channel operation.
The fastest notebook models equipped with this GPU nearly match the performance of the HD Graphics (Sandy Bridge) and the AMD Radeon HD 6310 . Therefore, older and less demanding Windows games like World of Warcraft or Half-Life 2 can be played fluently in very low settings. Performance is not sufficient for most modern titles.
Compared to competing ARM SoCs, Bay Trail outperforms the Adreno 320 (which can be found in different Qualcomm SoCs like the Snapdragon 600 ) and offers a performance similar to the Tegra 4 GPU. That is enough power to run even the most demanding Android games smoothly in very high resolutions as of 2013.
The integrated video decoder supports all popular codecs such as MPEG2, H.264, VC1, VP8 and MVC and is suitable for resolutions up to 4K up to 100 Mbit/s. The user can connect up to two displays via HDMI 1.4 (max. 1920 x 1080) or DisplayPort 1.2 (max. 2560 x 1600). Another new feature is the support for Wireless Display and Quick Sync, Intel's fast and power efficient H-264 hardware encoder. Some of these features are not available on all models.
Depending on the model, the power consumption of the entire SoC is somewhere between 2 and 10 W. The most efficient versions are therefore suitable for passively cooled tablets, whereas faster variants are used in larger subnotebooks with active cooling.
Intel UHD Graphics 32EUs (Alder Lake) Intel HD Graphics (Broadwell) Intel HD Graphics (Bay Trail) HD Graphics Series Codename Alder Lake Xe Broadwell GT1 Bay Trail Pipelines 32 - unified 12 - unified 4 - unified Core Speed 1250 MHz 100 - 850 (Boost) MHz 311 - 896 (Boost) MHz Shared Memory yes yes yes API DirectX 12_1, OpenGL 4.6 DirectX 12 (FL 11_1), OpenGL 4.3 DirectX 11, Shader 5.0, OpenGL 4.0, ES 3.0 Architecture Gen. 8 Broadwell Gen. 7 Ivy Bridge Memory Bus Width 64/128 Bit 32/64/128 Bit technology 14 nm 22 nm Features QuickSync Date of Announcement 05.01.2015 11.09.2013
CPU in UHD Graphics 32EUs GPU Base Speed GPU Boost / Turbo Intel Core i3-N305 8 x 1800 MHz, 15 W 1000 MHz 1250 MHz
CPU in HD Graphics (Broadwell) GPU Base Speed GPU Boost / Turbo Intel Pentium 3825U 2 x 1900 MHz, 15 W 100 MHz 850 MHz Intel Celeron 3765U 2 x 1900 MHz, 15 W 300 MHz 850 MHz Intel Pentium 3805U 2 x 1900 MHz, 15 W 100 MHz 800 MHz » show 3 more Intel Celeron 3755U 2 x 1700 MHz, 15 W 100 MHz 800 MHz Intel Celeron 3215U 2 x 1700 MHz, 15 W 300 MHz 850 MHz Intel Celeron 3205U 2 x 1500 MHz, 15 W 100 MHz 800 MHz min. - max. 100 - 1000 MHz 800 - 1250 MHz
CPU in HD Graphics (Bay Trail) GPU Base Speed GPU Boost / Turbo Intel Pentium N3540 4 x 2160 MHz, 7.5 W 313 MHz 896 MHz Intel Pentium J2900 4 x 2410 MHz, 10 W 688 MHz 896 MHz Intel Pentium N3530 4 x 2160 MHz, 7.5 W 313 MHz 896 MHz » show 43 more Intel Pentium J2850 4 x 2400 MHz, 10 W 688 MHz 792 MHz Intel Pentium N3520 4 x 2167 MHz, 7.5 W 313 MHz 854 MHz Intel Celeron J1900 4 x 2000 MHz, 10 W 688 MHz 854 MHz Intel Atom Z3795 4 x 1590 MHz, <4 W 311 MHz 778 MHz Intel Atom Z3785 4 x 1490 MHz, <4 W 313 MHz 833 MHz Intel Atom Z3775 4 x 1460 MHz, <4 W 311 MHz 778 MHz Intel Atom Z3775D 4 x 1490 MHz, <4 W 311 MHz 792 MHz Intel Atom Z3770 4 x 1460 MHz, <4 W 311 MHz 667 MHz Intel Atom Z3770D 4 x 1500 MHz, 4 W 313 MHz 688 MHz Intel Celeron N2940 4 x 1830 MHz, 7.5 W 313 MHz 854 MHz Intel Celeron N2930 4 x 1830 MHz, 7.5 W 313 MHz 854 MHz Intel Celeron J1850 4 x 2000 MHz, 10 W 688 MHz 792 MHz Intel Pentium N3510 4 x 2000 MHz, 7.5 W 313 MHz 750 MHz Intel Celeron N2920 4 x 1860 MHz, 7.5 W 313 MHz 854 MHz Intel Atom E3845 4 x 1910 MHz, 10 W 542 MHz 792 MHz Intel Atom Z3736F 4 x 1330 MHz, 4 W 313 MHz 646 MHz Intel Atom Z3736G 4 x 1330 MHz, <4 W 313 MHz 646 MHz Intel Atom Z3745 4 x 1330 MHz, <4 W 311 MHz 778 MHz Intel Atom Z3745D 4 x 1330 MHz, <4 W 311 MHz 792 MHz Intel Atom Z3740 4 x 1330 MHz, <4 W 311 MHz 667 MHz Intel Atom Z3740D 4 x 1330 MHz, <4 W 313 MHz 688 MHz Intel Atom Z3735D 4 x 1330 MHz, <4 W 311 MHz 646 MHz Intel Atom Z3735E 4 x 1330 MHz, <4 W 311 MHz 646 MHz Intel Atom Z3735F 4 x 1330 MHz, <4 W 311 MHz 646 MHz Intel Atom Z3735G 4 x 1330 MHz, <4 W 311 MHz 646 MHz Intel Celeron J1800 2 x 2410 MHz, 10 W 688 MHz 792 MHz Intel Celeron N2840 2 x 2160 MHz, 7.5 W 313 MHz 792 MHz Intel Celeron J1750 2 x 2410 MHz, 10 W 688 MHz 750 MHz Intel Celeron N2910 4 x 1600 MHz, 7.5 W 313 MHz 756 MHz Intel Celeron N2830 2 x 2160 MHz, 7.5 W 313 MHz 750 MHz Intel Celeron N2820 2 x 2170 MHz, 7.5 W 313 MHz 756 MHz Intel Celeron N2815 2 x 1860 MHz, 7.5 W 313 MHz 756 MHz Intel Celeron N2810 2 x 2000 MHz, 7.5 W 313 MHz 756 MHz Intel Atom Z3680 2 x 1330 MHz, 4 W 311 MHz 667 MHz Intel Atom Z3680D 2 x 1330 MHz, 4 W 313 MHz 688 MHz Intel Celeron N2808 2 x 1580 MHz, 4.3 W 313 MHz 792 MHz Intel Celeron N2807 2 x 1580 MHz, 4.3 W 313 MHz 750 MHz Intel Celeron N2806 2 x 1580 MHz, 4.5 W 313 MHz 756 MHz Intel Atom E3827 2 x 1750 MHz, 8 W 542 MHz 792 MHz Intel Atom E3826 2 x 1460 MHz, 7 W 533 MHz 667 MHz Intel Celeron N2805 2 x 1460 MHz, 4.3 W 313 MHz 667 MHz Intel Atom E3825 2 x 1330 MHz, 6 W ? MHz 533 MHz Intel Atom E3815 1 x 1460 MHz, 5 W ? MHz 400 MHz min. - max. 100 - ? MHz 400 - 1250 MHz
Benchmarks Performance Rating - 3DMark 11 + Fire Strike + Time Spy - UHD Graphics 32EUs
0.9 pt (3%)
...
Intel UHD Graphics 32EUs (Alder Lake)
NVIDIA GeForce GTX 460 768MB
...
Performance Rating - 3DMark 11 + Fire Strike + Time Spy - HD Graphics (Broadwell)
0.2 pt (1%)
...
Intel HD Graphics (Broadwell)
...
Performance Rating - 3DMark 11 + Fire Strike + Time Spy - HD Graphics (Bay Trail)
0.1 pt (0%)
Intel HD Graphics (Bay Trail)
...
3DMark - 3DMark Time Spy Score
min: 599 avg: 626 median: 613 (2%) max: 666 Points
3DMark - 3DMark Time Spy Graphics
min: 523 avg: 547 median: 536 (1%) max: 583 Points
3DMark - 3DMark Ice Storm Unlimited Graphics
min: 64090 avg: 76155 median: 76154.5 (9%) max: 88219 Points
min: 11835 avg: 14513 median: 14748.5 (2%) max: 17613 Points
3DMark - 3DMark Ice Storm Extreme Graphics
min: 38285 avg: 38839 median: 38839 (5%) max: 39393 Points
min: 4751 avg: 7342 median: 7498 (1%) max: 9234 Points
3DMark - 3DMark Cloud Gate Score
min: 7939 avg: 10785 median: 11402.5 (12%) max: 12397 Points
3398 Points (4%)
min: 354 avg: 1182 median: 1188 (1%) max: 1703 Points
3DMark - 3DMark Cloud Gate Graphics
min: 10945 avg: 12633 median: 12687 (3%) max: 14214 Points
4015 Points (1%)
min: 362 avg: 1230 median: 1228.5 (0%) max: 1670 Points
3DMark - 3DMark Fire Strike Standard Score
min: 1574 avg: 1726 median: 1733 (3%) max: 1862 Points
428 Points (1%)
min: 83 avg: 185 median: 147 (0%) max: 495 Points
3DMark - 3DMark Fire Strike Standard Graphics
min: 1736 avg: 1880 median: 1894.5 (2%) max: 1995 Points
463 Points (1%)
min: 90 avg: 149.1 median: 149 (0%) max: 200 Points
3DMark - 3DMark Ice Storm Graphics
min: 53717 avg: 54586 median: 54586 (7%) max: 55455 Points
45539 Points (5%)
min: 5056 avg: 15391 median: 16047 (2%) max: 21351 Points
3DMark 11 - 3DM11 Performance Score
min: 2390 avg: 2817 median: 2920 (4%) max: 3037 Points
729 Points (1%)
min: 143 avg: 222.6 median: 216 (0%) max: 280 Points
3DMark 11 - 3DM11 Performance GPU
min: 2194 avg: 2527 median: 2612 (2%) max: 2688 Points
641 Points (1%)
min: 122 avg: 192.1 median: 186.5 (0%) max: 237 Points
3DMark Vantage + Intel UHD Graphics 32EUs (Alder Lake) 3DMark Vantage - 3DM Vant. Perf. total
min: 7913 avg: 9108 median: 9462 (3%) max: 9948 Points
3DM Vant. Perf. total + Intel HD Graphics (Broadwell)
2651 Points (1%)
3DM Vant. Perf. total + Intel HD Graphics (Bay Trail) min: 507 avg: 666 median: 637 (0%) max: 846 Points
3DM Vant. Perf. GPU no PhysX + Intel UHD Graphics 32EUs (Alder Lake) 3DMark Vantage - 3DM Vant. Perf. GPU no PhysX
min: 6818 avg: 7570 median: 7729 (4%) max: 8163 Points
3DM Vant. Perf. GPU no PhysX + Intel HD Graphics (Broadwell)
2196 Points (1%)
3DM Vant. Perf. GPU no PhysX + Intel HD Graphics (Bay Trail) min: 395 avg: 512 median: 503 (0%) max: 667 Points
3DMark 2001SE - 3DMark 2001 - Standard
7727 Points (8%)
3DMark 03 - 3DMark 03 - Standard
min: 4226 avg: 4997 median: 5220 (3%) max: 5323 Points
3DMark 05 - 3DMark 05 - Standard
min: 2666 avg: 3195 median: 3331 (4%) max: 3445 Points
3DMark 06 3DMark 06 - Standard 1280x1024 + Intel UHD Graphics 32EUs (Alder Lake)
min: 9971 avg: 12006 median: 12006 (16%) max: 14041 Points
3DMark 06 - Standard 1280x1024 + Intel HD Graphics (Broadwell)
5077 Points (7%)
3DMark 06 - Standard 1280x1024 + Intel HD Graphics (Bay Trail)
min: 814 avg: 1785 median: 1866 (2%) max: 2151 Points
3DMark 06 - Score Unknown Settings + Intel HD Graphics (Bay Trail)
2108 Points (3%)
3DMark 06 - Standard 1280x800 + Intel HD Graphics (Bay Trail)
2087 Points (3%)
Unigine Valley 1.0 - Unigine Valley 1.0 DX
min: 5.7 avg: 5.9 median: 5.9 (2%) max: 6.1 fps
Unigine Heaven 3.0 - Unigine Heaven 3.0 DX 11
3.6 fps (1%)
Unigine Heaven 2.1 - Heaven 2.1 high
10.9 fps (2%)
min: 2.4 avg: 2.8 median: 2.8 (1%) max: 3.4 fps
Cinebench R10 Cinebench R10 Shading (32bit) + Intel UHD Graphics 32EUs (Alder Lake) Cinebench R10 - Cinebench R10 Shading (32bit)
min: 5716 avg: 7533 median: 6964 (5%) max: 9920 Points
Cinebench R10 Shading (32bit) + Intel HD Graphics (Broadwell)
4886 Points (3%)
Cinebench R10 Shading (32bit) + Intel HD Graphics (Bay Trail)
min: 898 avg: 2014 median: 1991.5 (1%) max: 2889 Points
Cinebench R11.5 Cinebench R11.5 OpenGL 64 Bit + Intel UHD Graphics 32EUs (Alder Lake) Cinebench R11.5 - Cinebench R11.5 OpenGL 64 Bit
min: 28.92 avg: 40.1 median: 45.3 (16%) max: 46 fps
Cinebench R11.5 OpenGL 64 Bit + Intel HD Graphics (Broadwell)
12.8 fps (4%)
Cinebench R11.5 OpenGL 64 Bit + Intel HD Graphics (Bay Trail)
min: 0.37 avg: 6.2 median: 6.4 (2%) max: 7.69 fps
Cinebench R15 + Intel UHD Graphics 32EUs (Alder Lake) Cinebench R15 - Cinebench R15 OpenGL 64 Bit
min: 40.69 avg: 54.2 median: 58.6 (3%) max: 58.91 fps
Cinebench R15 OpenGL 64 Bit + Intel HD Graphics (Broadwell)
17.8 fps (1%)
Cinebench R15 OpenGL 64 Bit + Intel HD Graphics (Bay Trail) min: 2.88 avg: 5 median: 5.5 (0%) max: 6.55 fps
Cinebench R15 OpenGL Ref. Match 64 Bit + Intel UHD Graphics 32EUs (Alder Lake) Cinebench R15 - Cinebench R15 OpenGL Ref. Match 64 Bit
97.8 % (98%)
Cinebench R15 OpenGL Ref. Match 64 Bit + Intel HD Graphics (Broadwell)
98 % (98%)
Cinebench R15 OpenGL Ref. Match 64 Bit + Intel HD Graphics (Bay Trail)
min: 63 avg: 96.1 median: 97.8 (98%) max: 97.8 %
GFXBench 3.1 - GFXBench Manhattan ES 3.1 Offscreen
17.4 fps (0%)
5.2 fps (0%)
GFXBench 3.0 - GFXBench 3.0 Manhattan Offscreen
21.5 fps (1%)
min: 6 avg: 9.7 median: 8.8 (1%) max: 16 fps
GFXBench (DX / GLBenchmark) 2.7 + Intel HD Graphics (Broadwell) GFXBench (DX / GLBenchmark) 2.7 - GFXBench T-Rex HD Offscreen C24Z16
47.1 fps (0%)
GFXBench T-Rex HD Offscreen C24Z16 + Intel HD Graphics (Bay Trail) min: 6 avg: 15.7 median: 16 (0%) max: 20.2 fps
Basemark ES 2.0 - Basemark ES 2.0
min: 45.08 avg: 49.1 median: 49.1 (81%) max: 53.1 fps
Basemark X 1.0 - Basemark X 1.0 Off-Screen
10.1 fps (48%)
Basemark X 1.1 - Basemark X 1.1 High Quality
min: 3008 avg: 6663 median: 8456 (19%) max: 8524 Points
Basemark X 1.1 - Basemark X 1.1 Medium Quality
min: 4802 avg: 12880 median: 14509 (32%) max: 17701 Points
Basemark GPU 1.2 - Basemark GPU 1.2 Vulkan Official Medium Offscreen 1080
min: 72.1 avg: 88.4 median: 88.4 (1%) max: 104.6 fps
Basemark GPU 1.2 - Basemark GPU 1.2 Vulkan Official High Offscreen 2160
5.6 fps (1%)
NenaMark2 - NenaMark2 Score
min: 59 avg: 59.4 median: 59.4 (88%) max: 59.7 fps
Geekbench 6.2 - Geekbench 6.2 GPU OpenCL
min: 5031 avg: 5954 median: 6203.5 (2%) max: 6378 Points
Geekbench 6.2 - Geekbench 6.2 GPU Vulkan
min: 6193 avg: 6857 median: 6978 (2%) max: 7279 Points
LuxMark v2.0 64Bit - LuxMark v2.0 Room GPU
min: 232 avg: 275 median: 275 (1%) max: 318 Samples/s
86 Samples/s (0%)
min: 25 avg: 28.5 median: 27 (0%) max: 35 Samples/s
LuxMark v2.0 64Bit - LuxMark v2.0 Sala GPU
min: 728 avg: 748 median: 748 (1%) max: 768 Samples/s
182 Samples/s (0%)
min: 26 avg: 29 median: 29 (0%) max: 34 Samples/s
ComputeMark v2.1 - ComputeMark v2.1 Result
min: 1042 avg: 1099 median: 1098.5 (1%) max: 1155 Points
374 Points (0%)
min: 160 avg: 172.8 median: 174 (0%) max: 192 Points
PassMark PerformanceTest Mobile V1 - PerformanceTest Mobile V1 2D Graphics Tests
min: 3822 avg: 4036 median: 3866 (4%) max: 4588 Points
PassMark PerformanceTest Mobile V1 - PerformanceTest Mobile V1 3D Graphics Tests
min: 1058 avg: 1251 median: 1228 (2%) max: 1488 Points
Smartbench 2012 - Smartbench 2012 Gaming Index
min: 2679 avg: 3414 median: 3385 (74%) max: 4274 Points
Power Consumption - Furmark Stress Test Power Consumption - external Monitor *
min: 17.8 avg: 21.7 median: 21.5 (3%) max: 26.1 Watt
Power Consumption - The Witcher 3 Power Consumption - external Monitor *
min: 21.5 avg: 23.1 median: 23.1 (3%) max: 24.7 Watt
Power Consumption - Witcher 3 Power Consumption *
min: 26.6 avg: 27.4 median: 27.4 (6%) max: 28.2 Watt
Power Consumption - Witcher 3 ultra Power Efficiency
0.3 fps per Watt (24%)
Average Benchmarks Intel UHD Graphics 32EUs (Alder Lake) → 100% n=17 Average Benchmarks Intel HD Graphics (Broadwell) → 39% n=17 Average Benchmarks Intel HD Graphics (Bay Trail) → 17% n=17
- Range of benchmark values for this graphics card
- Average benchmark values for this graphics card
* Smaller numbers mean a higher performance
1 This benchmark is not used for the average calculation
Game Benchmarks The following benchmarks stem from our benchmarks of review laptops. The performance depends on the used graphics memory, clock rate, processor, system settings, drivers, and operating systems. So the results don't have to be representative for all laptops with this GPU. For detailed information on the benchmark results, click on the fps number.
100%
UHD Graphics 32EUs:
37 [X] Maxtang MTN-ALN50 Intel Core i3-N305 1.8GHz
UHD Graphics 32EUs
min:
8.84 fps, P0.1:
8.99 fps, P1:
22.3 fps, max:
263 fps
fps
100%
UHD Graphics 32EUs:
26.7 [X] Maxtang MTN-ALN50 Intel Core i3-N305 1.8GHz
UHD Graphics 32EUs
min:
7.15 fps, P0.1:
8.25 fps, P1:
14.6 fps, max:
101.8 fps
fps
100%
UHD Graphics 32EUs:
24 [X] Maxtang MTN-ALN50 Intel Core i3-N305 1.8GHz
UHD Graphics 32EUs
min:
6.98 fps, P0.1:
7 fps, P1:
14.5 fps, max:
84.7 fps
fps
100%
UHD Graphics 32EUs:
16.9 fps
100%
UHD Graphics 32EUs:
11.9 fps
100%
UHD Graphics 32EUs:
10.4 fps
100%
UHD Graphics 32EUs:
7.7 fps
100%
UHD Graphics 32EUs:
27.1 fps
100%
UHD Graphics 32EUs:
19.9 fps
100%
UHD Graphics 32EUs:
13 fps
100%
UHD Graphics 32EUs:
11.4 fps
100%
UHD Graphics 32EUs:
11.3 fps
100%
UHD Graphics 32EUs:
6.4 fps
100%
UHD Graphics 32EUs:
5.3 fps
100%
UHD Graphics 32EUs:
6.9 [X] Asus BR1402FG 2.01
Intel Core i3-N305 1.8GHz
UHD Graphics 32EUs
min:
2.25 fps, max:
16.4 fps
7.3 ~ 7 fps
100%
UHD Graphics 32EUs:
5.5 fps
100%
UHD Graphics 32EUs:
16.1 fps
100%
UHD Graphics 32EUs:
14.8 fps
100%
UHD Graphics 32EUs:
11.7 fps
100%
UHD Graphics 32EUs:
11.1 fps
100%
UHD Graphics 32EUs:
14.1 fps
100%
UHD Graphics 32EUs:
11.2 fps
100%
UHD Graphics 32EUs:
27.3 [X] Maxtang MTN-ALN50 800660
Intel Core i3-N305 1.8GHz
UHD Graphics 32EUs
min:
14.7 fps, max:
57.7 fps
fps
100%
UHD Graphics 32EUs:
21.1 [X] Maxtang MTN-ALN50 800660
Intel Core i3-N305 1.8GHz
UHD Graphics 32EUs
min:
14.5 fps, max:
37.1 fps
fps
100%
UHD Graphics 32EUs:
15.9 [X] Maxtang MTN-ALN50 800660
Intel Core i3-N305 1.8GHz
UHD Graphics 32EUs
min:
10.9 fps, max:
30.9 fps
fps
100%
UHD Graphics 32EUs:
46 [X] Maxtang MTN-ALN50 874931
Intel Core i3-N305 1.8GHz
UHD Graphics 32EUs
min:
35 fps, P1:
34 fps, max:
52 fps
fps
100%
UHD Graphics 32EUs:
18.3 [X] Maxtang MTN-ALN50 874931
Intel Core i3-N305 1.8GHz
UHD Graphics 32EUs
min:
14 fps, P1:
14 fps, max:
20 fps
fps
100%
UHD Graphics 32EUs:
16.5 [X] Maxtang MTN-ALN50 874931
Intel Core i3-N305 1.8GHz
UHD Graphics 32EUs
min:
13 fps, P1:
13 fps, max:
18 fps
fps
100%
UHD Graphics 32EUs:
10.5 [X] Maxtang MTN-ALN50 874931
Intel Core i3-N305 1.8GHz
UHD Graphics 32EUs
min:
7 fps, P1:
8 fps, max:
12 fps
fps
100%
UHD Graphics 32EUs:
35.4 fps
100%
UHD Graphics 32EUs:
18.8 fps
100%
UHD Graphics 32EUs:
14 fps
100%
UHD Graphics 32EUs:
8.7 fps
100%
UHD Graphics 32EUs:
21 fps
100%
UHD Graphics 32EUs:
11 fps
100%
UHD Graphics 32EUs:
10 fps
100%
UHD Graphics 32EUs:
9 fps
100%
UHD Graphics 32EUs:
16.5 fps
100%
UHD Graphics 32EUs:
9.2 fps
100%
UHD Graphics 32EUs:
8.6 fps
100%
UHD Graphics 32EUs:
32.5 [X] Zotac ZBOX PI430AJ 1.47.22.14 D3D12
Intel Core i3-N300 GHz
UHD Graphics 32EUs
min:
5 fps, P1:
9.8 fps, max:
142 fps
39.2 [X] Asus BR1402FG 1.47.22.14 D3D12
Intel Core i3-N305 1.8GHz
UHD Graphics 32EUs
min:
8.9 fps, P1:
12.8 fps, max:
240 fps
41.3 [X] Maxtang MTN-ALN50 1.47.22.14 D3D12
Intel Core i3-N305 1.8GHz
UHD Graphics 32EUs
min:
9.9 fps, P1:
13.1 fps, max:
216 fps
44.1 ~ 39 fps
100%
UHD Graphics 32EUs:
13.5 [X] Maxtang MTN-ALN50 1.47.22.14 D3D12
Intel Core i3-N305 1.8GHz
UHD Graphics 32EUs
min:
5 fps, P1:
5.14 fps, max:
149.3 fps
13.7 [X] Zotac ZBOX PI430AJ 1.47.22.14 D3D12
Intel Core i3-N300 GHz
UHD Graphics 32EUs
min:
5 fps, P1:
5.33 fps, max:
107.4 fps
15.2 [X] Asus BR1402FG 1.47.22.14 D3D12
Intel Core i3-N305 1.8GHz
UHD Graphics 32EUs
min:
5 fps, P1:
5.2 fps, max:
176.4 fps
17.2 ~ 15 fps
100%
UHD Graphics 32EUs:
11.5 [X] Zotac ZBOX PI430AJ 1.47.22.14 D3D12
Intel Core i3-N300 GHz
UHD Graphics 32EUs
min:
5 fps, P1:
5 fps, max:
125.8 fps
13.4 [X] Asus BR1402FG 1.47.22.14 D3D12
Intel Core i3-N305 1.8GHz
UHD Graphics 32EUs
min:
5 fps, P1:
5 fps, max:
198.8 fps
13.5 [X] Maxtang MTN-ALN50 1.47.22.14 D3D12
Intel Core i3-N305 1.8GHz
UHD Graphics 32EUs
min:
5 fps, P1:
5 fps, max:
181.9 fps
13.8 ~ 13 fps
100%
UHD Graphics 32EUs:
14.5 [X] Maxtang MTN-ALN50 1.47.22.14 D3D12
Intel Core i3-N305 1.8GHz
UHD Graphics 32EUs
min:
5 fps, P1:
5 fps, max:
232 fps
fps
100%
UHD Graphics 32EUs:
20 21 ~ 21 fps
100%
UHD Graphics 32EUs:
9 10 ~ 10 fps
100%
UHD Graphics 32EUs:
9 9 ~ 9 fps
100%
UHD Graphics 32EUs:
8 8 ~ 8 fps
HD Graphics (Bay Trail):
26.7 [X] Intel NUC Kit DN2820FYKH Intel Celeron N2820 2.2GHz
HD Graphics (Bay Trail)
min:
23 fps
fps
HD Graphics (Bay Trail):
23.4 [X] Intel NUC Kit DN2820FYKH Intel Celeron N2820 2.2GHz
HD Graphics (Bay Trail)
min:
21 fps
fps
HD Graphics (Bay Trail):
6 [X] Intel NUC Kit DN2820FYKH Intel Celeron N2820 2.2GHz
HD Graphics (Bay Trail)
fps
HD Graphics (Bay Trail):
12.6 [X] Intel NUC Kit DN2820FYKH Intel Celeron N2820 2.2GHz
HD Graphics (Bay Trail)
min:
7 fps, max:
15 fps
fps
HD Graphics (Broadwell):
15.3 fps
HD Graphics (Broadwell):
8.5 fps
HD Graphics (Bay Trail):
0 (!) [X] Intel NUC Kit DN2820FYKH Intel Celeron N2820 2.2GHz
HD Graphics (Bay Trail)
fps
HD Graphics (Broadwell):
38.1 fps
HD Graphics (Broadwell):
20.6 fps
HD Graphics (Broadwell):
29 fps
HD Graphics (Bay Trail):
12.1 [X] Intel NUC Kit DN2820FYKH Intel Celeron N2820 2.2GHz
HD Graphics (Bay Trail)
min:
5 fps, max:
18 fps
fps
HD Graphics (Broadwell):
20.8 fps
HD Graphics (Bay Trail):
10.8 [X] Intel NUC Kit DN2820FYKH Intel Celeron N2820 2.2GHz
HD Graphics (Bay Trail)
min:
10 fps, max:
12 fps
fps
40%
HD Graphics (Bay Trail):
24.7 [X] Intel NUC Kit DN2820FYKH Intel Celeron N2820 2.2GHz
HD Graphics (Bay Trail)
min:
22.2 fps
fps
22%
HD Graphics (Bay Trail):
9.7 [X] Intel NUC Kit DN2820FYKH Intel Celeron N2820 2.2GHz
HD Graphics (Bay Trail)
min:
8.8 fps
fps
20%
HD Graphics (Bay Trail):
5.5 [X] Intel NUC Kit DN2820FYKH Intel Celeron N2820 2.2GHz
HD Graphics (Bay Trail)
min:
-1.4 fps
fps
22%
HD Graphics (Bay Trail):
5.4 [X] Intel NUC Kit DN2820FYKH Intel Celeron N2820 2.2GHz
HD Graphics (Bay Trail)
min:
-3 fps
fps
100%
UHD Graphics 32EUs:
16 38.1 [X] Maxtang MTN-ALN50 Intel Core i3-N305 1.8GHz
UHD Graphics 32EUs
min:
11.2 fps, P0.1:
17.5 fps, P1:
20.5 fps, max:
132.2 fps
38.7 ~ 31 fps
100%
UHD Graphics 32EUs:
12 25.1 ~ 19 fps
100%
UHD Graphics 32EUs:
12.3 [X] Maxtang MTN-ALN50 Intel Core i3-N305 1.8GHz
UHD Graphics 32EUs
min:
4.16 fps, P0.1:
5.96 fps, P1:
6.76 fps, max:
52.8 fps
13 ~ 13 fps
100%
UHD Graphics 32EUs:
5.4 [X] Asus BR1402FG Intel Core i3-N305 1.8GHz
UHD Graphics 32EUs
min:
4 fps, P1:
5 fps, max:
6 fps
5.5 [X] Maxtang MTN-ALN50 Intel Core i3-N305 1.8GHz
UHD Graphics 32EUs
min:
3.3 fps, P0.1:
3.31 fps, P1:
3.4 fps, max:
13.5 fps
7 ~ 6 fps
HD Graphics (Broadwell):
50 fps
HD Graphics (Bay Trail):
22 [X] Intel NUC Kit DN2820FYKH Intel Celeron N2820 2.2GHz
HD Graphics (Bay Trail)
min:
16 fps, max:
33 fps
24.2 ~ 23 fps
HD Graphics (Broadwell):
13.5 fps
HD Graphics (Bay Trail):
0 (!) [X] Intel NUC Kit DN2820FYKH Intel Celeron N2820 2.2GHz
HD Graphics (Bay Trail)
12.5 ~ 6 fps
100%
UHD Graphics 32EUs:
35.7 [X] Zotac ZBOX PI430AJ Intel Core i3-N300 GHz
UHD Graphics 32EUs
min:
2.51 fps, P1:
15.9 fps, max:
59.5 fps
50.8 [X] Asus BR1402FG Intel Core i3-N305 1.8GHz
UHD Graphics 32EUs
min:
2.27 fps, P1:
23.8 fps, max:
88.3 fps
55.6 [X] Maxtang MTN-ALN50 Intel Core i3-N305 1.8GHz
UHD Graphics 32EUs
min:
14.1 fps, P1:
35.7 fps, max:
87.7 fps
61.9 ~ 51 fps
100%
UHD Graphics 32EUs:
9.4 fps
100%
UHD Graphics 32EUs:
4 fps
HD Graphics (Broadwell):
23.9 fps
HD Graphics (Bay Trail):
7.3 fps
HD Graphics (Broadwell):
16.4 fps
HD Graphics (Bay Trail):
5.1 fps
HD Graphics (Bay Trail):
3.2 fps
HD Graphics (Bay Trail):
1.7 fps
HD Graphics (Bay Trail):
8.1 fps
HD Graphics (Bay Trail):
4.7 fps
HD Graphics (Broadwell):
13.9 fps
HD Graphics (Bay Trail):
7 fps
HD Graphics (Broadwell):
9.4 fps
HD Graphics (Bay Trail):
4.6 fps
HD Graphics (Bay Trail):
5.6 fps
HD Graphics (Bay Trail):
3.8 fps
HD Graphics (Bay Trail):
4.3 fps
HD Graphics (Bay Trail):
2.4 fps
HD Graphics (Bay Trail):
9.6 11.5 ~ 11 fps
HD Graphics (Bay Trail):
4.3 fps
HD Graphics (Broadwell):
34 fps
HD Graphics (Bay Trail):
12 14 ~ 13 fps
HD Graphics (Broadwell):
24 fps
HD Graphics (Bay Trail):
12 fps
HD Graphics (Bay Trail):
5.2 fps
HD Graphics (Bay Trail):
3.6 fps
HD Graphics (Bay Trail):
3.7 fps
HD Graphics (Bay Trail):
2.5 fps
HD Graphics (Bay Trail):
9.1 fps
HD Graphics (Bay Trail):
5.1 fps
HD Graphics (Bay Trail):
8.5 fps
HD Graphics (Bay Trail):
6.1 fps
HD Graphics (Bay Trail):
12.4 fps
HD Graphics (Bay Trail):
8.5 fps
HD Graphics (Broadwell):
113.6 fps
HD Graphics (Bay Trail):
53.7 56 ~ 55 fps
HD Graphics (Broadwell):
26.3 fps
HD Graphics (Bay Trail):
6.6 7 ~ 7 fps
HD Graphics (Bay Trail):
8.4 fps
HD Graphics (Bay Trail):
5.9 fps
HD Graphics (Broadwell):
57.6 fps
HD Graphics (Bay Trail):
31.6 41.8 ~ 37 fps
HD Graphics (Broadwell):
22.6 fps
HD Graphics (Bay Trail):
12.5 12.5 ~ 13 fps
HD Graphics (Bay Trail):
8.3 fps
HD Graphics (Bay Trail):
4.6 fps
HD Graphics (Bay Trail):
11.1 fps
HD Graphics (Bay Trail):
9.6 fps
HD Graphics (Bay Trail):
25.2 fps
HD Graphics (Bay Trail):
9.2 fps
HD Graphics (Bay Trail):
3.1 [X] Medion Akoya S6213T MD98716 Intel Pentium N3530 2.2GHz
HD Graphics (Bay Trail)
5.1 ~ 4 fps
HD Graphics (Bay Trail):
3.3 fps
HD Graphics (Bay Trail):
8.7 fps
HD Graphics (Bay Trail):
5.8 fps
HD Graphics (Bay Trail):
12.8 fps
HD Graphics (Bay Trail):
6 fps
HD Graphics (Bay Trail):
7.3 fps
HD Graphics (Bay Trail):
14 fps
HD Graphics (Bay Trail):
8 fps
HD Graphics (Bay Trail):
12 fps
HD Graphics (Bay Trail):
12.6 18.7 19.9 29.8 33.6 60 [X] Medion Akoya P2211T MD98602 Intel Celeron N2910 1.6GHz
HD Graphics (Bay Trail)
~ 29 fps
HD Graphics (Bay Trail):
10.5 19.5 33 [X] Medion Akoya P2211T MD98602 Intel Celeron N2910 1.6GHz
HD Graphics (Bay Trail)
~ 21 fps
HD Graphics (Bay Trail):
7.8 12.8 22 [X] Medion Akoya P2211T MD98602 Intel Celeron N2910 1.6GHz
HD Graphics (Bay Trail)
~ 14 fps
HD Graphics (Bay Trail):
7.7 fps
HD Graphics (Bay Trail):
6.3 fps
HD Graphics (Bay Trail):
10.2 fps
HD Graphics (Bay Trail):
6.1 fps
HD Graphics (Bay Trail):
11 fps
HD Graphics (Bay Trail):
7.8 fps
HD Graphics (Bay Trail):
18.2 [X] Medion Akoya P2211T MD98602 Intel Celeron N2910 1.6GHz
HD Graphics (Bay Trail)
20.8 28.4 31.9 [X] Asus Transformer Book T200TA PL Intel Atom Z3775 1.5GHz
HD Graphics (Bay Trail)
~ 25 fps
HD Graphics (Bay Trail):
9.5 [X] Medion Akoya P2211T MD98602 Intel Celeron N2910 1.6GHz
HD Graphics (Bay Trail)
10.4 13.7 19.4 [X] Asus Transformer Book T200TA PL Intel Atom Z3775 1.5GHz
HD Graphics (Bay Trail)
~ 13 fps
HD Graphics (Bay Trail):
4.4 [X] Medion Akoya E6239T Intel Pentium N3510 2GHz
HD Graphics (Bay Trail)
fps
HD Graphics (Bay Trail):
14.1 16.2 17.9 20.4 [X] Medion Akoya E6239T Intel Pentium N3510 2GHz
HD Graphics (Bay Trail)
23.2 ~ 18 fps
HD Graphics (Bay Trail):
12.5 12.6 [X] Medion Akoya E6239T Intel Pentium N3510 2GHz
HD Graphics (Bay Trail)
~ 13 fps
HD Graphics (Broadwell):
13.7 fps
HD Graphics (Bay Trail):
5 fps
HD Graphics (Broadwell):
10.7 fps
HD Graphics (Broadwell):
7 fps
HD Graphics (Broadwell):
25.3 fps
HD Graphics (Broadwell):
14.1 fps
HD Graphics (Broadwell):
11.7 fps
HD Graphics (Bay Trail):
1.2 fps
HD Graphics (Bay Trail):
39 56.2 69 [X] Baytrail Reference Tablet Intel Atom Z3770 1.5GHz
HD Graphics (Bay Trail)
~ 55 fps
HD Graphics (Bay Trail):
12.3 12.8 14 [X] Baytrail Reference Tablet Intel Atom Z3770 1.5GHz
HD Graphics (Bay Trail)
min:
8 fps
~ 13 fps
HD Graphics (Broadwell):
34.7 fps
HD Graphics (Broadwell):
17.7 fps
HD Graphics (Broadwell):
11.7 fps
HD Graphics (Bay Trail):
0.3 fps
HD Graphics (Bay Trail):
15.1 23.6 ~ 19 fps
HD Graphics (Bay Trail):
5.2 9.7 ~ 7 fps
HD Graphics (Bay Trail):
10.3 fps
HD Graphics (Bay Trail):
6.2 fps
HD Graphics (Broadwell):
15.6 fps
HD Graphics (Bay Trail):
10.1 fps
HD Graphics (Broadwell):
11.4 fps
HD Graphics (Bay Trail):
6 fps
HD Graphics (Broadwell):
5.3 fps
HD Graphics (Bay Trail):
12.4 fps
HD Graphics (Bay Trail):
7.3 fps
HD Graphics (Bay Trail):
12.5 14.3 ~ 13 fps
HD Graphics (Bay Trail):
9.8 11.2 ~ 11 fps
HD Graphics (Bay Trail):
42 fps
HD Graphics (Broadwell):
43.7 fps
HD Graphics (Bay Trail):
26.1 [X] Intel NUC Kit DN2820FYKH Intel Celeron N2820 2.2GHz
HD Graphics (Bay Trail)
min:
16 fps, max:
38 fps
46.6 ~ 36 fps
HD Graphics (Broadwell):
31.5 fps
HD Graphics (Bay Trail):
20 [X] Intel NUC Kit DN2820FYKH Intel Celeron N2820 2.2GHz
HD Graphics (Bay Trail)
min:
13 fps, max:
29 fps
23.9 ~ 22 fps
HD Graphics (Broadwell):
23.9 fps
HD Graphics (Bay Trail):
12.9 13.2 ~ 13 fps
HD Graphics (Bay Trail):
7.5 8.1 ~ 8 fps
HD Graphics (Bay Trail):
28 fps
HD Graphics (Broadwell):
38.4 fps
HD Graphics (Bay Trail):
9.2 10.7 14.8 15.6 16.5 [X] Medion Akoya P2214T MD 99430 Intel Celeron N2940 1.8GHz
HD Graphics (Bay Trail)
18.4 19.3 [X] Intel NUC Kit DN2820FYKH Intel Celeron N2820 2.2GHz
HD Graphics (Bay Trail)
min:
14 fps, max:
23 fps
~ 15 fps
HD Graphics (Broadwell):
24.9 fps
HD Graphics (Bay Trail):
6 9.5 [X] Medion Akoya P2214T MD 99430 Intel Celeron N2940 1.8GHz
HD Graphics (Bay Trail)
10.3 11.4 12 ~ 10 fps
HD Graphics (Broadwell):
19.7 fps
HD Graphics (Bay Trail):
7.9 [X] Medion Akoya P2214T MD 99430 Intel Celeron N2940 1.8GHz
HD Graphics (Bay Trail)
9.6 ~ 9 fps
HD Graphics (Bay Trail):
5 [X] Medion Akoya P2214T MD 99430 Intel Celeron N2940 1.8GHz
HD Graphics (Bay Trail)
5.9 ~ 5 fps
HD Graphics (Bay Trail):
8.5 12.4 ~ 10 fps
HD Graphics (Bay Trail):
8.1 fps
HD Graphics (Bay Trail):
5.8 fps
HD Graphics (Bay Trail):
2.3 fps
HD Graphics (Bay Trail):
1.1 fps
HD Graphics (Bay Trail):
11 11.8 ~ 11 fps
HD Graphics (Bay Trail):
10 fps
HD Graphics (Bay Trail):
8 fps
HD Graphics (Bay Trail):
4.8 fps
HD Graphics (Bay Trail):
19.7 fps
HD Graphics (Bay Trail):
24.1 36.9 ~ 31 fps
HD Graphics (Bay Trail):
12.9 13.3 ~ 13 fps
HD Graphics (Bay Trail):
9.3 fps
HD Graphics (Bay Trail):
5 10.5 [X] Asus Transformer Book T200TA PL Intel Atom Z3775 1.5GHz
HD Graphics (Bay Trail)
~ 8 fps
HD Graphics (Bay Trail):
5.6 [X] Asus Transformer Book T200TA PL Intel Atom Z3775 1.5GHz
HD Graphics (Bay Trail)
fps
HD Graphics (Bay Trail):
3.7 [X] Asus Transformer Book T200TA PL Intel Atom Z3775 1.5GHz
HD Graphics (Bay Trail)
fps
HD Graphics (Bay Trail):
6 9 9 ~ 8 fps
HD Graphics (Bay Trail):
3 fps
HD Graphics (Bay Trail):
12 [X] Asus Transformer Book T200TA PL Intel Atom Z3775 1.5GHz
HD Graphics (Bay Trail)
fps
HD Graphics (Bay Trail):
9 [X] Asus Transformer Book T200TA PL Intel Atom Z3775 1.5GHz
HD Graphics (Bay Trail)
fps
HD Graphics (Bay Trail):
12.8 fps
HD Graphics (Bay Trail):
9 fps
HD Graphics (Bay Trail):
10.3 14 [X] Medion Akoya E1232T-MD99410 Intel Celeron N2807 1.6GHz
HD Graphics (Bay Trail)
17.7 18 18.1 18.1 18.7 18.8 [X] Captiva PAD 10.1 Windows Intel Atom Z3735D 1.3GHz
HD Graphics (Bay Trail)
19.3 19.4 19.4 19.8 19.8 20.5 20.5 [X] cmx WinTek 101-1016 Intel Atom Z3735F 1.3GHz
HD Graphics (Bay Trail)
20.6 21 [X] ODYS Winpad V10 Intel Atom Z3735F 1.3GHz
HD Graphics (Bay Trail)
21.5 23.6 ~ 19 fps
HD Graphics (Bay Trail):
6.4 [X] Captiva PAD 10.1 Windows Intel Atom Z3735D 1.3GHz
HD Graphics (Bay Trail)
7.7 ~ 7 fps
HD Graphics (Bay Trail):
18.9 19 ~ 19 fps
HD Graphics (Bay Trail):
7.6 8.7 ~ 8 fps
HD Graphics (Bay Trail):
33 33 35 38 [X] MSI S100 Intel Atom Z3740D 1.3GHz
HD Graphics (Bay Trail)
44 46.2 47 48 49 49 [X] Intel NUC Kit DN2820FYKH Intel Celeron N2820 2.2GHz
HD Graphics (Bay Trail)
min:
39 fps, max:
59 fps
50 [X] Baytrail Reference Tablet Intel Atom Z3770 1.5GHz
HD Graphics (Bay Trail)
min:
36 fps
52 ~ 44 fps
HD Graphics (Bay Trail):
9.6 [X] Intel NUC Kit DN2820FYKH Intel Celeron N2820 2.2GHz
HD Graphics (Bay Trail)
min:
3 fps, max:
13 fps
11.5 [X] Baytrail Reference Tablet Intel Atom Z3770 1.5GHz
HD Graphics (Bay Trail)
min:
8 fps
20 22 23 25.3 26 26 28 [X] MSI S100 Intel Atom Z3740D 1.3GHz
HD Graphics (Bay Trail)
34 ~ 23 fps
HD Graphics (Bay Trail):
12 12 13.5 ~ 13 fps
HD Graphics (Bay Trail):
5.6 7 ~ 6 fps
HD Graphics (Bay Trail):
190 [X] Baytrail Reference Tablet Intel Atom Z3770 1.5GHz
HD Graphics (Bay Trail)
fps
Average Gaming Intel UHD Graphics 32EUs (Alder Lake) → 100% Average Gaming 30-70 fps → 100%
Average Gaming Intel HD Graphics (Bay Trail) → 26%  Deutsch
 English
 Español
 Français
 Italiano
 Nederlands
 Polski
 Português
 Русский
 Türkçe
 Svenska
 Chinese
 Magyar