Intel UHD Graphics 32EUs (Alder Lake) vs Intel HD Graphics 4200 vs Intel HD Graphics (Cherry Trail)
Intel UHD Graphics 32EUs (Alder Lake) ► remove from comparison
Die Intel Xe Graphics 32 EUS (Alder Lake) ist eine Prozessorgrafikkarte, die Anfang 2023 vorgestellt wurde. Sie basiert auf die Xe Architektur (Gen12) und bietet in Alder Lake CPUs nur 32 der 96 verbauten Execution Units (EUs). Die GPU wird im verbesserten 10nm Verfahren (Intel 7) bei Intel gefertigt. Die Rohleistung ist vergleichbar mit der Radeon RX Vega 6 (in Ryzen 5000 CPUs), jedoch ist die Spieleleistung geringer durch den schwächeren Treibersupport (in 2022). Nur anspruchslose Spiele wie Dota 2 Reborn sind mit geringsten Settings flüssig spielbar (siehe unten).
Intel HD Graphics 4200 ► remove from comparison
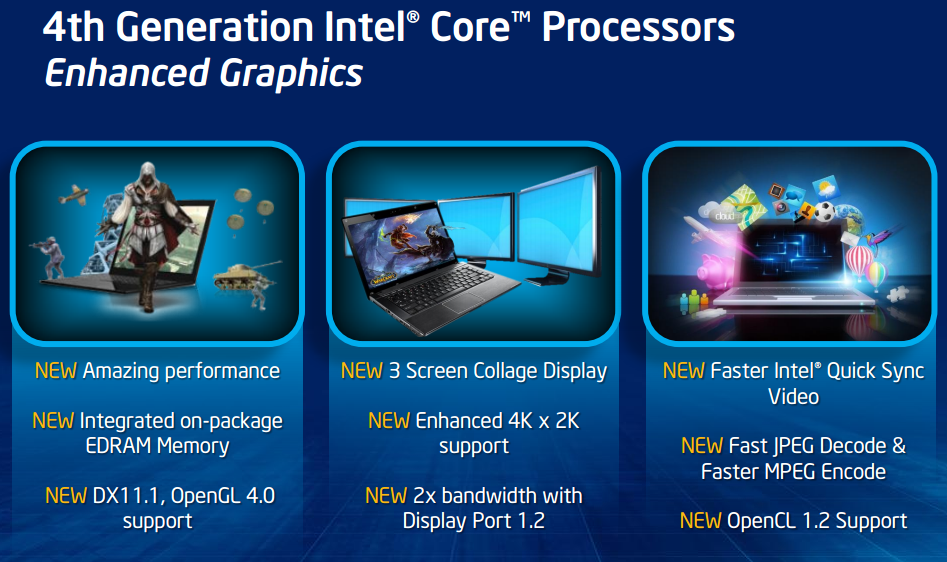
The Intel HD Graphics 4200 (GT2) is a processor graphics card that is included in some of the ULV Haswell processors of 2013 (4th generation core). The relatively low base clock can be automatically overclocked using Turbo Boost technology.
In comparison to the HD 4000, the graphics core has been modified in several details. The GPU supports DirectX 11.1, OpenCL 1.2 und OpenGL 4.0. It also features an improved decoder for 4K videos and the fast Quick Sync encoder.
The performance of the HD Graphics 4200 is clearly below the HD 4600 and HD 4400 , since the GPU is designed for ULV models of the Y-series (11.5 W). Therefore, the clock rates are relatively low. Compared to a similar clocked HD 4000 , the HD 4200 is somewhat faster due to architectural improvements and an increased number of execution units: The GT2 version integrates 20 EUs, compared to 16 EUs for the old HD 4000.
In simple games like Anno 2070 or Counter Strike: Global Offensive, the performance is sufficient to handle low settings and 1024 x 768 pixels. Many current titles like Battlefield 4, however, are not playable even at minimum graphic quality. Detailed benchmarks can be found below.
Due to the 22nm 3D Tri-Gate production process, the power consumption is relatively low and suitable even for tablets. In addition to the TDP of 11.5 watts, the Y-series CPUs are rated at an SDP (average power consumption) of 4.5 or 6 watts (depending on the model).
Intel HD Graphics (Cherry Trail) ► remove from comparison
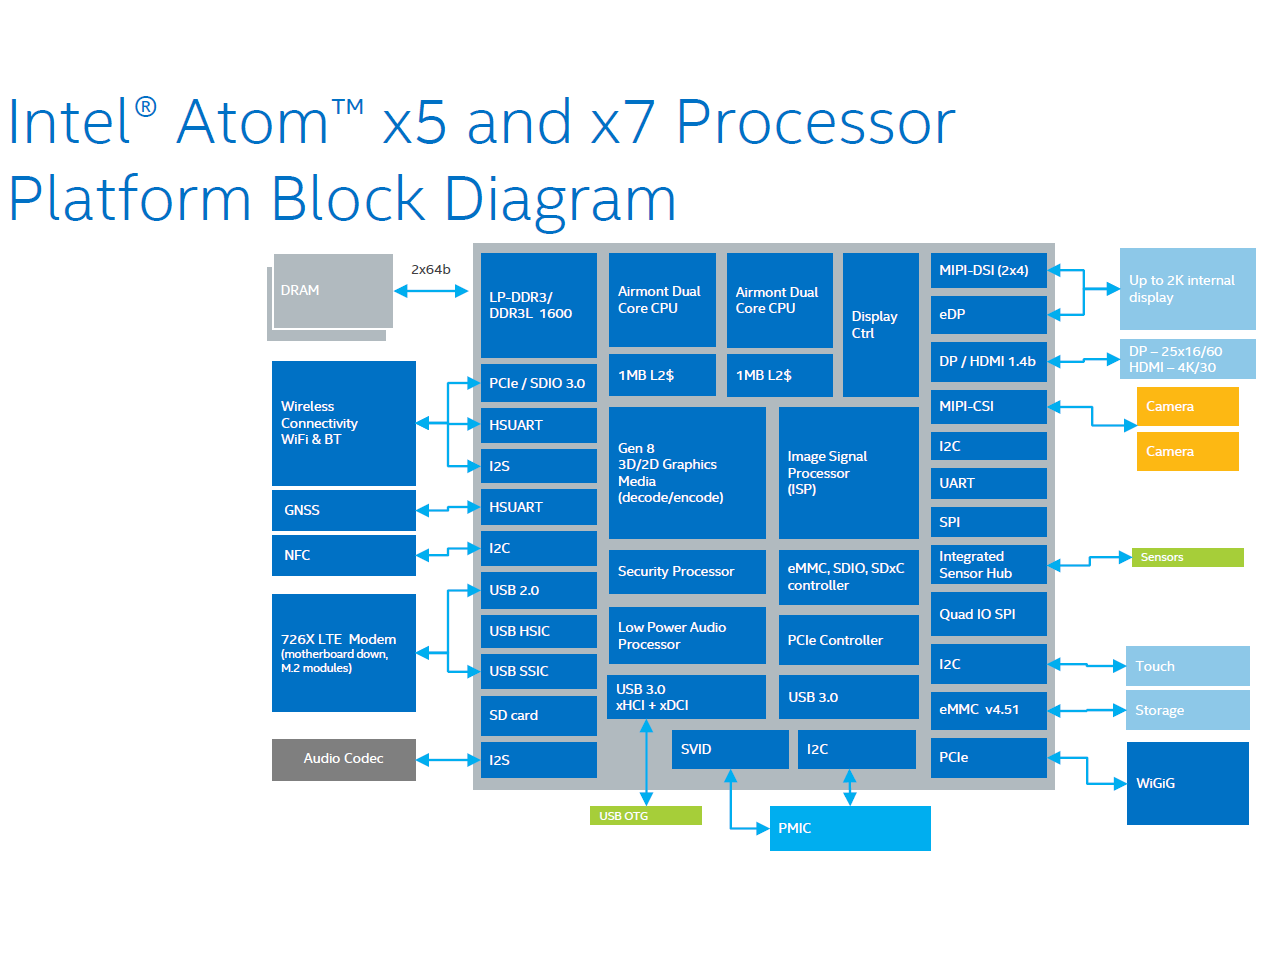
The Intel HD Graphics (Cherry Trail) is an integrated graphics card in the Cherry-Trail SoCs (e.g. Atom x7-Z8700). Based on a Broadwell GPU (Intel Gen8) and supports DirectX 11.2. Depending on the SoC offers 12 or 16 EUs.
Atom x7-Z8700: 16 EUs @ 200 - 600 MHz, dual-channel memory
In Windows, gaming is limited to less demanding or quite old games. Using Android, even high end 3D games should run fluently. For example Team Fortress 2 was running on the Surface 3 (x7-Z8700) only in lowest settings and 1280x720 fluently (11 - 69 fps range).
The integrated video decoder is able to display even 4K videos (H.264 tested) fluently.
The Intel HD Graphics GPU in our review sample of the MS Surface 3 (Atom x7-Z8700) only supported DisplayPort 1.1 as it seems, as 4K (3840x2160) with 30 Hz was the maximum Refresh Rate we could achieve (no 60 Hz selectable with the pre-installed drivers).
Intel UHD Graphics 32EUs (Alder Lake) Intel HD Graphics 4200 Intel HD Graphics (Cherry Trail) HD Graphics Series Codename Alder Lake Xe Haswell GT2 Cherry Trail Pipelines 32 - unified 20 - unified 16 - unified Core Speed 1250 MHz 200 - 850 (Boost) MHz 200 - 600 (Boost) MHz Shared Memory yes yes yes API DirectX 12_1, OpenGL 4.6 DirectX 11.1, Shader 5.0, OpenGL 4.0 DirectX 12 (FL 11_1), Shader 5.0, OpenGL 4.3 Architecture Gen. 7.5 Haswell Gen. 8 Memory Bus Width 64/128 Bit 64/128 Bit technology 22 nm 14 nm Features QuickSync Date of Announcement 05.06.2013 02.03.2015
CPU in UHD Graphics 32EUs GPU Base Speed GPU Boost / Turbo Intel Core i3-N305 8 x 1800 MHz, 15 W 1000 MHz 1250 MHz
CPU in HD Graphics 4200 GPU Base Speed GPU Boost / Turbo Intel Core i7-4610Y 2 x 1700 MHz, 11.5 W 200 MHz 850 MHz Intel Core i5-4300Y 2 x 1600 MHz, 11.5 W 200 MHz 850 MHz Intel Core i5-4302Y 2 x 1600 MHz, 11.5 W 200 MHz 850 MHz » show 8 more Intel Core i5-4202Y 2 x 1600 MHz, 11.5 W 200 MHz 850 MHz Intel Core i5-4220Y 2 x 1600 MHz, 11.5 W 200 MHz 850 MHz Intel Core i5-4210Y 2 x 1500 MHz, 11.5 W 200 MHz 850 MHz Intel Core i5-4200Y 2 x 1400 MHz, 11.5 W 200 MHz 850 MHz Intel Core i3-4030Y 2 x 1600 MHz, 11.5 W 200 MHz 850 MHz Intel Core i3-4020Y 2 x 1500 MHz, 11.5 W 200 MHz 850 MHz Intel Core i3-4012Y 2 x 1500 MHz, 11.5 W 200 MHz 850 MHz Intel Core i3-4010Y 2 x 1300 MHz, 11.5 W 200 MHz 850 MHz min. - max. 200 - 1000 MHz 850 - 1250 MHz
CPU in HD Graphics (Cherry Trail) GPU Base Speed GPU Boost / Turbo Intel Atom x7-Z8700 4 x 1600 MHz 200 MHz 600 MHz Intel Atom x5-Z8500 4 x 1440 MHz 200 MHz 600 MHz Intel Atom x5-Z8350 4 x 1440 MHz 200 MHz 500 MHz » show 2 more Intel Atom x5-Z8300 4 x 1440 MHz 200 MHz 500 MHz Intel Atom x5-E8000 4 x 1040 MHz, 5 W 320 MHz ? MHz min. - max. 200 - 1000 MHz ? - 1250 MHz
Benchmarks Performance Rating - 3DMark 11 + Fire Strike + Time Spy - UHD Graphics 32EUs
0.9 pt (3%)
...
Intel UHD Graphics 32EUs (Alder Lake)
NVIDIA GeForce GTX 460 768MB
...
Performance Rating - 3DMark 11 + Fire Strike + Time Spy - HD Graphics 4200
0.2 pt (1%)
...
...
Performance Rating - 3DMark 11 + Fire Strike + Time Spy - HD Graphics (Cherry Trail)
0.1 pt (0%)
Intel HD Graphics (Cherry Trail)
...
3DMark - 3DMark Time Spy Score
min: 599 avg: 626 median: 613 (2%) max: 666 Points
3DMark - 3DMark Time Spy Graphics
min: 523 avg: 547 median: 536 (1%) max: 583 Points
3DMark - 3DMark Ice Storm Unlimited Graphics
min: 64090 avg: 76155 median: 76154.5 (9%) max: 88219 Points
41579 Points (5%)
min: 18563 avg: 20873 median: 19303 (2%) max: 27537 Points
3DMark - 3DMark Ice Storm Extreme Graphics
min: 38285 avg: 38839 median: 38839 (5%) max: 39393 Points
3DMark - 3DMark Cloud Gate Score
min: 7939 avg: 10785 median: 11402.5 (12%) max: 12397 Points
min: 1716 avg: 2853 median: 3027 (3%) max: 3754 Points
min: 769 avg: 1454 median: 1488 (2%) max: 1905 Points
3DMark - 3DMark Cloud Gate Graphics
min: 10945 avg: 12633 median: 12687 (3%) max: 14214 Points
min: 2101 avg: 3793 median: 3807 (1%) max: 5239 Points
min: 1537 avg: 1851 median: 1783.5 (0%) max: 2272 Points
3DMark - 3DMark Fire Strike Standard Score
min: 1574 avg: 1726 median: 1733 (3%) max: 1862 Points
min: 199 avg: 369.6 median: 394.5 (1%) max: 512 Points
min: 174 avg: 390.4 median: 248 (0%) max: 1059 Points
3DMark - 3DMark Fire Strike Standard Graphics
min: 1736 avg: 1880 median: 1894.5 (2%) max: 1995 Points
min: 218 avg: 410.6 median: 431.5 (0%) max: 578 Points
min: 193 avg: 233 median: 225 (0%) max: 281 Points
3DMark - 3DMark Ice Storm Graphics
min: 53717 avg: 54586 median: 54586 (7%) max: 55455 Points
min: 17834 avg: 32317 median: 34087 (4%) max: 46175 Points
min: 7544 avg: 16078 median: 17063.5 (2%) max: 23395 Points
3DMark - 3DMark Sling Shot (ES 3.0) Unlimited
min: 1445 avg: 1525 median: 1525 (7%) max: 1605 Points
3DMark - 3DMark Sling Shot (ES 3.0) Unlimited Graphics
min: 1598 avg: 1684 median: 1684 (4%) max: 1770 Points
3DMark - 3DMark Sling Shot Extreme (ES 3.1) Unlimited
min: 1072 avg: 1215 median: 1159 (6%) max: 1414 Points
3DMark - 3DMark Sling Shot Extreme (ES 3.1) Unlimited Graphics
min: 1058 avg: 1251 median: 1142 (3%) max: 1554 Points
3DMark 11 - 3DM11 Performance Score
min: 2390 avg: 2817 median: 2920 (4%) max: 3037 Points
min: 367 avg: 660 median: 712 (1%) max: 828 Points
min: 314 avg: 359.4 median: 343 (0%) max: 562 Points
3DMark 11 - 3DM11 Performance GPU
min: 2194 avg: 2527 median: 2612 (2%) max: 2688 Points
min: 329 avg: 624 median: 638 (1%) max: 1060 Points
min: 278 avg: 319.9 median: 298 (0%) max: 494 Points
3DMark Vantage + Intel UHD Graphics 32EUs (Alder Lake) 3DMark Vantage - 3DM Vant. Perf. total
min: 7913 avg: 9108 median: 9462 (3%) max: 9948 Points
3DM Vant. Perf. total + Intel HD Graphics 4200
min: 2165 avg: 2538 median: 2537.5 (1%) max: 2910 Points
3DM Vant. Perf. GPU no PhysX + Intel UHD Graphics 32EUs (Alder Lake) 3DMark Vantage - 3DM Vant. Perf. GPU no PhysX
min: 6818 avg: 7570 median: 7729 (4%) max: 8163 Points
3DM Vant. Perf. GPU no PhysX + Intel HD Graphics 4200
min: 1678 avg: 1985 median: 1807 (1%) max: 2471 Points
3DMark 06 3DMark 06 - Standard 1280x1024 + Intel UHD Graphics 32EUs (Alder Lake)
min: 9971 avg: 12006 median: 12006 (16%) max: 14041 Points
3DMark 06 - Standard 1280x1024 + Intel HD Graphics 4200
min: 2060 avg: 3529 median: 3383 (4%) max: 5020 Points
3DMark 06 - Standard 1280x1024 + Intel HD Graphics (Cherry Trail)
min: 2403 avg: 2833 median: 2595 (3%) max: 3330 Points
3DMark 06 - Standard 1024x768 + Intel HD Graphics (Cherry Trail)
2877 Points (4%)
Unigine Valley 1.0 - Unigine Valley 1.0 DX
min: 5.7 avg: 5.9 median: 5.9 (2%) max: 6.1 fps
1.2 fps (0%)
Unigine Heaven 2.1 - Heaven 2.1 high
5.7 fps (1%)
Cinebench R10 Cinebench R10 Shading (32bit) + Intel UHD Graphics 32EUs (Alder Lake) Cinebench R10 - Cinebench R10 Shading (32bit)
min: 5716 avg: 7533 median: 6964 (5%) max: 9920 Points
Cinebench R10 Shading (32bit) + Intel HD Graphics 4200
min: 1991 avg: 4602 median: 4514 (3%) max: 6367 Points
Cinebench R10 Shading (32bit) + Intel HD Graphics (Cherry Trail)
min: 1192 avg: 2009 median: 1973 (1%) max: 2551 Points
Cinebench R11.5 Cinebench R11.5 OpenGL 64 Bit + Intel UHD Graphics 32EUs (Alder Lake) Cinebench R11.5 - Cinebench R11.5 OpenGL 64 Bit
min: 28.92 avg: 40.1 median: 45.3 (16%) max: 46 fps
Cinebench R11.5 OpenGL 64 Bit + Intel HD Graphics 4200
min: 7.65 avg: 14.1 median: 14.9 (5%) max: 19.67 fps
Cinebench R11.5 OpenGL 64 Bit + Intel HD Graphics (Cherry Trail)
min: 4.01 avg: 8.8 median: 8.4 (3%) max: 11.71 fps
Cinebench R15 + Intel UHD Graphics 32EUs (Alder Lake) Cinebench R15 - Cinebench R15 OpenGL 64 Bit
min: 40.69 avg: 54.2 median: 58.6 (3%) max: 58.91 fps
Cinebench R15 OpenGL 64 Bit + Intel HD Graphics 4200
min: 8.82 avg: 15.6 median: 17 (1%) max: 19.99 fps
Cinebench R15 OpenGL 64 Bit + Intel HD Graphics (Cherry Trail)
min: 6.64 avg: 10.3 median: 9.7 (1%) max: 15.52 fps
Cinebench R15 OpenGL Ref. Match 64 Bit + Intel UHD Graphics 32EUs (Alder Lake) Cinebench R15 - Cinebench R15 OpenGL Ref. Match 64 Bit
97.8 % (98%)
Cinebench R15 OpenGL Ref. Match 64 Bit + Intel HD Graphics 4200
min: 63.3 avg: 87.8 median: 98 (98%) max: 99.6 %
Cinebench R15 OpenGL Ref. Match 64 Bit + Intel HD Graphics (Cherry Trail)
min: 98 avg: 98 median: 98 (98%) max: 98.6 %
GFXBench - GFXBench Car Chase Offscreen
min: 6.3 avg: 7.3 median: 7 (1%) max: 9 fps
GFXBench 3.1 - GFXBench Manhattan ES 3.1 Offscreen
min: 9.2 avg: 10.8 median: 11 (0%) max: 13 fps
GFXBench 3.0 - GFXBench 3.0 Manhattan Offscreen
min: 8.4 avg: 13.8 median: 13.5 (1%) max: 18 fps
GFXBench (DX / GLBenchmark) 2.7 + Intel HD Graphics 4200 GFXBench (DX / GLBenchmark) 2.7 - GFXBench T-Rex HD Offscreen C24Z16
min: 21 avg: 35.8 median: 37.5 (0%) max: 47 fps
GFXBench T-Rex HD Offscreen C24Z16 + Intel HD Graphics (Cherry Trail) min: 22 avg: 30.5 median: 32 (0%) max: 38.5 fps
Basemark GPU 1.2 - Basemark GPU 1.2 Vulkan Official Medium Offscreen 1080
min: 72.1 avg: 88.4 median: 88.4 (1%) max: 104.6 fps
Basemark GPU 1.2 - Basemark GPU 1.2 Vulkan Official High Offscreen 2160
5.6 fps (1%)
Geekbench 6.2 - Geekbench 6.2 GPU OpenCL
min: 5031 avg: 5954 median: 6203.5 (2%) max: 6378 Points
Geekbench 6.2 - Geekbench 6.2 GPU Vulkan
min: 6193 avg: 6857 median: 6978 (2%) max: 7279 Points
LuxMark v2.0 64Bit - LuxMark v2.0 Room GPU
min: 232 avg: 275 median: 275 (1%) max: 318 Samples/s
min: 102 avg: 113.5 median: 113.5 (1%) max: 125 Samples/s
min: 48 avg: 58.7 median: 59 (0%) max: 69 Samples/s
LuxMark v2.0 64Bit - LuxMark v2.0 Sala GPU
min: 728 avg: 748 median: 748 (1%) max: 768 Samples/s
min: 162 avg: 176.5 median: 176.5 (0%) max: 191 Samples/s
min: 69 avg: 87.7 median: 89 (0%) max: 105 Samples/s
ComputeMark v2.1 - ComputeMark v2.1 Result
min: 1042 avg: 1099 median: 1098.5 (1%) max: 1155 Points
min: 469 avg: 486 median: 486 (1%) max: 503 Points
277 Points (0%)
Power Consumption - Furmark Stress Test Power Consumption - external Monitor *
min: 17.8 avg: 21.7 median: 21.5 (3%) max: 26.1 Watt
Power Consumption - The Witcher 3 Power Consumption - external Monitor *
min: 21.5 avg: 23.1 median: 23.1 (3%) max: 24.7 Watt
Power Consumption - Witcher 3 Power Consumption *
min: 26.6 avg: 27.4 median: 27.4 (6%) max: 28.2 Watt
Power Consumption - Witcher 3 ultra Power Efficiency
0.3 fps per Watt (24%)
Average Benchmarks Intel UHD Graphics 32EUs (Alder Lake) → 100% n=16 Average Benchmarks Intel HD Graphics 4200 → 40% n=16 Average Benchmarks Intel HD Graphics (Cherry Trail) → 24% n=16
- Range of benchmark values for this graphics card
- Average benchmark values for this graphics card
* Smaller numbers mean a higher performance
1 This benchmark is not used for the average calculation
Game Benchmarks The following benchmarks stem from our benchmarks of review laptops. The performance depends on the used graphics memory, clock rate, processor, system settings, drivers, and operating systems. So the results don't have to be representative for all laptops with this GPU. For detailed information on the benchmark results, click on the fps number.
100%
UHD Graphics 32EUs:
37 [X] Maxtang MTN-ALN50 Intel Core i3-N305 1.8GHz
UHD Graphics 32EUs
min:
8.84 fps, P0.1:
8.99 fps, P1:
22.3 fps, max:
263 fps
fps
100%
UHD Graphics 32EUs:
26.7 [X] Maxtang MTN-ALN50 Intel Core i3-N305 1.8GHz
UHD Graphics 32EUs
min:
7.15 fps, P0.1:
8.25 fps, P1:
14.6 fps, max:
101.8 fps
fps
100%
UHD Graphics 32EUs:
24 [X] Maxtang MTN-ALN50 Intel Core i3-N305 1.8GHz
UHD Graphics 32EUs
min:
6.98 fps, P0.1:
7 fps, P1:
14.5 fps, max:
84.7 fps
fps
100%
UHD Graphics 32EUs:
16.9 fps
100%
UHD Graphics 32EUs:
11.9 fps
100%
UHD Graphics 32EUs:
10.4 fps
100%
UHD Graphics 32EUs:
7.7 fps
100%
UHD Graphics 32EUs:
27.1 fps
100%
UHD Graphics 32EUs:
19.9 fps
100%
UHD Graphics 32EUs:
13 fps
100%
UHD Graphics 32EUs:
11.4 fps
100%
UHD Graphics 32EUs:
11.3 fps
100%
UHD Graphics 32EUs:
6.4 fps
100%
UHD Graphics 32EUs:
5.3 fps
100%
UHD Graphics 32EUs:
6.9 [X] Asus BR1402FG 2.01
Intel Core i3-N305 1.8GHz
UHD Graphics 32EUs
min:
2.25 fps, max:
16.4 fps
7.3 ~ 7 fps
100%
UHD Graphics 32EUs:
5.5 fps
100%
UHD Graphics 32EUs:
16.1 fps
100%
UHD Graphics 32EUs:
14.8 fps
100%
UHD Graphics 32EUs:
11.7 fps
100%
UHD Graphics 32EUs:
11.1 fps
100%
UHD Graphics 32EUs:
14.1 fps
100%
UHD Graphics 32EUs:
11.2 fps
100%
UHD Graphics 32EUs:
27.3 [X] Maxtang MTN-ALN50 800660
Intel Core i3-N305 1.8GHz
UHD Graphics 32EUs
min:
14.7 fps, max:
57.7 fps
fps
100%
UHD Graphics 32EUs:
21.1 [X] Maxtang MTN-ALN50 800660
Intel Core i3-N305 1.8GHz
UHD Graphics 32EUs
min:
14.5 fps, max:
37.1 fps
fps
100%
UHD Graphics 32EUs:
15.9 [X] Maxtang MTN-ALN50 800660
Intel Core i3-N305 1.8GHz
UHD Graphics 32EUs
min:
10.9 fps, max:
30.9 fps
fps
100%
UHD Graphics 32EUs:
46 [X] Maxtang MTN-ALN50 874931
Intel Core i3-N305 1.8GHz
UHD Graphics 32EUs
min:
35 fps, P1:
34 fps, max:
52 fps
fps
100%
UHD Graphics 32EUs:
18.3 [X] Maxtang MTN-ALN50 874931
Intel Core i3-N305 1.8GHz
UHD Graphics 32EUs
min:
14 fps, P1:
14 fps, max:
20 fps
fps
100%
UHD Graphics 32EUs:
16.5 [X] Maxtang MTN-ALN50 874931
Intel Core i3-N305 1.8GHz
UHD Graphics 32EUs
min:
13 fps, P1:
13 fps, max:
18 fps
fps
100%
UHD Graphics 32EUs:
10.5 [X] Maxtang MTN-ALN50 874931
Intel Core i3-N305 1.8GHz
UHD Graphics 32EUs
min:
7 fps, P1:
8 fps, max:
12 fps
fps
100%
UHD Graphics 32EUs:
35.4 fps
100%
UHD Graphics 32EUs:
18.8 fps
100%
UHD Graphics 32EUs:
14 fps
100%
UHD Graphics 32EUs:
8.7 fps
100%
UHD Graphics 32EUs:
21 fps
100%
UHD Graphics 32EUs:
11 fps
100%
UHD Graphics 32EUs:
10 fps
100%
UHD Graphics 32EUs:
9 fps
100%
UHD Graphics 32EUs:
16.5 fps
100%
UHD Graphics 32EUs:
9.2 fps
100%
UHD Graphics 32EUs:
8.6 fps
100%
UHD Graphics 32EUs:
32.5 [X] Zotac ZBOX PI430AJ 1.47.22.14 D3D12
Intel Core i3-N300 GHz
UHD Graphics 32EUs
min:
5 fps, P1:
9.8 fps, max:
142 fps
39.2 [X] Asus BR1402FG 1.47.22.14 D3D12
Intel Core i3-N305 1.8GHz
UHD Graphics 32EUs
min:
8.9 fps, P1:
12.8 fps, max:
240 fps
41.3 [X] Maxtang MTN-ALN50 1.47.22.14 D3D12
Intel Core i3-N305 1.8GHz
UHD Graphics 32EUs
min:
9.9 fps, P1:
13.1 fps, max:
216 fps
44.1 ~ 39 fps
100%
UHD Graphics 32EUs:
13.5 [X] Maxtang MTN-ALN50 1.47.22.14 D3D12
Intel Core i3-N305 1.8GHz
UHD Graphics 32EUs
min:
5 fps, P1:
5.14 fps, max:
149.3 fps
13.7 [X] Zotac ZBOX PI430AJ 1.47.22.14 D3D12
Intel Core i3-N300 GHz
UHD Graphics 32EUs
min:
5 fps, P1:
5.33 fps, max:
107.4 fps
15.2 [X] Asus BR1402FG 1.47.22.14 D3D12
Intel Core i3-N305 1.8GHz
UHD Graphics 32EUs
min:
5 fps, P1:
5.2 fps, max:
176.4 fps
17.2 ~ 15 fps
100%
UHD Graphics 32EUs:
11.5 [X] Zotac ZBOX PI430AJ 1.47.22.14 D3D12
Intel Core i3-N300 GHz
UHD Graphics 32EUs
min:
5 fps, P1:
5 fps, max:
125.8 fps
13.4 [X] Asus BR1402FG 1.47.22.14 D3D12
Intel Core i3-N305 1.8GHz
UHD Graphics 32EUs
min:
5 fps, P1:
5 fps, max:
198.8 fps
13.5 [X] Maxtang MTN-ALN50 1.47.22.14 D3D12
Intel Core i3-N305 1.8GHz
UHD Graphics 32EUs
min:
5 fps, P1:
5 fps, max:
181.9 fps
13.8 ~ 13 fps
100%
UHD Graphics 32EUs:
14.5 [X] Maxtang MTN-ALN50 1.47.22.14 D3D12
Intel Core i3-N305 1.8GHz
UHD Graphics 32EUs
min:
5 fps, P1:
5 fps, max:
232 fps
fps
100%
UHD Graphics 32EUs:
20 21 ~ 21 fps
100%
UHD Graphics 32EUs:
9 10 ~ 10 fps
100%
UHD Graphics 32EUs:
9 9 ~ 9 fps
100%
UHD Graphics 32EUs:
8 8 ~ 8 fps
HD Graphics (Cherry Trail):
21.4 fps
HD Graphics (Cherry Trail):
15.5 fps
HD Graphics (Cherry Trail):
22.6 [X] Chuwi Hi12 Intel Atom x5-Z8300 1.4GHz
HD Graphics (Cherry Trail)
min:
21 fps, max:
27 fps
fps
HD Graphics 4200:
11.2 fps
HD Graphics 4200:
17.2 fps
HD Graphics (Cherry Trail):
11.5 fps
HD Graphics 4200:
10.7 fps
HD Graphics (Cherry Trail):
7 fps
HD Graphics 4200:
11.3 fps
HD Graphics 4200:
19.2 fps
HD Graphics (Cherry Trail):
8.8 fps
HD Graphics 4200:
11.5 fps
HD Graphics (Cherry Trail):
4.8 fps
HD Graphics 4200:
14.9 fps
HD Graphics (Cherry Trail):
8.1 fps
HD Graphics (Cherry Trail):
3.9 fps
HD Graphics 4200:
37.7 fps
HD Graphics (Cherry Trail):
13.9 [X] Chuwi Hi12 Intel Atom x5-Z8300 1.4GHz
HD Graphics (Cherry Trail)
min:
7 fps, max:
19 fps
16.8 ~ 15 fps
HD Graphics 4200:
24.8 fps
HD Graphics 4200:
30.7 fps
HD Graphics (Cherry Trail):
15.1 fps
HD Graphics 4200:
20.5 fps
HD Graphics (Cherry Trail):
9.8 fps
32%
HD Graphics (Cherry Trail):
20 [X] Chuwi Hi12 Intel Atom x5-Z8300 1.4GHz
HD Graphics (Cherry Trail)
min:
18 fps
fps
34%
HD Graphics (Cherry Trail):
15.2 [X] Chuwi Hi12 Intel Atom x5-Z8300 1.4GHz
HD Graphics (Cherry Trail)
min:
13 fps
fps
27%
HD Graphics (Cherry Trail):
7.2 [X] Chuwi Hi12 Intel Atom x5-Z8300 1.4GHz
HD Graphics (Cherry Trail)
min:
6 fps
fps
100%
UHD Graphics 32EUs:
16 38.1 [X] Maxtang MTN-ALN50 Intel Core i3-N305 1.8GHz
UHD Graphics 32EUs
min:
11.2 fps, P0.1:
17.5 fps, P1:
20.5 fps, max:
132.2 fps
38.7 ~ 31 fps
28%
HD Graphics 4200:
8.8 fps
100%
UHD Graphics 32EUs:
12 25.1 ~ 19 fps
27%
HD Graphics 4200:
5.1 fps
100%
UHD Graphics 32EUs:
12.3 [X] Maxtang MTN-ALN50 Intel Core i3-N305 1.8GHz
UHD Graphics 32EUs
min:
4.16 fps, P0.1:
5.96 fps, P1:
6.76 fps, max:
52.8 fps
13 ~ 13 fps
100%
UHD Graphics 32EUs:
5.4 [X] Asus BR1402FG Intel Core i3-N305 1.8GHz
UHD Graphics 32EUs
min:
4 fps, P1:
5 fps, max:
6 fps
5.5 [X] Maxtang MTN-ALN50 Intel Core i3-N305 1.8GHz
UHD Graphics 32EUs
min:
3.3 fps, P0.1:
3.31 fps, P1:
3.4 fps, max:
13.5 fps
7 ~ 6 fps
HD Graphics 4200:
67.9 fps
HD Graphics (Cherry Trail):
20.1 fps
HD Graphics 4200:
15.6 fps
HD Graphics (Cherry Trail):
12.5 fps
100%
UHD Graphics 32EUs:
35.7 [X] Zotac ZBOX PI430AJ Intel Core i3-N300 GHz
UHD Graphics 32EUs
min:
2.51 fps, P1:
15.9 fps, max:
59.5 fps
50.8 [X] Asus BR1402FG Intel Core i3-N305 1.8GHz
UHD Graphics 32EUs
min:
2.27 fps, P1:
23.8 fps, max:
88.3 fps
55.6 [X] Maxtang MTN-ALN50 Intel Core i3-N305 1.8GHz
UHD Graphics 32EUs
min:
14.1 fps, P1:
35.7 fps, max:
87.7 fps
61.9 ~ 51 fps
21%
HD Graphics (Cherry Trail):
10.8 (!) [X] Microsoft Surface 3 Intel Atom x7-Z8700 1.6GHz
HD Graphics (Cherry Trail)
fps
100%
UHD Graphics 32EUs:
9.4 fps
100%
UHD Graphics 32EUs:
4 fps
HD Graphics (Cherry Trail):
9.5 fps
HD Graphics (Cherry Trail):
5.7 fps
HD Graphics (Cherry Trail):
16.2 fps
HD Graphics (Cherry Trail):
6.1 fps
HD Graphics (Cherry Trail):
16 fps
HD Graphics (Cherry Trail):
12 fps
HD Graphics 4200:
12.9 fps
HD Graphics 4200:
3.4 4 ~ 4 fps
HD Graphics 4200:
15.3 fps
HD Graphics (Cherry Trail):
15.6 fps
HD Graphics 4200:
10.9 fps
HD Graphics 4200:
89.1 fps
HD Graphics 4200:
24.4 fps
HD Graphics (Cherry Trail):
5.5 10 ~ 8 fps
HD Graphics 4200:
19.9 fps
HD Graphics 4200:
11.7 fps
HD Graphics 4200:
57.5 fps
HD Graphics (Cherry Trail):
22 27.3 ~ 25 fps
HD Graphics 4200:
18.9 fps
HD Graphics (Cherry Trail):
12.5 13.5 ~ 13 fps
HD Graphics 4200:
27.2 fps
HD Graphics 4200:
21.9 fps
HD Graphics 4200:
43.1 fps
HD Graphics 4200:
23.4 fps
HD Graphics 4200:
11 14 ~ 13 fps
HD Graphics 4200:
5.3 7.1 ~ 6 fps
HD Graphics 4200:
26.2 fps
HD Graphics 4200:
13.9 fps
HD Graphics 4200:
14.1 fps
HD Graphics 4200:
18.4 fps
HD Graphics 4200:
12.7 fps
HD Graphics 4200:
15.9 fps
HD Graphics (Cherry Trail):
13.3 fps
HD Graphics 4200:
10.1 fps
HD Graphics 4200:
90.8 fps
HD Graphics 4200:
59.7 fps
HD Graphics 4200:
33.3 fps
HD Graphics 4200:
22.3 fps
HD Graphics 4200:
27.7 fps
HD Graphics 4200:
18.4 fps
HD Graphics 4200:
13.3 fps
HD Graphics 4200:
11.3 fps
HD Graphics 4200:
11.9 fps
HD Graphics 4200:
17.8 fps
HD Graphics 4200:
10.4 fps
HD Graphics (Cherry Trail):
58 fps
HD Graphics (Cherry Trail):
47 fps
HD Graphics (Cherry Trail):
29.7 fps
HD Graphics (Cherry Trail):
16.5 fps
HD Graphics 4200:
51.1 fps
HD Graphics (Cherry Trail):
24 fps
HD Graphics 4200:
25.7 fps
HD Graphics (Cherry Trail):
13.5 fps
HD Graphics 4200:
17.9 fps
HD Graphics 4200:
12.7 fps
HD Graphics (Cherry Trail):
16 18 18.9 [X] Medion Akoya E2215T Intel Atom x5-Z8350 1.4GHz
HD Graphics (Cherry Trail)
19.8 20.1 20.5 ~ 19 fps
HD Graphics (Cherry Trail):
6.4 7.9 [X] Medion Akoya E2215T Intel Atom x5-Z8350 1.4GHz
HD Graphics (Cherry Trail)
9.3 9.8 10 10 ~ 9 fps
HD Graphics (Cherry Trail):
5.6 5.7 [X] Medion Akoya E2215T Intel Atom x5-Z8350 1.4GHz
HD Graphics (Cherry Trail)
6.7 7.6 7.9 8.4 ~ 7 fps
HD Graphics (Cherry Trail):
2.4 2.6 ~ 2 fps
HD Graphics 4200:
95 109.2 ~ 102 fps
HD Graphics 4200:
31 38.8 ~ 35 fps
HD Graphics 4200:
20 22.7 ~ 21 fps
HD Graphics 4200:
18.8 fps
HD Graphics 4200:
10.1 fps
HD Graphics (Cherry Trail):
7 8.3 9 ~ 8 fps
HD Graphics (Cherry Trail):
3.7 3.8 ~ 4 fps
HD Graphics 4200:
11.4 fps
HD Graphics 4200:
47.6 fps
HD Graphics 4200:
20.9 fps
HD Graphics 4200:
14.2 fps
HD Graphics (Cherry Trail):
34 fps
HD Graphics 4200:
26.2 fps
HD Graphics 4200:
16.5 fps
HD Graphics 4200:
16.7 fps
HD Graphics 4200:
11.4 fps
HD Graphics 4200:
27.2 fps
HD Graphics 4200:
19.1 fps
HD Graphics 4200:
22.9 fps
HD Graphics 4200:
15.1 fps
HD Graphics 4200:
17.8 fps
HD Graphics (Cherry Trail):
15.2 fps
HD Graphics 4200:
14.5 fps
HD Graphics (Cherry Trail):
11.6 fps
HD Graphics 4200:
13.9 fps
HD Graphics 4200:
104.8 fps
HD Graphics 4200:
55.6 fps
HD Graphics 4200:
49.2 fps
HD Graphics 4200:
31.7 fps
HD Graphics (Cherry Trail):
0 (!) [X] Microsoft Surface 3 Intel Atom x7-Z8700 1.6GHz
HD Graphics (Cherry Trail)
fps
HD Graphics 4200:
15.5 fps
HD Graphics (Cherry Trail):
0 (!) [X] Microsoft Surface 3 Intel Atom x7-Z8700 1.6GHz
HD Graphics (Cherry Trail)
fps
HD Graphics 4200:
70.7 fps
HD Graphics 4200:
35.5 fps
HD Graphics 4200:
18.9 fps
HD Graphics (Cherry Trail):
20.3 fps
HD Graphics 4200:
12.5 fps
HD Graphics (Cherry Trail):
11.4 fps
HD Graphics 4200:
22.7 fps
HD Graphics 4200:
16.5 fps
HD Graphics 4200:
34.5 fps
HD Graphics 4200:
18.9 fps
HD Graphics 4200:
12.6 fps
HD Graphics (Cherry Trail):
24.3 [X] Chuwi Hi12 Intel Atom x5-Z8300 1.4GHz
HD Graphics (Cherry Trail)
min:
20 fps, max:
29 fps
31.9 ~ 28 fps
HD Graphics (Cherry Trail):
16 [X] Chuwi Hi12 Intel Atom x5-Z8300 1.4GHz
HD Graphics (Cherry Trail)
min:
13 fps, max:
19 fps
19 ~ 18 fps
HD Graphics 4200:
16.9 19 ~ 18 fps
HD Graphics 4200:
28.2 fps
HD Graphics 4200:
19.5 fps
HD Graphics 4200:
11.1 fps
HD Graphics (Cherry Trail):
8 fps
HD Graphics 4200:
24.4 fps
HD Graphics (Cherry Trail):
15.5 18.9 ~ 17 fps
HD Graphics 4200:
10.2 fps
HD Graphics (Cherry Trail):
7.2 8.5 ~ 8 fps
HD Graphics 4200:
13.9 fps
HD Graphics (Cherry Trail):
25.6 fps
HD Graphics 4200:
15.4 19 ~ 17 fps
HD Graphics (Cherry Trail):
12 fps
HD Graphics (Cherry Trail):
28.1 fps
HD Graphics 4200:
12 34.1 ~ 23 fps
HD Graphics (Cherry Trail):
12.5 fps
HD Graphics 4200:
20.4 fps
HD Graphics 4200:
54.8 fps
HD Graphics (Cherry Trail):
18.7 fps
HD Graphics (Cherry Trail):
63.2 64 ~ 64 fps
HD Graphics (Cherry Trail):
18 18.8 ~ 18 fps
HD Graphics (Cherry Trail):
14 fps
HD Graphics (Cherry Trail):
7 fps
HD Graphics 4200:
32.2 fps
HD Graphics 4200:
24.5 fps
HD Graphics 4200:
15.6 fps
HD Graphics 4200:
37.5 fps
HD Graphics 4200:
19.5 fps
HD Graphics 4200:
56.5 fps
HD Graphics 4200:
22.8 fps
HD Graphics 4200:
121 [X] Panasonic ToughPad FZ-M1 Intel Core i5-4302Y 1.6GHz
HD Graphics 4200
130 ~ 126 fps
HD Graphics 4200:
43.9 46.9 [X] Panasonic ToughPad FZ-M1 Intel Core i5-4302Y 1.6GHz
HD Graphics 4200
~ 45 fps
HD Graphics 4200:
64.6 fps
HD Graphics (Cherry Trail):
44 50.9 [X] Chuwi Hi12 Intel Atom x5-Z8300 1.4GHz
HD Graphics (Cherry Trail)
min:
40 fps, max:
60 fps
~ 47 fps
HD Graphics 4200:
53.4 fps
HD Graphics (Cherry Trail):
18.3 [X] Chuwi Hi12 Intel Atom x5-Z8300 1.4GHz
HD Graphics (Cherry Trail)
min:
13 fps, max:
29 fps
fps
Average Gaming Intel UHD Graphics 32EUs (Alder Lake) → 100% Average Gaming 30-70 fps → 100%
Average Gaming Intel HD Graphics 4200 → 28% Average Gaming Intel HD Graphics (Cherry Trail) → 28% Intel UHD Graphics 32EUs (Alder Lake) low med. high ultra QHD 4K Prince of Persia The Lost Crown 37 26.7 24 The Finals 16.9 11.9 10.4 7.74 Total War Pharaoh 27.1 19.9 13 11.4 Counter-Strike 2 11.3 6.38 5.29 Cyberpunk 2077 2.1 Phantom Liberty 7 5.53 Diablo 4 16.1 14.8 11.7 11.1 The Witcher 3 v4.00 14.1 11.2 GRID Legends 27.3 21.1 15.9 F1 2021 46 18.3 16.5 10.5 F1 2020 35.4 18.8 14 8.7 Far Cry New Dawn 21 11 10 9 Shadow of the Tomb Raider 16.5 9.2 8.6 Strange Brigade 39 15 13 14.5 Far Cry 5 21 10 9 8 X-Plane 11.11 23 18 16 Final Fantasy XV Benchmark 18 9 7 Dota 2 Reborn 62 45 27 25 The Witcher 3 31 19 13 6 GTA V 51 43 9.43 3.98 < 30 fps < 60 fps < 120 fps ≥ 120 fps 12 5 1 16 3 17 12
For more games that might be playable and a list of all games and graphics cards visit our Gaming List
v1.28
log 01. 22:41:48
#0 checking url part for id 12292 +0s ... 0s
#1 checking url part for id 4576 +0s ... 0s
#2 checking url part for id 6197 +0s ... 0s
#3 redirected to Ajax server, took 1719866508 +0s ... 0s
#4 did not recreate cache, as it is less than 5 days old! Created at Mon, 01 Jul 2024 05:16:07 +0200 +0s ... 0s
#5 composed specs +0.03s ... 0.03s
#6 did output specs +0s ... 0.03s
#7 start showIntegratedCPUs +0s ... 0.03s
#8 getting avg benchmarks for device 12292 +0.035s ... 0.065s
#9 got single benchmarks 12292 +0.009s ... 0.074s
#10 getting avg benchmarks for device 4576 +0.004s ... 0.077s
#11 got single benchmarks 4576 +0.015s ... 0.092s
#12 getting avg benchmarks for device 6197 +0.004s ... 0.095s
#13 got single benchmarks 6197 +0.023s ... 0.119s
#14 got avg benchmarks for devices +0s ... 0.119s
#15 min, max, avg, median took s +0.04s ... 0.159s
#16 before gaming benchmark output +0s ... 0.159s
#17 Got 526 rows for game benchmarks. +0.036s ... 0.195s
#18 composed SQL query for gamebenchmarks +0s ... 0.195s
#19 got data and put it in $dataArray +0.007s ... 0.202s
#20 benchmarks composed for output. +0.034s ... 0.236s
#21 calculated avg scores. +0s ... 0.236s
#22 return log +0.001s ... 0.237s
Please share our article, every link counts!
Redaktion, 2017-09- 8 (Update: 2023-07- 1)
 Deutsch
 English
 Español
 Français
 Italiano
 Nederlands
 Polski
 Português
 Русский
 Türkçe
 Svenska
 Chinese
 Magyar