NVIDIA T600 vs NVIDIA GeForce RTX 4070 Ti SUPER vs NVIDIA T600 Laptop GPU
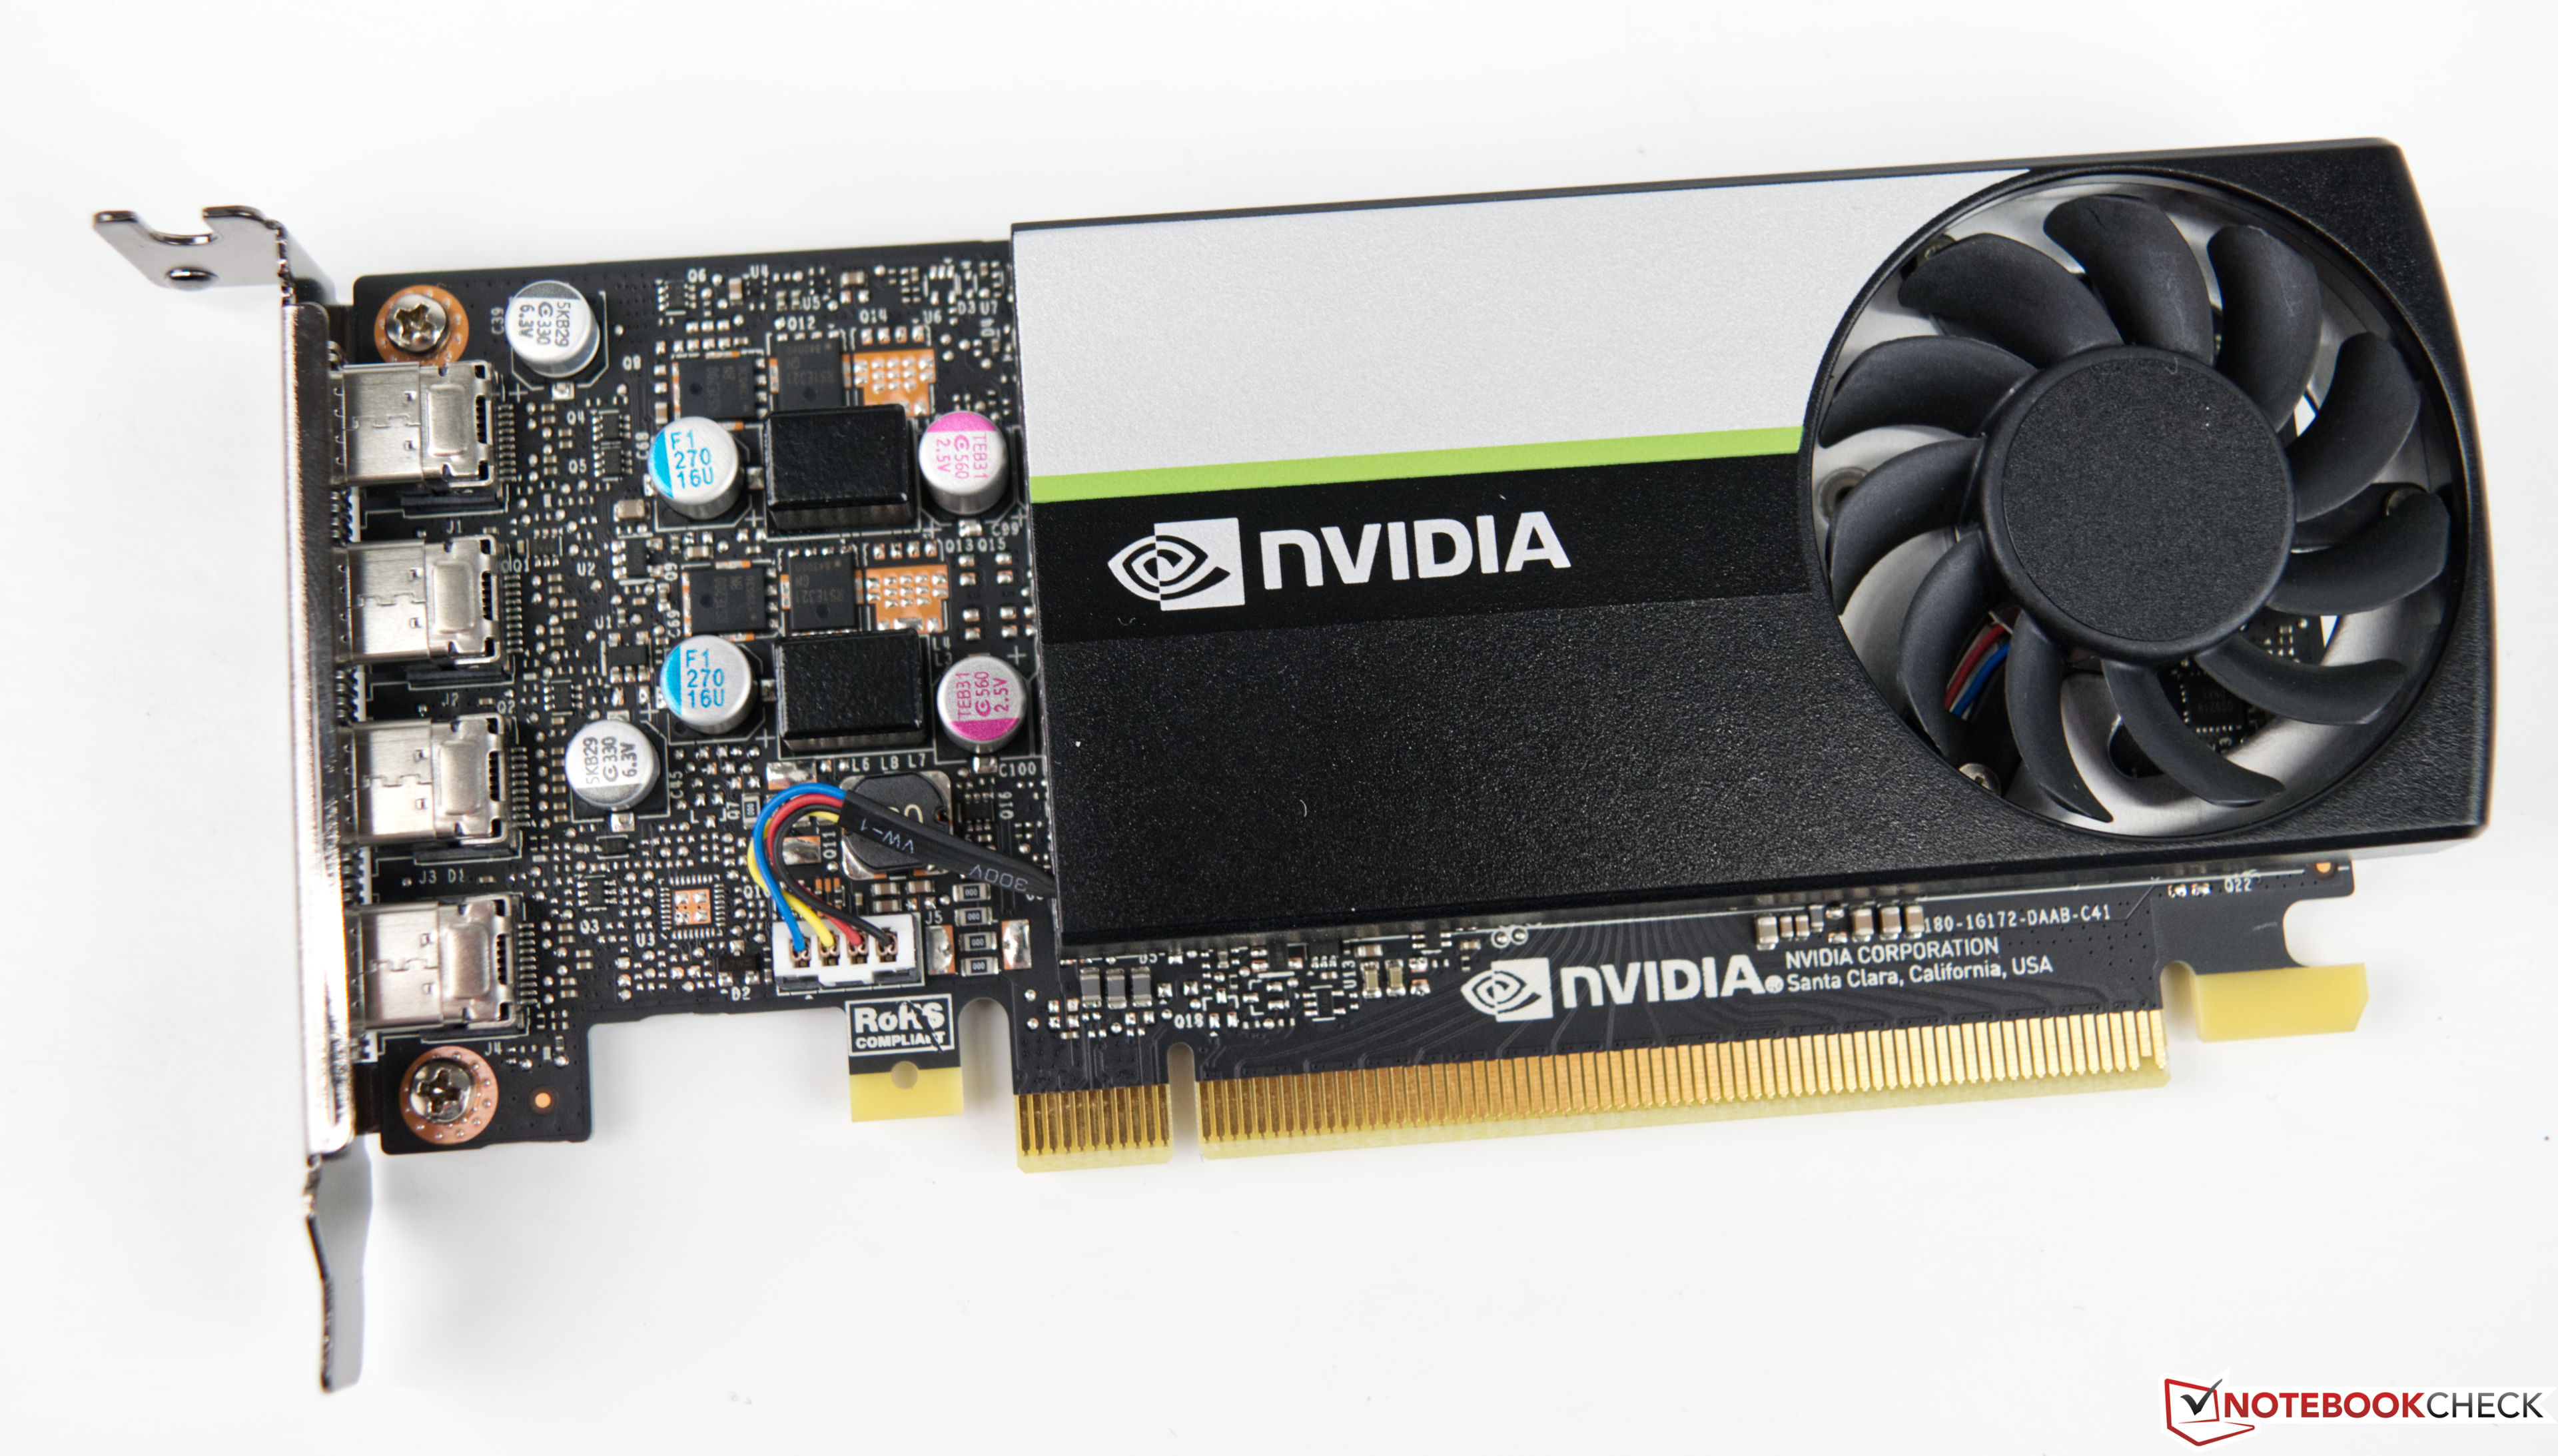
NVIDIA T600 ► remove from comparison
The Nvidia T600 Desktop GPU is a professional graphics card for workstations that is based on the Turing architecture (TU117 chip). The desktop version only offers 640 of the 1024 cores and therefore also less than the T600 mobile (896 CUDA cores). The card offers 4 GB GDDR6 graphics memory connected with a 128 bit bus (up to 160 GB/s bandwidth). The T600 supports certified drivers (former Quadro line) for professional applications like CAD, 3D modelling, DCC, medicine, or visualization applications.
The maximum power consumption of the card is rated at 40W.
NVIDIA GeForce RTX 4070 Ti SUPER ► remove from comparison
The Nvidia GeForce RTX 4070 Ti SUPER is a high-end desktop graphics card based on the Ada Lovelace architecture. It uses the AD103 chip and offers 8.448 cores and 16 GB GDDR6X graphics memory (256-bit bus with 22.4 Gbits).
The gaming performance is still sufficient for 4k with ultra settings, even in demanding games such as Cyberpunk, but 60 fps is no longer always achieved. With ray tracing, the use of DLSS and possibly reducing the resolution is recommended. In a competitive comparison, the SUPER variant ranks, as expected, between the RTX 4080 and the old 4070 Ti in a competitive comparison.
The AD103 chip is produced at TSMC in 5nm (4N with EUV) and is specified with a TGP (Total Graphics Power) of 285 watts.
NVIDIA T600 Laptop GPU ► remove from comparison
The Nvidia T600 Laptop GPU (or Quadro T600 for laptops) is a professional mobile graphics card that is based on the Turing architecture (TU117 chip). It is similar to the consumer GTX 1650 with 896 CUDA cores and a 128 Bit memory bus for GDDR6 graphics memory (10 Gbits). The chip is manufactured in 12nm FinFET at TSMC. The T600 was introduced as a refresh together with the T1200 and should be slightly slower than the older Quadro T1000 (2.6 versus 2.5 TFLOPS peak SP performance).
The Turing generation did not only introduce raytracing for the RTX cards, but also optimized the architecture of the cores and caches. According to Nvidia the CUDA cores offer now a concurrent execution of floating point and integer operations for increased performance in compute-heavy workloads of modern games.
Furthermore, the caches were reworked (new unified memory architecture with twice the cache compared to Pascal). This leads to up to 50% more instructions per clock and a 40% more power efficient usage compared to Pascal. In contrary to the faster Quadro RTX cards, the T600 do not feature raytracing and Tensor cores.
Currently Nvidia only specifies the TDP of 25 Watt (the older T1000 had a TGP of 40-50 Watt). Therefore, the T600 should be well suited for thin and light laptops.
NVIDIA T600 NVIDIA GeForce RTX 4070 Ti SUPER NVIDIA T600 Laptop GPU Quadro Turing Series Architecture Turing Ada Lovelace Turing Pipelines 640 - unified 8448 - unified 896 - unified TMUs 40 264 ROPs 32 96 Core Speed 735 - 1335 (Boost) MHz 2340 - 2610 (Boost) MHz 1400 (Boost) MHz Memory Speed 10000 effective = 1250 MHz 21000 effective = 1400 MHz 10000 MHz Memory Bus Width 128 Bit 256 Bit 128 Bit Memory Type GDDR6 GDDR6X GDDR6 Max. Amount of Memory 4 GB 16 GB 4 GB Shared Memory no no no Memory Bandwidth 160 GB/s API DirectX 12_1, Shader 6.6, OpenGL 4.6, OpenCL 3.0, Vulkan 1.3 DirectX 12 Ultimate, Shader 6.7, OpenGL 4.6, OpenCL 3.0, Vulkan 1.3 DirectX 12_1, OpenGL 4.6 Power Consumption 40 Watt 285 Watt 40 Watt Transistors 4.7 Billion 45.9 Billion Die Size 200 mm² 379 mm² technology 12 nm 5 nm 12 nm PCIe 3.0 x16 4.0 x16 Displays 4 Displays (max.), DisplayPort 4x mini-DisplayPort 1.4a 4 Displays (max.), HDMI 2.1, DisplayPort 1.4a Date of Announcement 12.04.2021 24.01.2024 12.04.2021 Codename AD103-275 Raytracing Cores 66 Tensor / AI Cores 264 Theoretical Performance 40.1 TFLOPS FP16, 40.1 TFLOPS FP32, 0.63 TFLOPS FP64 Cache L2: 48 MB Predecessor NVIDIA GeForce RTX 4070 Ti Features 2.5 TFLOPS SP max. performance, DisplayPort 1.4, HDMI 2.0b, PCIe 4.0 x8, 160 GB/s memory bandwidth Notebook Size medium sized Link to Manufacturer Page www.nvidia.com
Benchmarks Performance Rating - 3DMark 11 + Fire Strike + Time Spy - T600
3 pt (9%)
...
...
Performance Rating - 3DMark 11 + Fire Strike + Time Spy - NVIDIA GeForce RTX 4070 Ti SUPER
24 pt (72%)
...
NVIDIA GeForce RTX 4070 Ti SUPER
Performance Rating - 3DMark 11 + Fire Strike + Time Spy - T600 Laptop GPU
3.6 pt (11%)
...
...
3DMark - 3DMark Time Spy Score
2496 Points (7%)
23540 Points (68%)
3075 Points (9%)
GPU TDP ? TDP 25 W 100% 24%
3DMark - 3DMark Time Spy Graphics
2195 Points (6%)
23695 Points (63%)
2766 Points (7%)
GPU TDP ? TDP 25 W 100% 21%
3DMark - 3DMark Ice Storm Unlimited Graphics
304731 Points (35%)
759135 Points (86%)
3DMark - 3DMark Ice Storm Extreme Graphics
152912 Points (20%)
3DMark - 3DMark Cloud Gate Score
31922 Points (34%)
79438 Points (85%)
35278 Points (38%)
GPU TDP ? TDP 25 W 100% 63%
3DMark - 3DMark Cloud Gate Graphics
40917 Points (11%)
165604 Points (44%)
53941 Points (14%)
GPU TDP ? TDP 25 W 100% 52%
3DMark - 3DMark Fire Strike Standard Score
6284 Points (11%)
42631 Points (75%)
7475 Points (13%)
GPU TDP ? TDP 25 W 100% 31%
3DMark - 3DMark Fire Strike Standard Graphics
6552 Points (7%)
52738 Points (60%)
7928 Points (9%)
GPU TDP ? TDP 25 W 100% 27%
3DMark - 3DMark Ice Storm Graphics
182459 Points (22%)
587810 Points (71%)
75124 Points (9%)
GPU TDP ? TDP 25 W 100% 20%
3DMark - 3DMark Night Raid
91419 Points (86%)
3DMark - 3DMark Night Raid Graphics Score
209177 Points (80%)
3DMark 11 - 3DM11 Performance Score
9497 Points (13%)
54278 Points (75%)
10973 Points (15%)
GPU TDP ? TDP 25 W 100% 34%
3DMark 11 - 3DM11 Performance GPU
8694 Points (7%)
74834 Points (64%)
10498 Points (9%)
GPU TDP ? TDP 25 W 100% 25%
3DMark Vantage + NVIDIA T600 3DMark Vantage - 3DM Vant. Perf. total
344838 Points (100%)
3DM Vant. Perf. total + NVIDIA T600 Laptop GPU
39112 Points (11%)
GPU TDP ? TDP 25 W 100% 11%
3DM Vant. Perf. GPU no PhysX + NVIDIA T600 3DMark Vantage - 3DM Vant. Perf. GPU no PhysX
30400 Points (17%)
3DM Vant. Perf. GPU no PhysX + NVIDIA T600 Laptop GPU
34680 Points (20%)
GPU TDP ? TDP 25 W 88% 100%
3DMark 05 - 3DMark 05 - Standard
46380 Points (51%)
3DMark 06 3DMark 06 - Standard 1280x1024 + NVIDIA T600
43997 Points (57%)
3DMark 06 - Standard 1280x1024 + NVIDIA T600 Laptop GPU
43438 Points (57%)
GPU TDP ? TDP 25 W 100% 99%
Unigine Valley 1.0 - Unigine Valley 1.0 DX
32.7 fps (11%)
242.6 fps (79%)
Blender - Blender 3.3 Classroom CUDA *
17 Seconds (3%)
Blender - Blender 3.3 Classroom OPTIX *
10 Seconds (4%)
SPECviewperf 12 + NVIDIA T600 SPECviewperf 12 - specvp12 sw-03
115 fps (29%)
specvp12 snx-02 + NVIDIA T600 SPECviewperf 12 - specvp12 snx-02
68.6 fps (10%)
specvp12 showcase-01 + NVIDIA T600 SPECviewperf 12 - specvp12 showcase-01
35.3 fps (8%)
specvp12 mediacal-01 + NVIDIA T600 SPECviewperf 12 - specvp12 mediacal-01
19.5 fps (5%)
specvp12 maya-04 + NVIDIA T600 SPECviewperf 12 - specvp12 maya-04
67.4 fps (18%)
specvp12 energy-01 + NVIDIA T600 SPECviewperf 12 - specvp12 energy-01
5 fps (4%)
specvp12 creo-01 + NVIDIA T600 SPECviewperf 12 - specvp12 creo-01
78.5 fps (31%)
specvp12 catia-04 + NVIDIA T600 SPECviewperf 12 - specvp12 catia-04
76.9 fps (13%)
specvp12 3dsmax-05 + NVIDIA T600 SPECviewperf 12 - specvp12 3dsmax-05
80 fps (14%)
SPECviewperf 13 specvp13 sw-04 + NVIDIA T600 SPECviewperf 13 - specvp13 sw-04
114 fps (31%)
specvp13 sw-04 + NVIDIA T600 Laptop GPU
106 fps (28%)
GPU TDP ? TDP 25 W 100% 93%
specvp13 snx-03 + NVIDIA T600 SPECviewperf 13 - specvp13 snx-03
122 fps (14%)
specvp13 snx-03 + NVIDIA T600 Laptop GPU
137 fps (15%)
GPU TDP ? TDP 25 W 89% 100%
specvp13 showcase-02 + NVIDIA T600 SPECviewperf 13 - specvp13 showcase-02
34.9 fps (8%)
specvp13 showcase-02 + NVIDIA T600 Laptop GPU
41.4 fps (9%)
GPU TDP ? TDP 25 W 84% 100%
specvp13 medical-02 + NVIDIA T600 SPECviewperf 13 - specvp13 medical-02
35.7 fps (7%)
specvp13 medical-02 + NVIDIA T600 Laptop GPU
42.6 fps (9%)
GPU TDP ? TDP 25 W 84% 100%
specvp13 maya-05 + NVIDIA T600 SPECviewperf 13 - specvp13 maya-05
99.8 fps (11%)
specvp13 maya-05 + NVIDIA T600 Laptop GPU
110 fps (12%)
GPU TDP ? TDP 25 W 91% 100%
specvp13 energy-02 + NVIDIA T600 SPECviewperf 13 - specvp13 energy-02
12.6 fps (4%)
specvp13 energy-02 + NVIDIA T600 Laptop GPU
16.1 fps (5%)
GPU TDP ? TDP 25 W 78% 100%
specvp13 creo-02 + NVIDIA T600 SPECviewperf 13 - specvp13 creo-02
98 fps (14%)
specvp13 creo-02 + NVIDIA T600 Laptop GPU
110 fps (16%)
GPU TDP ? TDP 25 W 89% 100%
specvp13 3dsmax-06 + NVIDIA T600 SPECviewperf 13 - specvp13 3dsmax-06
79.9 fps (14%)
specvp13 3dsmax-06 + NVIDIA T600 Laptop GPU
89.8 fps (16%)
GPU TDP ? TDP 25 W 89% 100%
specvp13 catia-05 + NVIDIA T600 Laptop GPU SPECviewperf 13 - specvp13 catia-05
130 fps (14%)
SPECviewperf 2020 specvp2020 solidworks-05 4k + NVIDIA T600 SPECviewperf 2020 - specvp2020 solidworks-05 4k
16.9 fps (5%)
specvp2020 snx-04 4k + NVIDIA T600 SPECviewperf 2020 - specvp2020 snx-04 4k
75.6 fps (8%)
specvp2020 medical-03 4k + NVIDIA T600 SPECviewperf 2020 - specvp2020 medical-03 4k
4.5 fps (4%)
specvp2020 maya-06 4k + NVIDIA T600 SPECviewperf 2020 - specvp2020 maya-06 4k
46.1 fps (8%)
specvp2020 energy-03 4k + NVIDIA T600 SPECviewperf 2020 - specvp2020 energy-03 4k
6.7 fps (1%)
specvp2020 creo-03 4k + NVIDIA T600 SPECviewperf 2020 - specvp2020 creo-03 4k
32.3 fps (15%)
specvp2020 catia-06 4k + NVIDIA T600 SPECviewperf 2020 - specvp2020 catia-06 4k
13.8 fps (9%)
specvp2020 3dsmax-07 4k + NVIDIA T600 SPECviewperf 2020 - specvp2020 3dsmax-07 4k
19.4 fps (8%)
specvp2020 solidworks-05 1080p + NVIDIA T600 Laptop GPU SPECviewperf 2020 - specvp2020 solidworks-05 1080p
73.4 fps (14%)
specvp2020 snx-04 1080p + NVIDIA T600 Laptop GPU SPECviewperf 2020 - specvp2020 snx-04 1080p
136 fps (22%)
specvp2020 medical-03 1080p + NVIDIA T600 Laptop GPU SPECviewperf 2020 - specvp2020 medical-03 1080p
18.7 fps (13%)
specvp2020 maya-06 1080p + NVIDIA T600 Laptop GPU SPECviewperf 2020 - specvp2020 maya-06 1080p
125 fps (18%)
specvp2020 energy-03 1080p + NVIDIA T600 Laptop GPU SPECviewperf 2020 - specvp2020 energy-03 1080p
16 fps (13%)
specvp2020 creo-03 1080p + NVIDIA T600 Laptop GPU SPECviewperf 2020 - specvp2020 creo-03 1080p
67.3 fps (33%)
specvp2020 catia-06 1080p + NVIDIA T600 Laptop GPU SPECviewperf 2020 - specvp2020 catia-06 1080p
33.1 fps (21%)
specvp2020 3dsmax-07 1080p + NVIDIA T600 Laptop GPU SPECviewperf 2020 - specvp2020 3dsmax-07 1080p
40.9 fps (19%)
Cinebench R10 Cinebench R10 Shading (32bit) + NVIDIA T600 Cinebench R10 - Cinebench R10 Shading (32bit)
6830 Points (5%)
Cinebench R11.5 Cinebench R11.5 OpenGL 64 Bit + NVIDIA T600 Cinebench R11.5 - Cinebench R11.5 OpenGL 64 Bit
104.1 fps (36%)
Cinebench R11.5 OpenGL 64 Bit + NVIDIA T600 Laptop GPU
162.3 fps (56%)
GPU TDP ? TDP 25 W 64% 100%
Cinebench R15 + NVIDIA T600 Cinebench R15 - Cinebench R15 OpenGL 64 Bit
227.1 fps (13%)
Cinebench R15 OpenGL 64 Bit + NVIDIA GeForce RTX 4070 Ti SUPER
min: 289 avg: 311 median: 317 (18%) max: 327 fps
Cinebench R15 OpenGL 64 Bit + NVIDIA T600 Laptop GPU
268 fps (16%)
GPU TDP ? TDP 25 W 100% 92%
Cinebench R15 OpenGL Ref. Match 64 Bit + NVIDIA T600 Cinebench R15 - Cinebench R15 OpenGL Ref. Match 64 Bit
99.6 % (100%)
Cinebench R15 OpenGL Ref. Match 64 Bit + NVIDIA GeForce RTX 4070 Ti SUPER
99.6 % (100%)
Cinebench R15 OpenGL Ref. Match 64 Bit + NVIDIA T600 Laptop GPU
99.6 % (100%)
GPU TDP ? TDP 25 W 100% 100%
GFXBench - GFXBench 5.0 Aztec Ruins High Tier Offscreen
62.7 fps (11%)
GFXBench - GFXBench 5.0 Aztec Ruins Normal Tier Offscreen
162.2 fps (12%)
GFXBench - GFXBench Car Chase Offscreen
156.5 fps (18%)
GFXBench (DX / GLBenchmark) 2.7 + NVIDIA T600 Laptop GPU GFXBench (DX / GLBenchmark) 2.7 - GFXBench T-Rex HD Offscreen C24Z16
585 fps (5%)
LuxMark v2.0 64Bit - LuxMark v2.0 Room GPU
1121 Samples/s (5%)
9355 Samples/s (42%)
1166 Samples/s (5%)
GPU TDP ? TDP 25 W 100% 22%
LuxMark v2.0 64Bit - LuxMark v2.0 Sala GPU
2049 Samples/s (4%)
19620 Samples/s (34%)
2200 Samples/s (4%)
GPU TDP ? TDP 25 W 100% 20%
ComputeMark v2.1 - ComputeMark v2.1 Result
4825 Points (5%)
54675 Points (59%)
5694 Points (6%)
GPU TDP ? TDP 25 W 100% 19%
Power Consumption - Furmark Stress Test Power Consumption - external Monitor *
76.7 Watt (11%)
min: 395 avg: 410.5 median: 410.5 (58%) max: 426 Watt
54.7 Watt (8%)
GPU TDP ? TDP 25 W 100% 160%
Power Consumption - The Witcher 3 Power Consumption - external Monitor *
83.5 Watt (12%)
min: 393 avg: 395.5 median: 395.5 (55%) max: 398 Watt
60.6 Watt (8%)
GPU TDP ? TDP 25 W 100% 154%
Power Consumption - Witcher 3 Power Consumption *
62.3 Watt (14%)
Power Consumption - Witcher 3 ultra Power Efficiency
0.4 fps per Watt (40%)
Power Consumption - Witcher 3 ultra Power Efficiency - external Monitor
0.3 fps per Watt (27%)
0.5 fps per Watt (44%)
0.5 fps per Watt (38%)
GPU TDP ? TDP 25 W 94% 100%
Emissions Witcher 3 Fan Noise + NVIDIA T600 Laptop GPU Emissions - Witcher 3 Fan Noise
46.6 dB(A) (75%)
Average Benchmarks NVIDIA T600 → 100% n=14 Average Benchmarks NVIDIA GeForce RTX 4070 Ti SUPER → 648% n=14 Average Benchmarks NVIDIA T600 Laptop GPU → 111% n=14
- Range of benchmark values for this graphics card
- Average benchmark values for this graphics card
* Smaller numbers mean a higher performance
1 This benchmark is not used for the average calculation
Game Benchmarks The following benchmarks stem from our benchmarks of review laptops. The performance depends on the used graphics memory, clock rate, processor, system settings, drivers, and operating systems. So the results don't have to be representative for all laptops with this GPU. For detailed information on the benchmark results, click on the fps number.
NVIDIA GeForce RTX 4070 Ti SUPER:
163 fps
NVIDIA GeForce RTX 4070 Ti SUPER:
141.8 fps
NVIDIA GeForce RTX 4070 Ti SUPER:
113.2 fps
NVIDIA GeForce RTX 4070 Ti SUPER:
76.6 fps
NVIDIA GeForce RTX 4070 Ti SUPER:
39.8 fps
NVIDIA GeForce RTX 4070 Ti SUPER:
68.9 fps
NVIDIA GeForce RTX 4070 Ti SUPER:
227 fps
NVIDIA GeForce RTX 4070 Ti SUPER:
184 fps
NVIDIA GeForce RTX 4070 Ti SUPER:
179 fps
NVIDIA GeForce RTX 4070 Ti SUPER:
133 fps
NVIDIA GeForce RTX 4070 Ti SUPER:
84 fps
NVIDIA GeForce RTX 4070 Ti SUPER:
112 fps
NVIDIA GeForce RTX 4070 Ti SUPER:
124.7 fps
NVIDIA GeForce RTX 4070 Ti SUPER:
114.4 fps
NVIDIA GeForce RTX 4070 Ti SUPER:
82.5 fps
NVIDIA GeForce RTX 4070 Ti SUPER:
44.7 fps
NVIDIA GeForce RTX 4070 Ti SUPER:
63.7 fps
NVIDIA GeForce RTX 4070 Ti SUPER:
221 fps
NVIDIA GeForce RTX 4070 Ti SUPER:
206 fps
NVIDIA GeForce RTX 4070 Ti SUPER:
170 fps
NVIDIA GeForce RTX 4070 Ti SUPER:
136 fps
NVIDIA GeForce RTX 4070 Ti SUPER:
84 fps
NVIDIA GeForce RTX 4070 Ti SUPER:
112 fps
NVIDIA GeForce RTX 4070 Ti SUPER:
188.5 fps
NVIDIA GeForce RTX 4070 Ti SUPER:
188.5 fps
NVIDIA GeForce RTX 4070 Ti SUPER:
170.8 fps
NVIDIA GeForce RTX 4070 Ti SUPER:
150.3 fps
NVIDIA GeForce RTX 4070 Ti SUPER:
94.9 fps
NVIDIA GeForce RTX 4070 Ti SUPER:
42.3 fps
NVIDIA GeForce RTX 4070 Ti SUPER:
246 fps
NVIDIA GeForce RTX 4070 Ti SUPER:
223 fps
NVIDIA GeForce RTX 4070 Ti SUPER:
218 fps
NVIDIA GeForce RTX 4070 Ti SUPER:
157.8 fps
NVIDIA GeForce RTX 4070 Ti SUPER:
117.2 fps
NVIDIA GeForce RTX 4070 Ti SUPER:
133.9 fps
NVIDIA GeForce RTX 4070 Ti SUPER:
385 fps
NVIDIA GeForce RTX 4070 Ti SUPER:
402 fps
NVIDIA GeForce RTX 4070 Ti SUPER:
363 fps
NVIDIA GeForce RTX 4070 Ti SUPER:
138.2 fps
NVIDIA GeForce RTX 4070 Ti SUPER:
90 fps
NVIDIA GeForce RTX 4070 Ti SUPER:
45.1 fps
NVIDIA GeForce RTX 4070 Ti SUPER:
77.4 fps
NVIDIA GeForce RTX 4070 Ti SUPER:
210.6 fps
NVIDIA GeForce RTX 4070 Ti SUPER:
202.9 fps
NVIDIA GeForce RTX 4070 Ti SUPER:
149.4 fps
NVIDIA GeForce RTX 4070 Ti SUPER:
114.8 fps
NVIDIA GeForce RTX 4070 Ti SUPER:
70 fps
NVIDIA GeForce RTX 4070 Ti SUPER:
371 fps
NVIDIA GeForce RTX 4070 Ti SUPER:
384 fps
NVIDIA GeForce RTX 4070 Ti SUPER:
336 fps
NVIDIA GeForce RTX 4070 Ti SUPER:
144.9 fps
NVIDIA GeForce RTX 4070 Ti SUPER:
95.1 fps
NVIDIA GeForce RTX 4070 Ti SUPER:
48.9 fps
NVIDIA GeForce RTX 4070 Ti SUPER:
278 fps
NVIDIA GeForce RTX 4070 Ti SUPER:
282 fps
NVIDIA GeForce RTX 4070 Ti SUPER:
283 fps
NVIDIA GeForce RTX 4070 Ti SUPER:
217 fps
NVIDIA GeForce RTX 4070 Ti SUPER:
99.2 fps
NVIDIA GeForce RTX 4070 Ti SUPER:
196.9 fps
NVIDIA GeForce RTX 4070 Ti SUPER:
195.9 fps
NVIDIA GeForce RTX 4070 Ti SUPER:
172.3 fps
NVIDIA GeForce RTX 4070 Ti SUPER:
157.5 fps
NVIDIA GeForce RTX 4070 Ti SUPER:
103.6 fps
NVIDIA GeForce RTX 4070 Ti SUPER:
49.7 fps
T600 Laptop GPU:
104.1 fps
NVIDIA GeForce RTX 4070 Ti SUPER:
213 fps
NVIDIA GeForce RTX 4070 Ti SUPER:
162.2 fps
NVIDIA GeForce RTX 4070 Ti SUPER:
121.5 fps
NVIDIA GeForce RTX 4070 Ti SUPER:
63.7 fps
T600 Laptop GPU:
175.4 fps
469%
NVIDIA GeForce RTX 4070 Ti SUPER:
209 fps
897%
NVIDIA GeForce RTX 4070 Ti SUPER:
191 fps
2670%
NVIDIA GeForce RTX 4070 Ti SUPER:
169 fps
NVIDIA GeForce RTX 4070 Ti SUPER:
154 fps
NVIDIA GeForce RTX 4070 Ti SUPER:
91 fps
T600 Laptop GPU:
113.6 fps
NVIDIA GeForce RTX 4070 Ti SUPER:
171.2 fps
NVIDIA GeForce RTX 4070 Ti SUPER:
159.3 fps
NVIDIA GeForce RTX 4070 Ti SUPER:
144.2 fps
NVIDIA GeForce RTX 4070 Ti SUPER:
115.9 fps
NVIDIA GeForce RTX 4070 Ti SUPER:
68.6 fps
NVIDIA GeForce RTX 4070 Ti SUPER:
239 fps
NVIDIA GeForce RTX 4070 Ti SUPER:
231 fps
NVIDIA GeForce RTX 4070 Ti SUPER:
181 fps
NVIDIA GeForce RTX 4070 Ti SUPER:
96.6 fps
457%
NVIDIA GeForce RTX 4070 Ti SUPER:
192.1 fps
662%
NVIDIA GeForce RTX 4070 Ti SUPER:
176.8 fps
852%
NVIDIA GeForce RTX 4070 Ti SUPER:
169.6 fps
1072%
NVIDIA GeForce RTX 4070 Ti SUPER:
143.6 fps
1433%
NVIDIA GeForce RTX 4070 Ti SUPER:
79.4 fps
NVIDIA GeForce RTX 4070 Ti SUPER:
226 fps
NVIDIA GeForce RTX 4070 Ti SUPER:
196.9 fps
NVIDIA GeForce RTX 4070 Ti SUPER:
130.3 fps
NVIDIA GeForce RTX 4070 Ti SUPER:
66.4 fps
NVIDIA GeForce RTX 4070 Ti SUPER:
78.9 fps
694%
NVIDIA GeForce RTX 4070 Ti SUPER:
236 fps
806%
NVIDIA GeForce RTX 4070 Ti SUPER:
193.5 fps
816%
NVIDIA GeForce RTX 4070 Ti SUPER:
158.3 fps
884%
NVIDIA GeForce RTX 4070 Ti SUPER:
130.9 fps
996%
NVIDIA GeForce RTX 4070 Ti SUPER:
84.4 fps
NVIDIA GeForce RTX 4070 Ti SUPER:
273 fps
NVIDIA GeForce RTX 4070 Ti SUPER:
269 fps
NVIDIA GeForce RTX 4070 Ti SUPER:
256 fps
NVIDIA GeForce RTX 4070 Ti SUPER:
205 fps
NVIDIA GeForce RTX 4070 Ti SUPER:
109.5 fps
326%
NVIDIA GeForce RTX 4070 Ti SUPER:
568 fps
109%
T600 Laptop GPU:
190.4 fps
720%
NVIDIA GeForce RTX 4070 Ti SUPER:
467 fps
117%
T600 Laptop GPU:
76.2 fps
860%
NVIDIA GeForce RTX 4070 Ti SUPER:
442 fps
118%
T600 Laptop GPU:
60.7 fps
908%
NVIDIA GeForce RTX 4070 Ti SUPER:
407 fps
118%
T600 Laptop GPU:
52.7 fps
959%
NVIDIA GeForce RTX 4070 Ti SUPER:
306 fps
904%
NVIDIA GeForce RTX 4070 Ti SUPER:
161.9 fps
111%
T600 Laptop GPU:
105 fps
441%
NVIDIA GeForce RTX 4070 Ti SUPER:
203 fps
115%
T600 Laptop GPU:
53 fps
469%
NVIDIA GeForce RTX 4070 Ti SUPER:
197 fps
117%
T600 Laptop GPU:
49 fps
482%
NVIDIA GeForce RTX 4070 Ti SUPER:
188 fps
115%
T600 Laptop GPU:
45 fps
719%
NVIDIA GeForce RTX 4070 Ti SUPER:
187 fps
992%
NVIDIA GeForce RTX 4070 Ti SUPER:
119 fps
169%
NVIDIA GeForce RTX 4070 Ti SUPER:
224 fps
81%
T600 Laptop GPU:
107.9 fps
184%
NVIDIA GeForce RTX 4070 Ti SUPER:
196.7 fps
86%
T600 Laptop GPU:
92.4 fps
156%
NVIDIA GeForce RTX 4070 Ti SUPER:
150 fps
80%
T600 Laptop GPU:
77 fps
313%
NVIDIA GeForce RTX 4070 Ti SUPER:
127.8 fps
332%
NVIDIA GeForce RTX 4070 Ti SUPER:
235 fps
122%
T600 Laptop GPU:
86 fps
673%
NVIDIA GeForce RTX 4070 Ti SUPER:
235 fps
126%
T600 Laptop GPU:
43.9 fps
833%
NVIDIA GeForce RTX 4070 Ti SUPER:
209 fps
124%
T600 Laptop GPU:
31 fps
948%
NVIDIA GeForce RTX 4070 Ti SUPER:
168.8 fps
991%
NVIDIA GeForce RTX 4070 Ti SUPER:
98.9 fps
150%
NVIDIA GeForce RTX 4070 Ti SUPER:
245 fps
92%
T600 Laptop GPU:
149.4 fps
153%
NVIDIA GeForce RTX 4070 Ti SUPER:
228 fps
86%
T600 Laptop GPU:
127.6 fps
187%
NVIDIA GeForce RTX 4070 Ti SUPER:
226 fps
96%
T600 Laptop GPU:
115.8 fps
183%
NVIDIA GeForce RTX 4070 Ti SUPER:
202 fps
97%
T600 Laptop GPU:
107.1 fps
513%
NVIDIA GeForce RTX 4070 Ti SUPER:
203 fps
114%
T600 Laptop GPU:
158.6 fps
674%
NVIDIA GeForce RTX 4070 Ti SUPER:
558 fps
112%
T600 Laptop GPU:
92.7 fps
905%
NVIDIA GeForce RTX 4070 Ti SUPER:
430 fps
110%
T600 Laptop GPU:
52.2 fps
772%
NVIDIA GeForce RTX 4070 Ti SUPER:
210 fps
101%
T600 Laptop GPU:
27.6 fps
NVIDIA GeForce RTX 4070 Ti SUPER:
159.3 fps
103%
NVIDIA GeForce RTX 4070 Ti SUPER:
187.6 fps
79%
T600 Laptop GPU:
142.6 fps
107%
NVIDIA GeForce RTX 4070 Ti SUPER:
187.6 fps
78%
T600 Laptop GPU:
137.6 fps
233%
NVIDIA GeForce RTX 4070 Ti SUPER:
187.4 fps
102%
T600 Laptop GPU:
82.3 fps
419%
NVIDIA GeForce RTX 4070 Ti SUPER:
160.1 fps
115%
T600 Laptop GPU:
44.1 fps
584%
NVIDIA GeForce RTX 4070 Ti SUPER:
155.3 fps
728%
NVIDIA GeForce RTX 4070 Ti SUPER:
182.1 fps
Average Gaming NVIDIA T600 → 100% Average Gaming 30-70 fps → 100%
Average Gaming NVIDIA GeForce RTX 4070 Ti SUPER → 655% Average Gaming NVIDIA T600 Laptop GPU → 105% Average Gaming 30-70 fps → 118%
 Deutsch
 English
 Español
 Français
 Italiano
 Nederlands
 Polski
 Português
 Русский
 Türkçe
 Svenska
 Chinese
 Magyar