NVIDIA T600 vs NVIDIA GeForce RTX 4070 SUPER
NVIDIA T600 ► remove from comparison
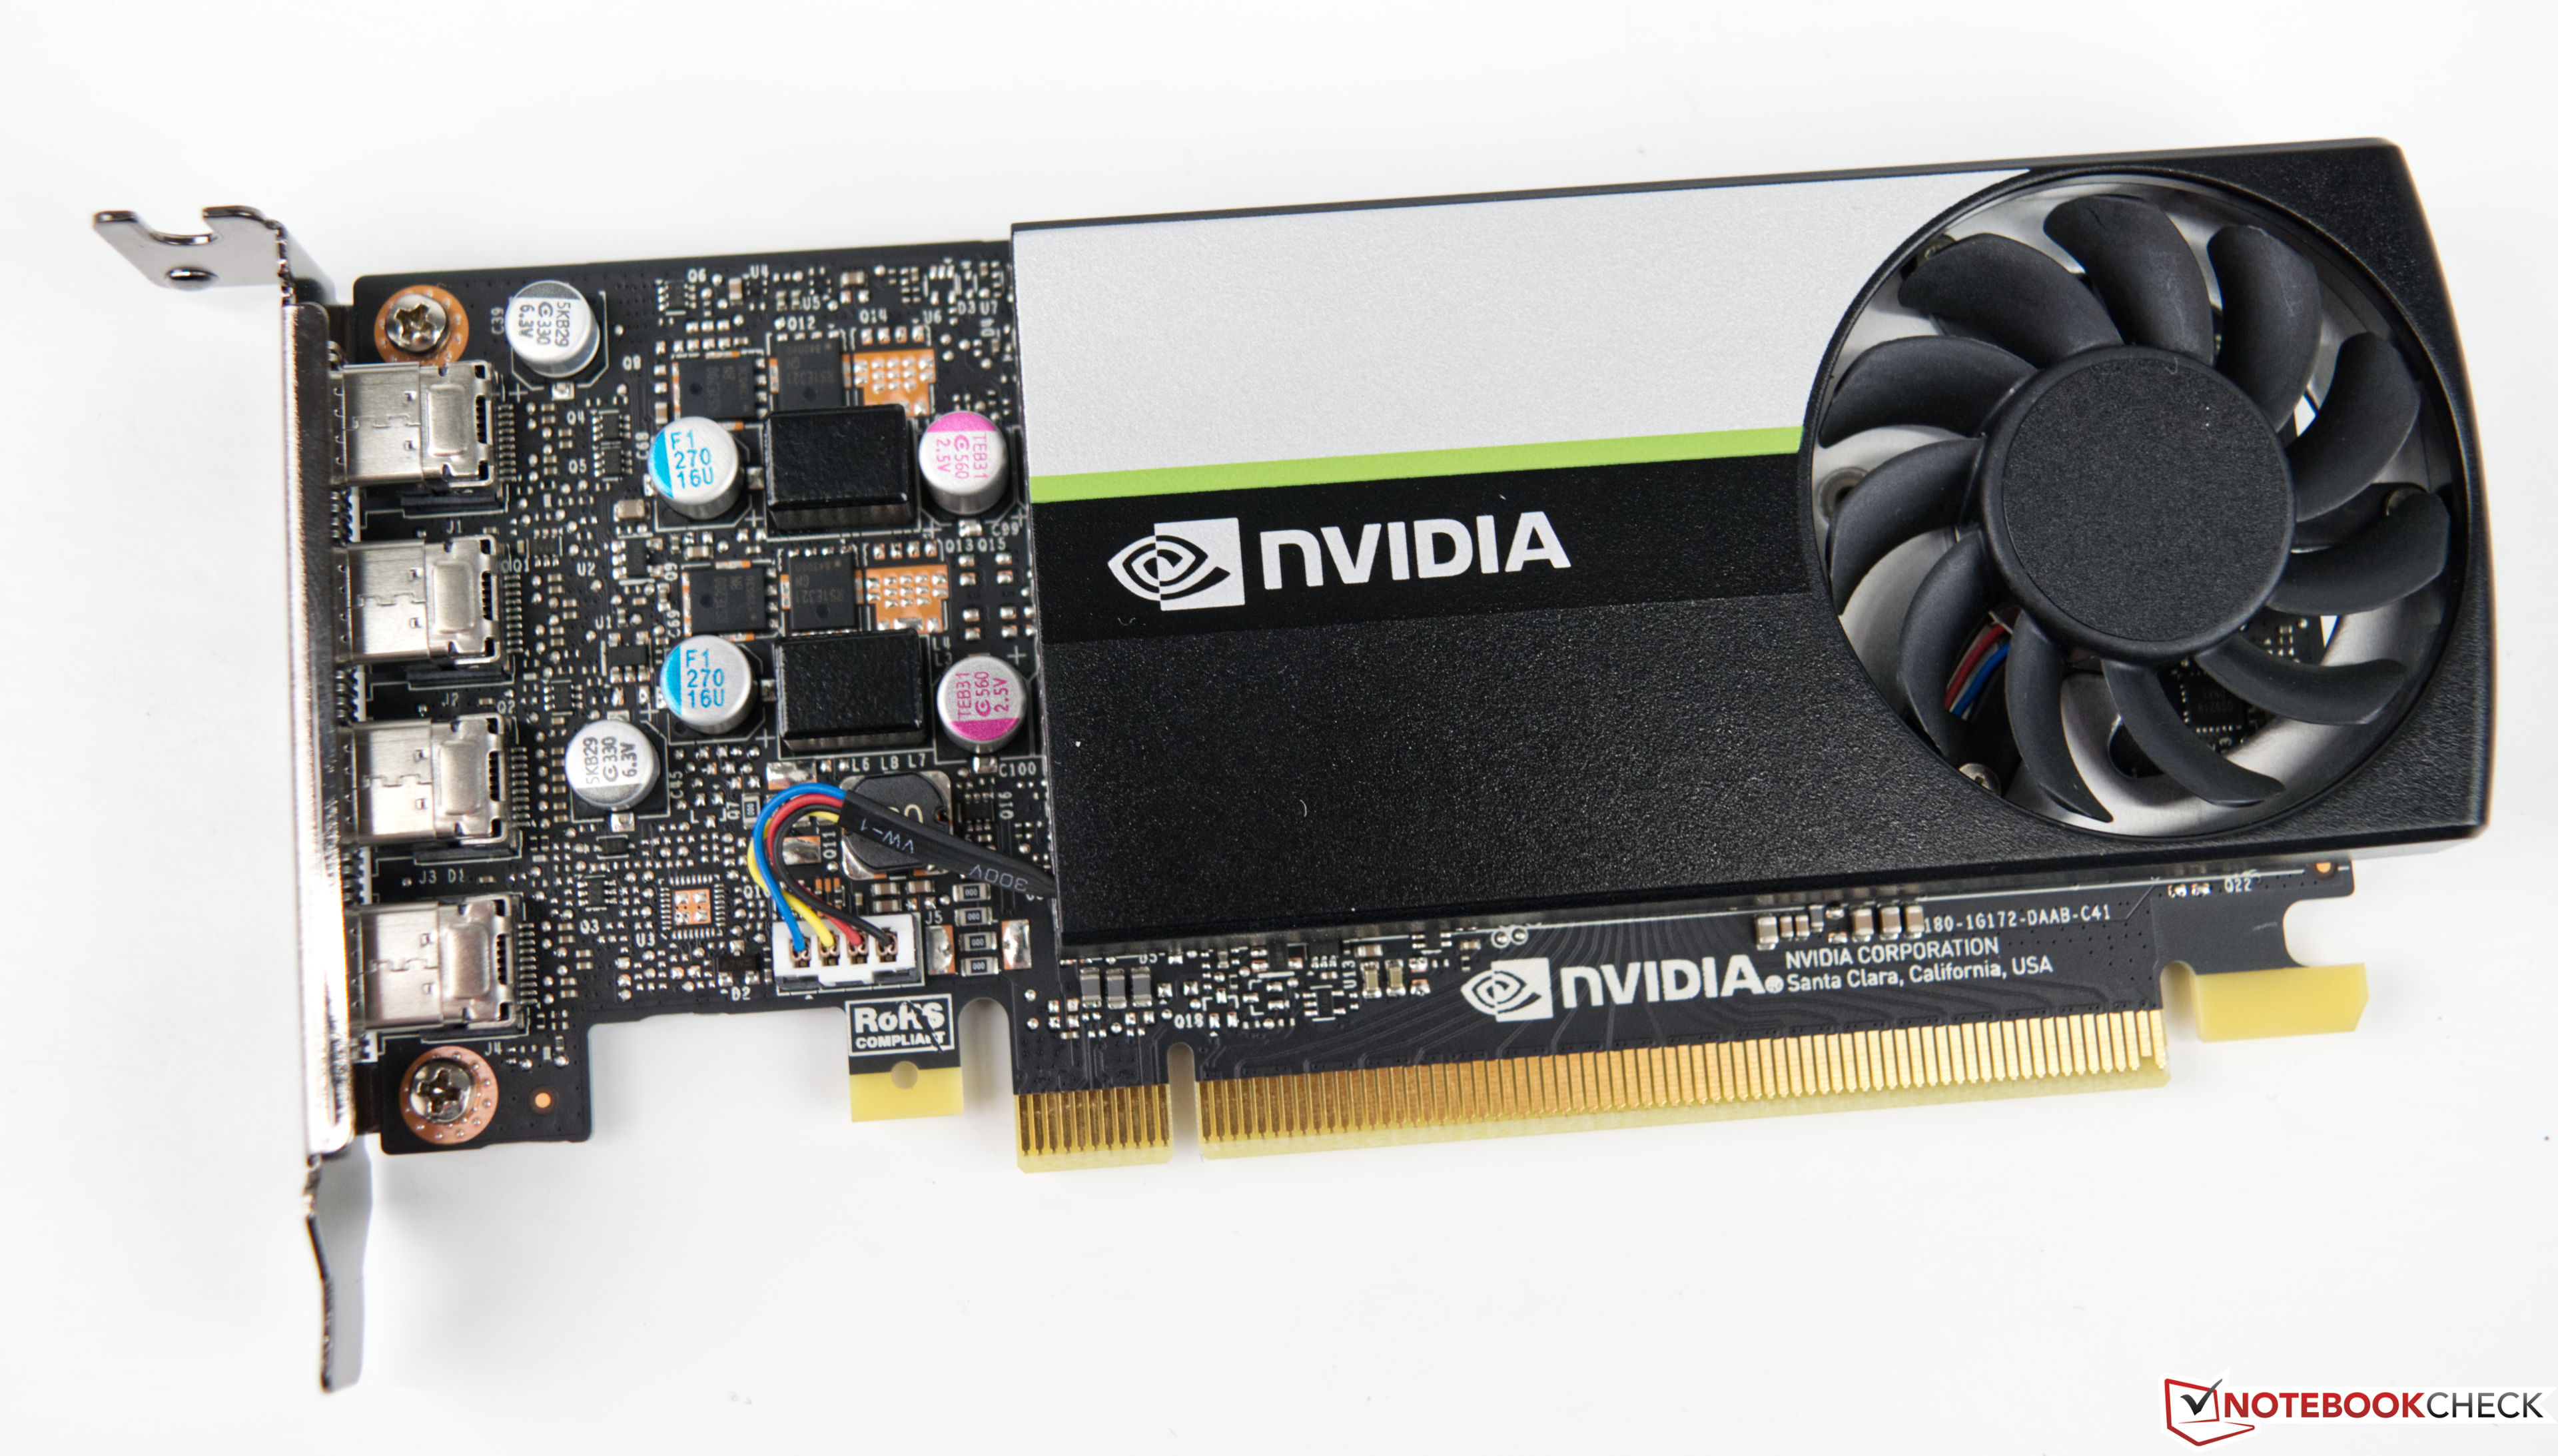
The Nvidia T600 Desktop GPU is a professional graphics card for workstations that is based on the Turing architecture (TU117 chip). The desktop version only offers 640 of the 1024 cores and therefore also less than the T600 mobile (896 CUDA cores). The card offers 4 GB GDDR6 graphics memory connected with a 128 bit bus (up to 160 GB/s bandwidth). The T600 supports certified drivers (former Quadro line) for professional applications like CAD, 3D modelling, DCC, medicine, or visualization applications.
The maximum power consumption of the card is rated at 40W.
NVIDIA GeForce RTX 4070 SUPER ► remove from comparison
The Nvidia GeForce RTX 4070 SUPER is a high-end desktop graphics card based on the Ada Lovelace architecture. It uses the AD104 chip and offers 7,168 cores and 12 GB GDDR6X graphics memory (192-bit bus with 21 Gbits).
The performance of the RTX 4070S lies between the older RTX 4070 and RTX 4070 Ti in the top class of high-end GPUs in 2024. Compared to AMD GPUs, the 4070 Super is similar fast as the AMD Radeon RX 7800 XT . This makes the GPU best suited for QHD and maximum details of demanding games (such as Avatar Frontiers of Pandora, Allan Wake 2, Cyberpunk 2033 or F1 23). Less demanding games can also be played smoothly in 4K (AC Mirage, Cod MW 3, ...).
The AD104 chip is produced at TSMC in 5 nm (4N with EUV) and is specified with a TGP (Total Graphics Power) of 200 watts.
NVIDIA T600 NVIDIA GeForce RTX 4070 SUPER GeForce RTX 4000 Series Architecture Turing Ada Lovelace Pipelines 640 - unified 7168 - unified TMUs 40 224 ROPs 32 80 Core Speed 735 - 1335 (Boost) MHz 1980 - 2475 (Boost) MHz Memory Speed 10000 effective = 1250 MHz 21000 effective = 1313 MHz Memory Bus Width 128 Bit 192 Bit Memory Type GDDR6 GDDR6X Max. Amount of Memory 4 GB 12 GB Shared Memory no no Memory Bandwidth 160 GB/s 504.2 GB/s API DirectX 12_1, Shader 6.6, OpenGL 4.6, OpenCL 3.0, Vulkan 1.3 DirectX 12 Ultimate, Shader 6.7, OpenGL 4.6, OpenCL 3.0, Vulkan 1.3 Power Consumption 40 Watt 220 Watt Transistors 4.7 Billion 35.8 Billion Die Size 200 mm² 295 mm² technology 12 nm 5 nm PCIe 3.0 x16 4.0 x16 Displays 4 Displays (max.), DisplayPort 4x mini-DisplayPort 1.4a 4 Displays (max.), HDMI 2.1, DisplayPort 1.4a Date of Announcement 12.04.2021 17.01.2024 Codename AD104 Raytracing Cores 56 Tensor / AI Cores 224 Theoretical Performance 35.5 TFLOPS FP16, 35.5 TFLOPS FP32, 0.55 TFLOPS FP64 Cache L2: 48 MB Predecessor NVIDIA GeForce RTX 4070
Benchmarks Performance Rating - 3DMark 11 + Fire Strike + Time Spy - T600
3 pt (9%)
...
...
Performance Rating - 3DMark 11 + Fire Strike + Time Spy - NVIDIA GeForce RTX 4070 SUPER
22.3 pt (67%)
...
NVIDIA GeForce RTX 4070 SUPER
...
3DMark - 3DMark Time Spy Score
2496 Points (7%)
min: 21080 avg: 21186 median: 21186 (61%) max: 21292 Points
3DMark - 3DMark Time Spy Graphics
2195 Points (6%)
min: 20867 avg: 20992 median: 20992 (56%) max: 21117 Points
3DMark - 3DMark Ice Storm Unlimited Graphics
304731 Points (35%)
min: 763636 avg: 766679 median: 766678 (87%) max: 769721 Points
3DMark - 3DMark Ice Storm Extreme Graphics
152912 Points (20%)
min: 515758 avg: 517177 median: 517176 (66%) max: 518595 Points
3DMark - 3DMark Cloud Gate Score
31922 Points (34%)
min: 81504 avg: 81898 median: 81897.5 (88%) max: 82291 Points
3DMark - 3DMark Cloud Gate Graphics
40917 Points (11%)
min: 170014 avg: 171098 median: 171098 (45%) max: 172182 Points
3DMark - 3DMark Fire Strike Standard Score
6284 Points (11%)
min: 39061 avg: 40120 median: 40119.5 (71%) max: 41178 Points
3DMark - 3DMark Fire Strike Standard Graphics
6552 Points (7%)
min: 48043 avg: 48876 median: 48876 (55%) max: 49709 Points
3DMark - 3DMark Ice Storm Graphics
182459 Points (22%)
min: 559629 avg: 564567 median: 564567 (68%) max: 569505 Points
3DMark - 3DMark Wild Life Unlimited
min: 134699 avg: 135490 median: 135490 (68%) max: 136280 Points
3DMark - 3DMark Wild Life Extreme Unlimited
min: 41082 avg: 41368 median: 41368 (48%) max: 41654 Points
3DMark - 3DMark Night Raid
min: 89236 avg: 89795 median: 89795 (85%) max: 90354 Points
3DMark - 3DMark Night Raid Graphics Score
min: 195290 avg: 198557 median: 198556 (76%) max: 201823 Points
3DMark 11 - 3DM11 Performance Score
9497 Points (13%)
min: 51107 avg: 51340 median: 51339.5 (71%) max: 51572 Points
3DMark 11 - 3DM11 Performance GPU
8694 Points (7%)
min: 67852 avg: 68373 median: 68373 (59%) max: 68894 Points
3DMark Vantage + NVIDIA T600 3DMark Vantage - 3DM Vant. Perf. total
344838 Points (100%)
3DM Vant. Perf. GPU no PhysX + NVIDIA T600 3DMark Vantage - 3DM Vant. Perf. GPU no PhysX
30400 Points (17%)
3DMark 05 - 3DMark 05 - Standard
46380 Points (51%)
3DMark 06 3DMark 06 - Standard 1280x1024 + NVIDIA T600
43997 Points (57%)
Unigine Valley 1.0 - Unigine Valley 1.0 DX
32.7 fps (11%)
min: 213.8 avg: 214.6 median: 214.6 (70%) max: 215.3 fps
Blender - Blender 3.3 Classroom CUDA *
19 Seconds (3%)
Blender - Blender 3.3 Classroom OPTIX *
11 Seconds (4%)
SPECviewperf 12 + NVIDIA T600 SPECviewperf 12 - specvp12 sw-03
115 fps (29%)
specvp12 snx-02 + NVIDIA T600 SPECviewperf 12 - specvp12 snx-02
68.6 fps (10%)
specvp12 showcase-01 + NVIDIA T600 SPECviewperf 12 - specvp12 showcase-01
35.3 fps (8%)
specvp12 mediacal-01 + NVIDIA T600 SPECviewperf 12 - specvp12 mediacal-01
19.5 fps (5%)
specvp12 maya-04 + NVIDIA T600 SPECviewperf 12 - specvp12 maya-04
67.4 fps (18%)
specvp12 energy-01 + NVIDIA T600 SPECviewperf 12 - specvp12 energy-01
5 fps (4%)
specvp12 creo-01 + NVIDIA T600 SPECviewperf 12 - specvp12 creo-01
78.5 fps (31%)
specvp12 catia-04 + NVIDIA T600 SPECviewperf 12 - specvp12 catia-04
76.9 fps (13%)
specvp12 3dsmax-05 + NVIDIA T600 SPECviewperf 12 - specvp12 3dsmax-05
80 fps (14%)
SPECviewperf 13 specvp13 sw-04 + NVIDIA T600 SPECviewperf 13 - specvp13 sw-04
114 fps (31%)
specvp13 snx-03 + NVIDIA T600 SPECviewperf 13 - specvp13 snx-03
122 fps (14%)
specvp13 showcase-02 + NVIDIA T600 SPECviewperf 13 - specvp13 showcase-02
34.9 fps (8%)
specvp13 medical-02 + NVIDIA T600 SPECviewperf 13 - specvp13 medical-02
35.7 fps (7%)
specvp13 maya-05 + NVIDIA T600 SPECviewperf 13 - specvp13 maya-05
99.8 fps (11%)
specvp13 energy-02 + NVIDIA T600 SPECviewperf 13 - specvp13 energy-02
12.6 fps (4%)
specvp13 creo-02 + NVIDIA T600 SPECviewperf 13 - specvp13 creo-02
98 fps (14%)
specvp13 3dsmax-06 + NVIDIA T600 SPECviewperf 13 - specvp13 3dsmax-06
79.9 fps (14%)
SPECviewperf 2020 specvp2020 solidworks-05 4k + NVIDIA T600 SPECviewperf 2020 - specvp2020 solidworks-05 4k
16.9 fps (5%)
specvp2020 snx-04 4k + NVIDIA T600 SPECviewperf 2020 - specvp2020 snx-04 4k
75.6 fps (8%)
specvp2020 medical-03 4k + NVIDIA T600 SPECviewperf 2020 - specvp2020 medical-03 4k
4.5 fps (4%)
specvp2020 maya-06 4k + NVIDIA T600 SPECviewperf 2020 - specvp2020 maya-06 4k
46.1 fps (8%)
specvp2020 energy-03 4k + NVIDIA T600 SPECviewperf 2020 - specvp2020 energy-03 4k
6.7 fps (1%)
specvp2020 creo-03 4k + NVIDIA T600 SPECviewperf 2020 - specvp2020 creo-03 4k
32.3 fps (15%)
specvp2020 catia-06 4k + NVIDIA T600 SPECviewperf 2020 - specvp2020 catia-06 4k
13.8 fps (9%)
specvp2020 3dsmax-07 4k + NVIDIA T600 SPECviewperf 2020 - specvp2020 3dsmax-07 4k
19.4 fps (8%)
Cinebench R10 Cinebench R10 Shading (32bit) + NVIDIA T600 Cinebench R10 - Cinebench R10 Shading (32bit)
6830 Points (5%)
Cinebench R11.5 Cinebench R11.5 OpenGL 64 Bit + NVIDIA T600 Cinebench R11.5 - Cinebench R11.5 OpenGL 64 Bit
104.1 fps (36%)
Cinebench R15 + NVIDIA T600 Cinebench R15 - Cinebench R15 OpenGL 64 Bit
227.1 fps (13%)
Cinebench R15 OpenGL Ref. Match 64 Bit + NVIDIA T600 Cinebench R15 - Cinebench R15 OpenGL Ref. Match 64 Bit
99.6 % (100%)
LuxMark v2.0 64Bit - LuxMark v2.0 Room GPU
1121 Samples/s (5%)
min: 8257 avg: 8260 median: 8259.5 (37%) max: 8262 Samples/s
LuxMark v2.0 64Bit - LuxMark v2.0 Sala GPU
2049 Samples/s (4%)
min: 19072 avg: 19102 median: 19101.5 (33%) max: 19131 Samples/s
ComputeMark v2.1 - ComputeMark v2.1 Result
4825 Points (5%)
min: 47808 avg: 47986 median: 47985.5 (52%) max: 48163 Points
Power Consumption - Furmark Stress Test Power Consumption - external Monitor *
76.7 Watt (11%)
min: 333 avg: 359 median: 345 (49%) max: 413 Watt
Power Consumption - The Witcher 3 Power Consumption - external Monitor *
83.5 Watt (12%)
min: 372 avg: 381.3 median: 382.5 (53%) max: 388 Watt
Power Consumption - Witcher 3 ultra Power Efficiency - external Monitor
0.3 fps per Watt (27%)
min: 0.509 avg: 0.5 median: 0.5 (43%) max: 0.541 fps per Watt
Average Benchmarks NVIDIA T600 → 100% n=15 Average Benchmarks NVIDIA GeForce RTX 4070 SUPER → 627% n=15
- Range of benchmark values for this graphics card
- Average benchmark values for this graphics card
* Smaller numbers mean a higher performance
1 This benchmark is not used for the average calculation
Game Benchmarks The following benchmarks stem from our benchmarks of review laptops. The performance depends on the used graphics memory, clock rate, processor, system settings, drivers, and operating systems. So the results don't have to be representative for all laptops with this GPU. For detailed information on the benchmark results, click on the fps number.
NVIDIA GeForce RTX 4070 SUPER:
137.4 fps
NVIDIA GeForce RTX 4070 SUPER:
122.1 129.9 ~ 126 fps
NVIDIA GeForce RTX 4070 SUPER:
96.2 101.2 ~ 99 fps
NVIDIA GeForce RTX 4070 SUPER:
61.5 67.6 ~ 65 fps
NVIDIA GeForce RTX 4070 SUPER:
33.9 34.6 ~ 34 fps
NVIDIA GeForce RTX 4070 SUPER:
56.6 60.5 ~ 59 fps
NVIDIA GeForce RTX 4070 SUPER:
226 fps
NVIDIA GeForce RTX 4070 SUPER:
179 184 ~ 182 fps
NVIDIA GeForce RTX 4070 SUPER:
165 166 ~ 166 fps
NVIDIA GeForce RTX 4070 SUPER:
118 120 ~ 119 fps
NVIDIA GeForce RTX 4070 SUPER:
70 71 ~ 71 fps
NVIDIA GeForce RTX 4070 SUPER:
99 100 ~ 100 fps
NVIDIA GeForce RTX 4070 SUPER:
112.8 fps
NVIDIA GeForce RTX 4070 SUPER:
105.1 114.1 ~ 110 fps
NVIDIA GeForce RTX 4070 SUPER:
73.8 79.7 ~ 77 fps
NVIDIA GeForce RTX 4070 SUPER:
40 42.7 ~ 41 fps
NVIDIA GeForce RTX 4070 SUPER:
28.9 44.2 ~ 37 fps
NVIDIA GeForce RTX 4070 SUPER:
205 fps
NVIDIA GeForce RTX 4070 SUPER:
193 204 ~ 199 fps
NVIDIA GeForce RTX 4070 SUPER:
157 169 ~ 163 fps
NVIDIA GeForce RTX 4070 SUPER:
121 130 ~ 126 fps
NVIDIA GeForce RTX 4070 SUPER:
72 77 ~ 75 fps
NVIDIA GeForce RTX 4070 SUPER:
99 106 ~ 103 fps
NVIDIA GeForce RTX 4070 SUPER:
186 fps
NVIDIA GeForce RTX 4070 SUPER:
181.8 fps
NVIDIA GeForce RTX 4070 SUPER:
156.3 162.1 ~ 159 fps
NVIDIA GeForce RTX 4070 SUPER:
136.2 141.9 ~ 139 fps
NVIDIA GeForce RTX 4070 SUPER:
83.8 89.6 ~ 87 fps
NVIDIA GeForce RTX 4070 SUPER:
38.4 38.9 ~ 39 fps
NVIDIA GeForce RTX 4070 SUPER:
228 fps
NVIDIA GeForce RTX 4070 SUPER:
198.8 203 ~ 201 fps
NVIDIA GeForce RTX 4070 SUPER:
194.3 203 ~ 199 fps
NVIDIA GeForce RTX 4070 SUPER:
140.3 142.7 ~ 142 fps
NVIDIA GeForce RTX 4070 SUPER:
71.6 71.7 ~ 72 fps
NVIDIA GeForce RTX 4070 SUPER:
115.4 119.7 ~ 118 fps
NVIDIA GeForce RTX 4070 SUPER:
380 381 ~ 381 fps
NVIDIA GeForce RTX 4070 SUPER:
398 406 ~ 402 fps
NVIDIA GeForce RTX 4070 SUPER:
344 357 ~ 351 fps
NVIDIA GeForce RTX 4070 SUPER:
122.4 125.9 ~ 124 fps
NVIDIA GeForce RTX 4070 SUPER:
78 81.2 ~ 80 fps
NVIDIA GeForce RTX 4070 SUPER:
39 40.7 ~ 40 fps
NVIDIA GeForce RTX 4070 SUPER:
66.8 69.7 ~ 68 fps
NVIDIA GeForce RTX 4070 SUPER:
208 fps
NVIDIA GeForce RTX 4070 SUPER:
201.7 216.1 ~ 209 fps
NVIDIA GeForce RTX 4070 SUPER:
149.6 155.7 ~ 153 fps
NVIDIA GeForce RTX 4070 SUPER:
118 123.8 ~ 121 fps
NVIDIA GeForce RTX 4070 SUPER:
73.6 78 ~ 76 fps
NVIDIA GeForce RTX 4070 SUPER:
363 381 ~ 372 fps
NVIDIA GeForce RTX 4070 SUPER:
386 403 ~ 395 fps
NVIDIA GeForce RTX 4070 SUPER:
321 340 ~ 331 fps
NVIDIA GeForce RTX 4070 SUPER:
128.7 136.3 ~ 133 fps
NVIDIA GeForce RTX 4070 SUPER:
83.1 88.8 ~ 86 fps
NVIDIA GeForce RTX 4070 SUPER:
41.9 44.6 ~ 43 fps
NVIDIA GeForce RTX 4070 SUPER:
285 fps
NVIDIA GeForce RTX 4070 SUPER:
279 284 ~ 282 fps
NVIDIA GeForce RTX 4070 SUPER:
278 291 ~ 285 fps
NVIDIA GeForce RTX 4070 SUPER:
189.6 194.8 ~ 192 fps
NVIDIA GeForce RTX 4070 SUPER:
87.5 92.7 ~ 90 fps
NVIDIA GeForce RTX 4070 SUPER:
195.7 fps
NVIDIA GeForce RTX 4070 SUPER:
184.1 fps
NVIDIA GeForce RTX 4070 SUPER:
156.5 161.8 ~ 159 fps
NVIDIA GeForce RTX 4070 SUPER:
141 146 ~ 144 fps
NVIDIA GeForce RTX 4070 SUPER:
91.3 92.8 ~ 92 fps
NVIDIA GeForce RTX 4070 SUPER:
43.5 44.9 ~ 44 fps
NVIDIA GeForce RTX 4070 SUPER:
201 fps
NVIDIA GeForce RTX 4070 SUPER:
150.5 157 ~ 154 fps
NVIDIA GeForce RTX 4070 SUPER:
108 109.7 ~ 109 fps
NVIDIA GeForce RTX 4070 SUPER:
52.8 54.5 ~ 54 fps
462%
NVIDIA GeForce RTX 4070 SUPER:
206 fps
883%
NVIDIA GeForce RTX 4070 SUPER:
181.8 193.7 ~ 188 fps
NVIDIA GeForce RTX 4070 SUPER:
139.4 145.9 ~ 143 fps
NVIDIA GeForce RTX 4070 SUPER:
79 82.7 ~ 81 fps
NVIDIA GeForce RTX 4070 SUPER:
169.2 fps
NVIDIA GeForce RTX 4070 SUPER:
159.1 fps
NVIDIA GeForce RTX 4070 SUPER:
135.5 142.3 ~ 139 fps
NVIDIA GeForce RTX 4070 SUPER:
106 109.2 ~ 108 fps
NVIDIA GeForce RTX 4070 SUPER:
61.4 63.4 ~ 62 fps
NVIDIA GeForce RTX 4070 SUPER:
233 fps
NVIDIA GeForce RTX 4070 SUPER:
216 226 ~ 221 fps
NVIDIA GeForce RTX 4070 SUPER:
156.8 161.5 ~ 159 fps
NVIDIA GeForce RTX 4070 SUPER:
80.5 83.2 ~ 82 fps
461%
NVIDIA GeForce RTX 4070 SUPER:
193.6 fps
682%
NVIDIA GeForce RTX 4070 SUPER:
179.3 184.2 ~ 182 fps
829%
NVIDIA GeForce RTX 4070 SUPER:
163.4 166.6 ~ 165 fps
955%
NVIDIA GeForce RTX 4070 SUPER:
125.4 131.2 ~ 128 fps
1227%
NVIDIA GeForce RTX 4070 SUPER:
66.2 68.9 ~ 68 fps
NVIDIA GeForce RTX 4070 SUPER:
224 fps
NVIDIA GeForce RTX 4070 SUPER:
172.7 180.1 ~ 176 fps
NVIDIA GeForce RTX 4070 SUPER:
112.6 115.5 ~ 114 fps
NVIDIA GeForce RTX 4070 SUPER:
57.4 58.2 ~ 58 fps
NVIDIA GeForce RTX 4070 SUPER:
67.1 69 ~ 68 fps
358%
NVIDIA GeForce RTX 4070 SUPER:
267 fps
659%
NVIDIA GeForce RTX 4070 SUPER:
224 fps
758%
NVIDIA GeForce RTX 4070 SUPER:
178.8 186.1 ~ 182 fps
763%
NVIDIA GeForce RTX 4070 SUPER:
144.8 150.6 ~ 148 fps
797%
NVIDIA GeForce RTX 4070 SUPER:
116.1 120.8 ~ 118 fps
874%
NVIDIA GeForce RTX 4070 SUPER:
72.8 76.1 ~ 74 fps
NVIDIA GeForce RTX 4070 SUPER:
265 fps
NVIDIA GeForce RTX 4070 SUPER:
257 260 ~ 259 fps
NVIDIA GeForce RTX 4070 SUPER:
244 255 ~ 250 fps
NVIDIA GeForce RTX 4070 SUPER:
165.3 188 ~ 177 fps
NVIDIA GeForce RTX 4070 SUPER:
91.5 96.7 ~ 94 fps
336%
NVIDIA GeForce RTX 4070 SUPER:
570 601 ~ 586 fps
669%
NVIDIA GeForce RTX 4070 SUPER:
398 469 ~ 434 fps
833%
NVIDIA GeForce RTX 4070 SUPER:
418 437 ~ 428 fps
850%
NVIDIA GeForce RTX 4070 SUPER:
376 385 ~ 381 fps
831%
NVIDIA GeForce RTX 4070 SUPER:
260 270 ~ 265 fps
737%
NVIDIA GeForce RTX 4070 SUPER:
130 134.7 ~ 132 fps
441%
NVIDIA GeForce RTX 4070 SUPER:
203 fps
476%
NVIDIA GeForce RTX 4070 SUPER:
199 201 ~ 200 fps
487%
NVIDIA GeForce RTX 4070 SUPER:
188 191 ~ 190 fps
704%
NVIDIA GeForce RTX 4070 SUPER:
181 185 ~ 183 fps
858%
NVIDIA GeForce RTX 4070 SUPER:
101 104 ~ 103 fps
173%
NVIDIA GeForce RTX 4070 SUPER:
226 233 ~ 230 fps
183%
NVIDIA GeForce RTX 4070 SUPER:
196.3 196.4 ~ 196 fps
158%
NVIDIA GeForce RTX 4070 SUPER:
151.9 152.4 ~ 152 fps
319%
NVIDIA GeForce RTX 4070 SUPER:
129.1 131.7 ~ 130 fps
339%
NVIDIA GeForce RTX 4070 SUPER:
235 244 ~ 240 fps
673%
NVIDIA GeForce RTX 4070 SUPER:
234 235 ~ 235 fps
781%
NVIDIA GeForce RTX 4070 SUPER:
194 197.1 ~ 196 fps
837%
NVIDIA GeForce RTX 4070 SUPER:
148 150.5 ~ 149 fps
852%
NVIDIA GeForce RTX 4070 SUPER:
84.8 85.2 ~ 85 fps
152%
NVIDIA GeForce RTX 4070 SUPER:
244 250 ~ 247 fps
154%
NVIDIA GeForce RTX 4070 SUPER:
228 229 ~ 229 fps
184%
NVIDIA GeForce RTX 4070 SUPER:
221 223 ~ 222 fps
189%
NVIDIA GeForce RTX 4070 SUPER:
208 209 ~ 209 fps
497%
NVIDIA GeForce RTX 4070 SUPER:
192.9 202 ~ 197 fps
684%
NVIDIA GeForce RTX 4070 SUPER:
566 fps
867%
NVIDIA GeForce RTX 4070 SUPER:
406 418 ~ 412 fps
739%
NVIDIA GeForce RTX 4070 SUPER:
191.9 210 ~ 201 fps
NVIDIA GeForce RTX 4070 SUPER:
148.9 159.1 ~ 154 fps
826%
NVIDIA GeForce RTX 4070 SUPER:
129.4 136.7 ~ 133 fps
104%
NVIDIA GeForce RTX 4070 SUPER:
187.7 188.3 ~ 188 fps
107%
NVIDIA GeForce RTX 4070 SUPER:
187.6 187.9 ~ 188 fps
233%
NVIDIA GeForce RTX 4070 SUPER:
186.9 186.9 ~ 187 fps
416%
NVIDIA GeForce RTX 4070 SUPER:
158.8 160 ~ 159 fps
556%
NVIDIA GeForce RTX 4070 SUPER:
147.2 148.2 ~ 148 fps
664%
NVIDIA GeForce RTX 4070 SUPER:
164.6 166.6 ~ 166 fps
Average Gaming NVIDIA T600 → 100% Average Gaming 30-70 fps → 100%
Average Gaming NVIDIA GeForce RTX 4070 SUPER → 615% Average Gaming 30-70 fps → 1227%
 Deutsch
 English
 Español
 Français
 Italiano
 Nederlands
 Polski
 Português
 Русский
 Türkçe
 Svenska
 Chinese
 Magyar