NVIDIA T600 vs NVIDIA GeForce RTX 3070 Max-Q
NVIDIA T600 ► remove from comparison
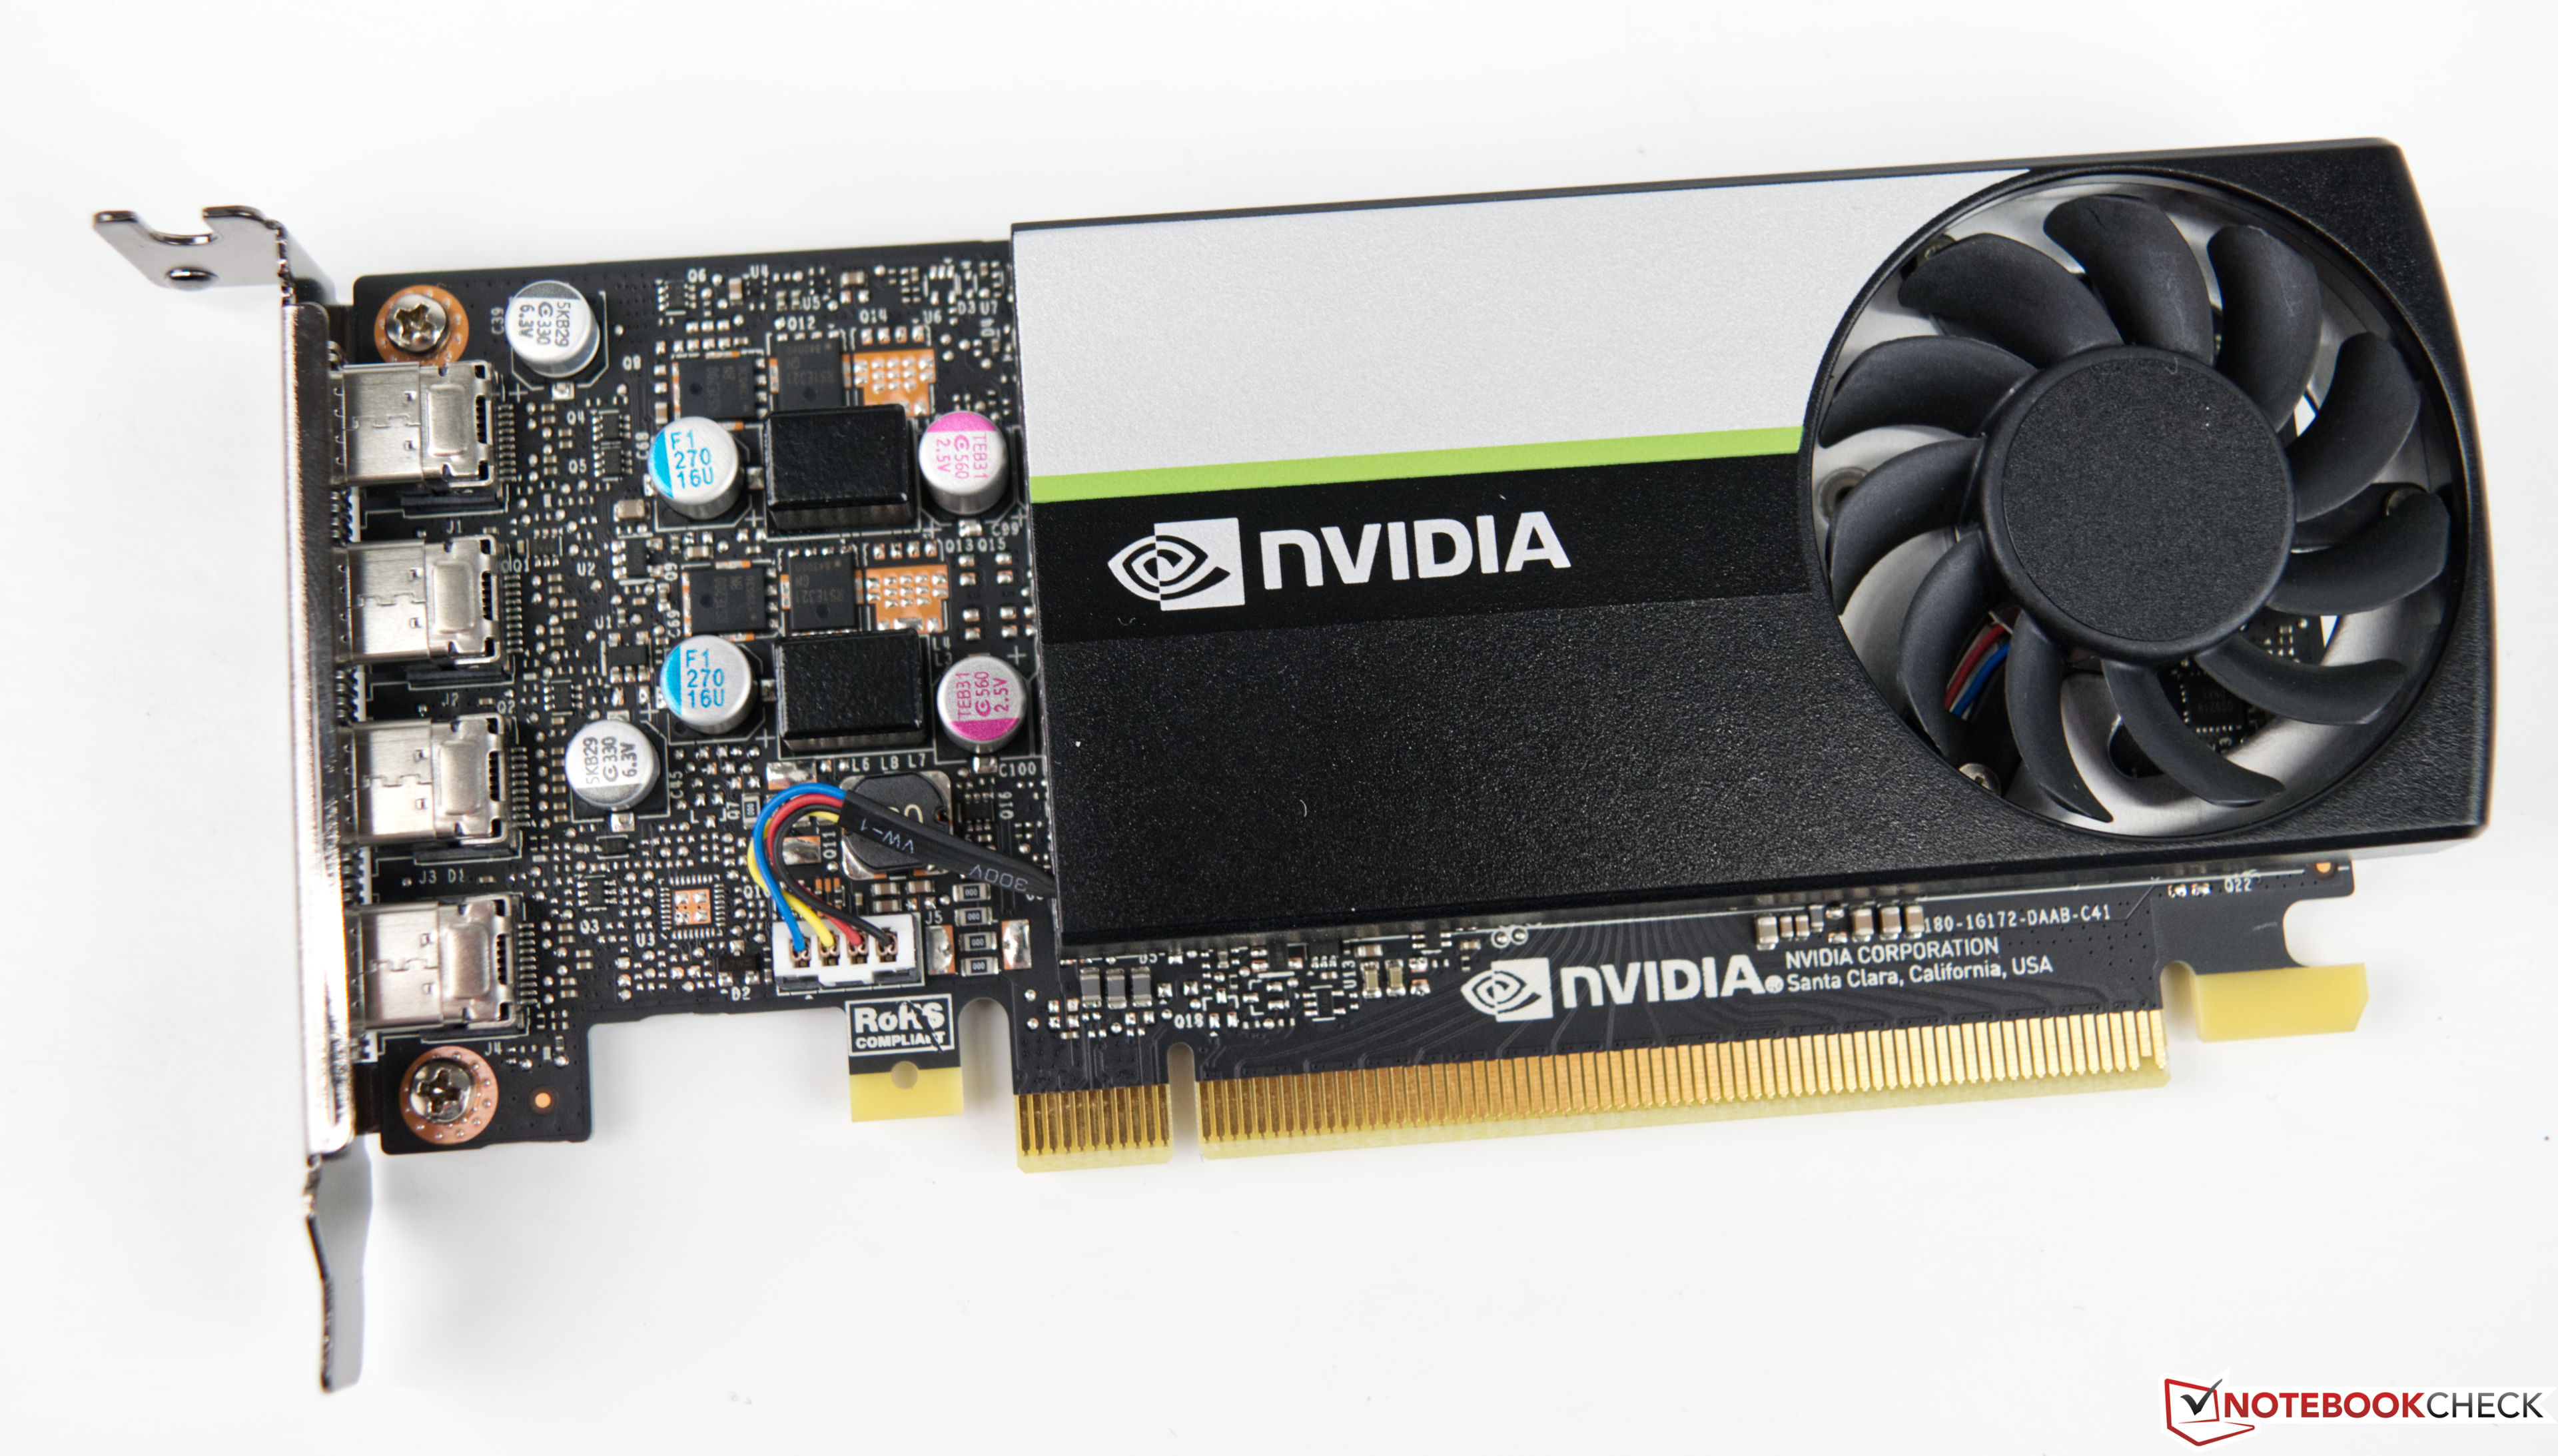
The Nvidia T600 Desktop GPU is a professional graphics card for workstations that is based on the Turing architecture (TU117 chip). The desktop version only offers 640 of the 1024 cores and therefore also less than the T600 mobile (896 CUDA cores). The card offers 4 GB GDDR6 graphics memory connected with a 128 bit bus (up to 160 GB/s bandwidth). The T600 supports certified drivers (former Quadro line) for professional applications like CAD, 3D modelling, DCC, medicine, or visualization applications.
The maximum power consumption of the card is rated at 40W.
NVIDIA GeForce RTX 3070 Max-Q ► remove from comparison
The Nvidia GeForce RTX 3070 Max-Q (for laptops, GN20-E5 Max-Q) is the former name for a RTX 3070 Laptop GPU with Max-Q technologies. In previous generations, the Max-Q name was used for low power versions. With the RTX 3000 series, every TGP-version can now use Max-Q technologies and all GPUs are called RTX 3070 Laptop GPU (80 - 125W).
NVIDIA T600 NVIDIA GeForce RTX 3070 Max-Q GeForce RTX 3000 Series Architecture Turing Ampere Pipelines 640 - unified 5120 - unified TMUs 40 ROPs 32 Core Speed 735 - 1335 (Boost) MHz 1290 (Boost) MHz Memory Speed 10000 effective = 1250 MHz Memory Bus Width 128 Bit 256 Bit Memory Type GDDR6 GDDR6 Max. Amount of Memory 4 GB 8 GB Shared Memory no no Memory Bandwidth 160 GB/s API DirectX 12_1, Shader 6.6, OpenGL 4.6, OpenCL 3.0, Vulkan 1.3 DirectX 12_2, Shader 6.7, OpenGL 4.6 Power Consumption 40 Watt 80 Watt Transistors 4.7 Billion Die Size 200 mm² technology 12 nm 8 nm PCIe 3.0 x16 Displays 4 Displays (max.), DisplayPort 4x mini-DisplayPort 1.4a Date of Announcement 12.04.2021 04.01.2021 Codename GN20-E5 GA104 Notebook Size large
Benchmarks Performance Rating - 3DMark 11 + Fire Strike + Time Spy - T600
3 pt (9%)
...
...
3DMark - 3DMark Time Spy Score
2496 Points (7%)
3DMark - 3DMark Time Spy Graphics
2195 Points (6%)
3DMark - 3DMark Ice Storm Unlimited Graphics
304731 Points (35%)
3DMark - 3DMark Ice Storm Extreme Graphics
152912 Points (20%)
3DMark - 3DMark Cloud Gate Score
31922 Points (34%)
3DMark - 3DMark Cloud Gate Graphics
40917 Points (11%)
3DMark - 3DMark Fire Strike Standard Score
6284 Points (11%)
3DMark - 3DMark Fire Strike Standard Graphics
6552 Points (7%)
3DMark - 3DMark Ice Storm Graphics
182459 Points (22%)
3DMark 11 - 3DM11 Performance Score
9497 Points (13%)
3DMark 11 - 3DM11 Performance GPU
8694 Points (7%)
3DMark Vantage + NVIDIA T600 3DMark Vantage - 3DM Vant. Perf. total
344838 Points (100%)
3DM Vant. Perf. GPU no PhysX + NVIDIA T600 3DMark Vantage - 3DM Vant. Perf. GPU no PhysX
30400 Points (17%)
3DMark 05 - 3DMark 05 - Standard
46380 Points (51%)
3DMark 06 3DMark 06 - Standard 1280x1024 + NVIDIA T600
43997 Points (57%)
Unigine Valley 1.0 - Unigine Valley 1.0 DX
32.7 fps (11%)
SPECviewperf 12 + NVIDIA T600 SPECviewperf 12 - specvp12 sw-03
115 fps (29%)
specvp12 snx-02 + NVIDIA T600 SPECviewperf 12 - specvp12 snx-02
68.6 fps (10%)
specvp12 showcase-01 + NVIDIA T600 SPECviewperf 12 - specvp12 showcase-01
35.3 fps (8%)
specvp12 mediacal-01 + NVIDIA T600 SPECviewperf 12 - specvp12 mediacal-01
19.5 fps (5%)
specvp12 maya-04 + NVIDIA T600 SPECviewperf 12 - specvp12 maya-04
67.4 fps (18%)
specvp12 energy-01 + NVIDIA T600 SPECviewperf 12 - specvp12 energy-01
5 fps (4%)
specvp12 creo-01 + NVIDIA T600 SPECviewperf 12 - specvp12 creo-01
78.5 fps (31%)
specvp12 catia-04 + NVIDIA T600 SPECviewperf 12 - specvp12 catia-04
76.9 fps (13%)
specvp12 3dsmax-05 + NVIDIA T600 SPECviewperf 12 - specvp12 3dsmax-05
80 fps (14%)
SPECviewperf 13 specvp13 sw-04 + NVIDIA T600 SPECviewperf 13 - specvp13 sw-04
114 fps (31%)
specvp13 snx-03 + NVIDIA T600 SPECviewperf 13 - specvp13 snx-03
122 fps (14%)
specvp13 showcase-02 + NVIDIA T600 SPECviewperf 13 - specvp13 showcase-02
34.9 fps (8%)
specvp13 medical-02 + NVIDIA T600 SPECviewperf 13 - specvp13 medical-02
35.7 fps (7%)
specvp13 maya-05 + NVIDIA T600 SPECviewperf 13 - specvp13 maya-05
99.8 fps (11%)
specvp13 energy-02 + NVIDIA T600 SPECviewperf 13 - specvp13 energy-02
12.6 fps (4%)
specvp13 creo-02 + NVIDIA T600 SPECviewperf 13 - specvp13 creo-02
98 fps (14%)
specvp13 3dsmax-06 + NVIDIA T600 SPECviewperf 13 - specvp13 3dsmax-06
79.9 fps (14%)
SPECviewperf 2020 specvp2020 solidworks-05 4k + NVIDIA T600 SPECviewperf 2020 - specvp2020 solidworks-05 4k
16.9 fps (5%)
specvp2020 snx-04 4k + NVIDIA T600 SPECviewperf 2020 - specvp2020 snx-04 4k
75.6 fps (8%)
specvp2020 medical-03 4k + NVIDIA T600 SPECviewperf 2020 - specvp2020 medical-03 4k
4.5 fps (4%)
specvp2020 maya-06 4k + NVIDIA T600 SPECviewperf 2020 - specvp2020 maya-06 4k
46.1 fps (8%)
specvp2020 energy-03 4k + NVIDIA T600 SPECviewperf 2020 - specvp2020 energy-03 4k
6.7 fps (1%)
specvp2020 creo-03 4k + NVIDIA T600 SPECviewperf 2020 - specvp2020 creo-03 4k
32.3 fps (15%)
specvp2020 catia-06 4k + NVIDIA T600 SPECviewperf 2020 - specvp2020 catia-06 4k
13.8 fps (9%)
specvp2020 3dsmax-07 4k + NVIDIA T600 SPECviewperf 2020 - specvp2020 3dsmax-07 4k
19.4 fps (8%)
Cinebench R10 Cinebench R10 Shading (32bit) + NVIDIA T600 Cinebench R10 - Cinebench R10 Shading (32bit)
6830 Points (5%)
Cinebench R11.5 Cinebench R11.5 OpenGL 64 Bit + NVIDIA T600 Cinebench R11.5 - Cinebench R11.5 OpenGL 64 Bit
104.1 fps (36%)
Cinebench R15 + NVIDIA T600 Cinebench R15 - Cinebench R15 OpenGL 64 Bit
227.1 fps (13%)
Cinebench R15 OpenGL Ref. Match 64 Bit + NVIDIA T600 Cinebench R15 - Cinebench R15 OpenGL Ref. Match 64 Bit
99.6 % (100%)
LuxMark v2.0 64Bit - LuxMark v2.0 Room GPU
1121 Samples/s (5%)
LuxMark v2.0 64Bit - LuxMark v2.0 Sala GPU
2049 Samples/s (4%)
ComputeMark v2.1 - ComputeMark v2.1 Result
4825 Points (5%)
Power Consumption - Furmark Stress Test Power Consumption - external Monitor *
76.7 Watt (11%)
Power Consumption - The Witcher 3 Power Consumption - external Monitor *
83.5 Watt (12%)
Power Consumption - Witcher 3 ultra Power Efficiency - external Monitor
0.3 fps per Watt (27%)
Average Benchmarks NVIDIA T600 → 0% n=
- Range of benchmark values for this graphics card
- Average benchmark values for this graphics card
* Smaller numbers mean a higher performance
1 This benchmark is not used for the average calculation
Game Benchmarks The following benchmarks stem from our benchmarks of review laptops. The performance depends on the used graphics memory, clock rate, processor, system settings, drivers, and operating systems. So the results don't have to be representative for all laptops with this GPU. For detailed information on the benchmark results, click on the fps number.
Average Gaming NVIDIA T600 → 100% Average Gaming 30-70 fps → 100%
NVIDIA T600 low med. high ultra QHD 4K Far Cry 6 93.5 44.6 21.3 6.33 F1 2021 171.9 78.8 63.7 40.2 29.1 15.7 F1 2020 150.4 73.1 55.5 38.6 27 14.5 Borderlands 3 107.6 42 26.7 19.9 13.4 5.54 Metro Exodus 74.6 34 24 19.4 14.8 8.47 Strange Brigade 174.4 64.9 51.4 44.8 31.9 17.9 Far Cry 5 95 46 42 39 26 12 X-Plane 11.11 132.8 107 95.9 40.8 Final Fantasy XV Benchmark 70.7 34.9 25.1 17.8 9.98 Dota 2 Reborn 162.8 148.6 120.7 110.5 39.6 The Witcher 3 139.1 82.8 47.5 27.2 16.1 GTA V 181.5 175.6 80.3 38.2 26.6 25 < 30 fps < 60 fps < 120 fps ≥ 120 fps 5 7 5 5 2 4 4 3 1 4 5 1 7 1 9 2
For more games that might be playable and a list of all games and graphics cards visit our Gaming List
v1.28
log 04. 16:47:05
#0 checking url part for id 11373 +0s ... 0s
#1 checking url part for id 10588 +0s ... 0s
#2 redirected to Ajax server, took 1720104425 +0s ... 0s
#3 did not recreate cache, as it is less than 5 days old! Created at Thu, 04 Jul 2024 05:15:44 +0200 +0s ... 0s
#4 composed specs +0.028s ... 0.028s
#5 did output specs +0s ... 0.028s
#6 start showIntegratedCPUs +0s ... 0.028s
#7 getting avg benchmarks for device 11373 +0.012s ... 0.04s
#8 got single benchmarks 11373 +0.004s ... 0.044s
#9 getting avg benchmarks for device 10588 +0s ... 0.044s
#10 got single benchmarks 10588 +0s ... 0.044s
#11 got avg benchmarks for devices +0s ... 0.044s
#12 min, max, avg, median took s +0.025s ... 0.069s
#13 before gaming benchmark output +0s ... 0.069s
#14 Got 65 rows for game benchmarks. +0.004s ... 0.072s
#15 composed SQL query for gamebenchmarks +0s ... 0.072s
#16 got data and put it in $dataArray +0.001s ... 0.073s
#17 benchmarks composed for output. +0.004s ... 0.078s
#18 calculated avg scores. +0s ... 0.078s
#19 return log +0.002s ... 0.08s
Please share our article, every link counts!
Redaktion, 2017-09- 8 (Update: 2023-07- 1)
 Deutsch
 English
 Español
 Français
 Italiano
 Nederlands
 Polski
 Português
 Русский
 Türkçe
 Svenska
 Chinese
 Magyar