The Snapdragon X Elite X1E-78-100 is a pretty fast ARM architecture processor (SoC) for use in Windows laptops. The X1E-78-100 is the least powerful member of the Snapdragon X Elite processor series, as of May 2024; as such, it has 12 Oryon CPU cores (3 clusters of equally powerful cores; 12 threads) running at no more than 3.4 GHz. Other key features include the 3.8 TFLOPS Adreno X1-85 iGPU, the 45 TOPS Hexagon NPU and an impressively fast LPDDR5x-8448 memory controller.
The top dog, known as the Snapdragon X Elite X1E-84-100, is thought to be based on the same die with the same NPU but with higher GPU clock speeds, higher CPU clock speeds and possibly higher power targets as well.
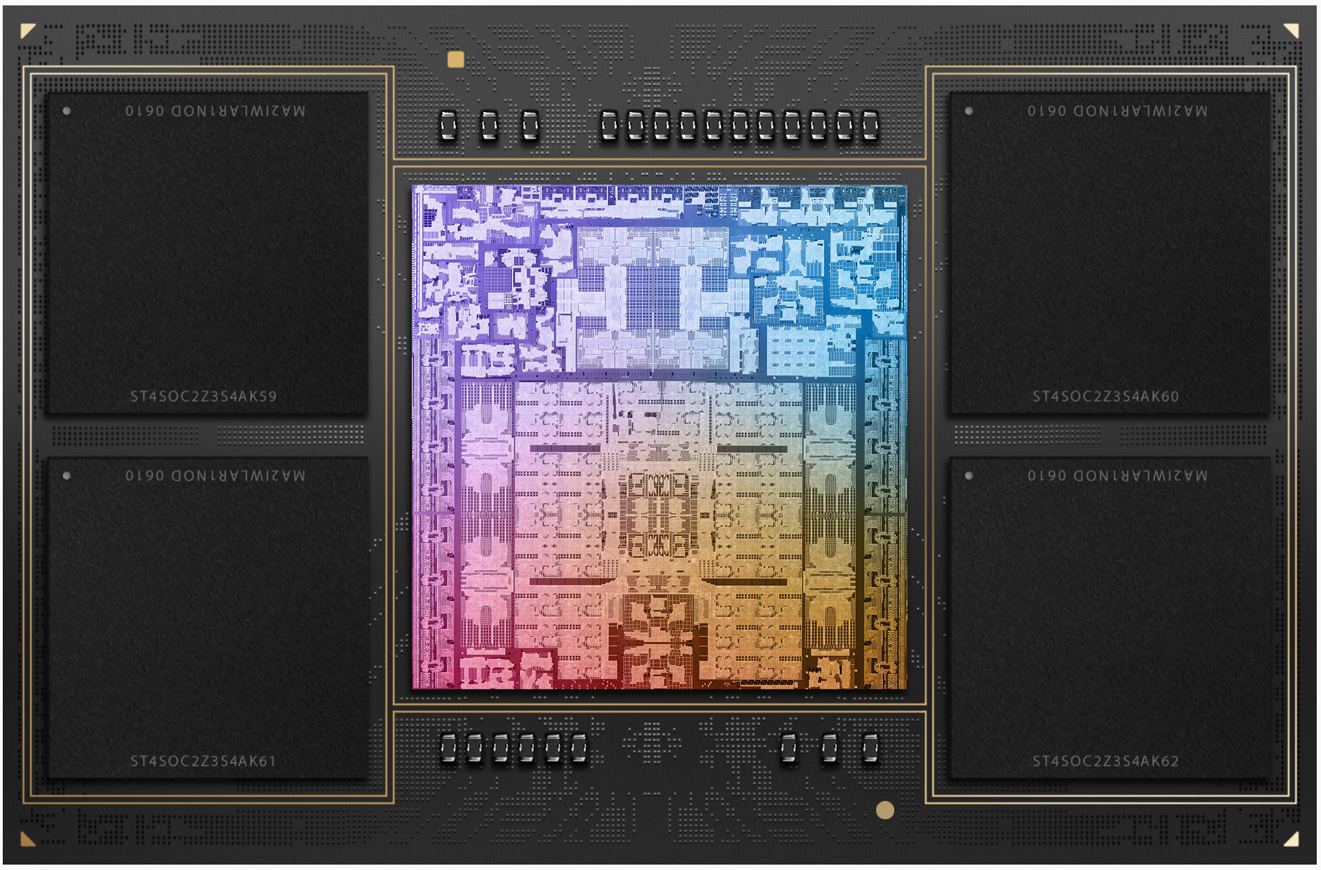
Architecture and Features
Qualcomm Oryon cores are in part based on Nuvia IP; they most likely make use of the ARM v8.7 microarchitecture. Much like modern AMD and Intel processors, the Snapdragon chip is compatible with USB 4 and thus with Thunderbolt 4 but it remains to be seen if the X Elite is compatible with GeForce or Radeon discrete graphics cards.
The SoC is said to have 12 PCIe 4 and 4 PCIe 3 lanes for connecting various kinds of devices. NVMe SSDs are supported with a throughput of up to 7.9 GB/s; furthermore, most laptops built around the chip are expected to have 16 GB of LPDDR5X-8448 RAM. There is also a 45 TOPS NPU for accelerating AI workloads.
Performance
Our first benchmarks (featuring a 35 W X Elite X1E-78-100) revealed very decent CPU performance figures that see the X Elite going head-to-head with the AMD Ryzen 7 7840U. It's also not much faster or slower than the Apple M3 chip with 10 GPU cores. While not groundbreaking, this should be good enough for the user to be able to run any applications in 2024 and 2025.
Like any other Windows on ARM platform, the Snapdragon X chip works best with applications and games compiled specifically for ARM processors. If making use of the built-in x86 to ARM emulation mode, a performance penalty of about 20% is to be expected.
Graphics
The integrated 3.8 TFLOPS Adreno X1-85 GPU is DirectX 12-enabled but not DirectX 12 Ultimate-enabled, despite featuring VRS and ray tracing support. The 3.8 TFLOPS of performance that it supposedly delivers pale in comparison to the slowest current-generation professional Nvidia Ada graphics card for laptops, the RTX 500 Ada, that's good for up to 9.2 TFLOPS.
Its gaming performance is rather underwhelming according to our in-house testing results. While slightly faster than the aging Iris Xe (96 EUs), the Adreno fails to outgun the Radeon 780M meaning there is little point in comparing it with full-fat discrete graphics cards. Baldur's Gate 3, a triple-A title released in 2023, is pretty much unplayable at 1080p / Low. GTA V, a game that saw the light of day in 2015, is playable at 1080p / High.
The Qualcomm iGPU will let you use up to 3 UHD 2160p monitors simultaneously. 2160p120 integrated displays are supported, as are the popular AV1, HEVC and AVC video codecs (both decoding and encoding). The hardware does not support the VVC codec; that feature remains a Lunar Lake exclusive for now.
Power consumption
The X1E-78-100 is set to be slightly less power-hungry than its morepowerful brothers. Expect to see anything between 20 W and 45 W under long-term workloads depending on the system and on the performance profile chosen. That's exactly what Ryzen HS chips normally consume.
The SoC is built with a 4 nm TSMC process for decent, as of H1 2024, energy efficiency.
The Apple M2 Pro is a System on a Chip (SoC) from Apple that is found in the early 2023 MacBook Pro 14 and 16-inch models. It offers all 12 cores available in the chip divided in eight performance cores (P-cores) and four power-efficiency cores (E-cores). The E-cores clock with up to 3.4 GHz, the P-Cores up to 3.7 GHz (mostly 3.3 GHz in multi-threaded workloads and 3.4 GHz in single threaded).
The big cores (codename Avalanche) offer 192 KB instruction cache, 128 KB data cache, and 36 MB shared L2 cache (up from 24 MB in the M1 Pro). The four efficiency cores (codename Blizzard) are a lot smaller and offer only 128 KB instruction cache, 64 KB data cache, and 4 MB shared cache. CPU and GPU can both use the 24 MB SLC (System Level Cache).
The unified memory (16 or 32 GB LPDDR5-6400) next to the chip is connected by a 256 Bit memory controller (200 GB/s bandwidth) and can be used by the GPU and CPU.
Apple states that the M2 Pro has a 25% higher performance than the M1 Pro in Xcode compiling.
The integrated graphics card in the M1 Pro offers all 19 cores.
Furthermore, the SoC integrates a fast 16 core neural engine (faster than M1 Pro), a secure enclave (e.g., for encryption), a unified memory architecture, Thunderbolt 4 controller, an ISP, and media de- and encoders (including ProRes).
The M2 Pro is manufactured in 5 nm at TSMC (second generation) and integrates 40 billion transistors.
The Apple M2 Max is a System on a Chip (SoC) from Apple that is found in the early 2023 MacBook Pro 14 and 16-inch models. It offers all 12 CPU cores available in the chip divided in eight performance cores (P-cores) and four power-efficiency cores (E-cores). The E-cores clock with up to 3.4 GHz, the P-Cores up to 3.7 GHz (mostly 3.3 GHz in multi-threaded workloads and 3.4 GHz in single threaded).
The big cores (codename Avalanche) offer 192 KB instruction cache, 128 KB data cache, and 36 MB shared L2 cache (up from 24 MB in the M1 Pro). The four efficiency cores (codename Blizzard) are a lot smaller and offer only 128 KB instruction cache, 64 KB data cache, and 4 MB shared cache. CPU and GPU can both use the 49 MB SLC (System Level Cache).
The unified memory (32, 64, or 96 GB LPDDR5-6400) next to the chip is connected by a 512 Bit memory controller (400 GB/s bandwidth) and can be used by the GPU and CPU.
The CPU performance should be quite similar to the M2 Pro as only the higher memory bandwidth and bigger L3 cache could make a difference for some workloads.
Furthermore, the SoC integrates a fast 16 core neural engine (faster than M1 Max), a secure enclave (e.g., for encryption), a unified memory architecture, Thunderbolt 4 controller, an ISP, and media de- and encoders (including ProRes).
The M2 Max is manufactured in 5 nm at TSMC (second generation) and integrates 40 billion transistors. The power consumption of the CPU part is up to 36 Watt according to powermetrics. When fully loading the CPU and GPU cores, the chip uses up to 89 Watt and the CPU part is limited to 25 Watt.
Average Benchmarks Qualcomm Snapdragon X Elite X1E-78-100 → 100%n=16
Average Benchmarks Apple M2 Pro → 121%n=16
Average Benchmarks Apple M2 Max → 123%n=16
- Range of benchmark values for this graphics card - Average benchmark values for this graphics card * Smaller numbers mean a higher performance 1 This benchmark is not used for the average calculation
v1.28
log 02. 14:10:15
#0 checking url part for id 17587 +0s ... 0s
#1 checking url part for id 14973 +0s ... 0s
#2 checking url part for id 14975 +0s ... 0s
#3 redirected to Ajax server, took 1719922215 +0s ... 0s
#4 did not recreate cache, as it is less than 5 days old! Created at Mon, 01 Jul 2024 05:15:43 +0200 +0s ... 0s
#5 composed specs +0.01s ... 0.01s
#6 did output specs +0s ... 0.01s
#7 getting avg benchmarks for device 17587 +0.004s ... 0.014s
#8 got single benchmarks 17587 +0.006s ... 0.02s
#9 getting avg benchmarks for device 14973 +0s ... 0.02s
#10 got single benchmarks 14973 +0.001s ... 0.021s
#11 getting avg benchmarks for device 14975 +0.001s ... 0.022s
#12 got single benchmarks 14975 +0.005s ... 0.026s
#13 got avg benchmarks for devices +0s ... 0.026s
#14 min, max, avg, median took s +0.028s ... 0.054s
 Deutsch
 English
 Español
 Français
 Italiano
 Nederlands
 Polski
 Português
 Русский
 Türkçe
 Svenska
 Chinese
 Magyar