Notebookcheck Logo

Qualcomm Snapdragon 8cx Gen 2 5G vs Intel Core i9-13900H vs Microsoft SQ1

Qualcomm Snapdragon 8cx Gen 2 5G

► remove from comparison Qualcomm SD 8cx Gen 2 5G

The Qualcomm Snapdragon 8cx Gen 2 5G Compute Platform (or SD8cx Gen2, SC8180XP) is a ARM based SoC for Windows laptops. It integrates a similar CPU part as the Snapdragon 855 (same cores but without the Prime Core feature) and is manufactured in 7nm at Samsung. The 4 Kryo 495 Gold cores are based on the ARM Cortex-A76 architecture (for performance) and clocked at 3.15 GHz under load. The 4 Kryo 495 Silver cores are small ARM Cortex-A55 cores for power efficiency and clocked at 1.8 GHz under load (most likely).

Compared to the predecessor, the Snapdragon 8cx, the Gen 2 offers higher clock speeds and an integrated 5G modem (X55 with Sub-6 GHz and mmWave support). Wi-Fi was also bumped up to Wi-Fi 6

The processor performance should be similar to a Intel Core i5 8th gen U-series (e.g. i5-8250U) according to Qualcomm. However, this is only the case for native ARM64 compiled Windows apps which are not that many (in mid 2019). 32 bit applications and games for AMD/Intel run in a rather slow emulation and 64 bit apps wont start at all (but an emulator should come in Windows in 2021).

The integrated Adreno 680 graphics card could also be a bit higher clocked.

The chip is very power efficient as its produced at TSMC in the modern 7 process. Therefore, laptops using the Snapdragon 8cx can be passively cooled (no fan) and should not throttle under constant load.

Intel Core i9-13900H

► remove from comparison Intel i9-13900H

The Intel Core i9-13900H is a high-end mobile CPU for laptops based on the Raptor Lake-H series (Alder Lake architecture). It was announced in early 2023 and offers 6 performance cores (P-cores, Golden Cove architecture) and 8 efficient cores (E-cores, Gracemont architecture). The P-cores support Hyper-Threading leading to 20 supported threads when combined with the E-cores. The clock rate ranges from 2.6 to 5.4 GHz (single core turbo, all-core 4.9 GHz) on the performance cluster and 1.9 to 4.1 GHz on the efficiency cluster. The performance of the E-cores should be similar to old Skylake cores (compare with the Core i7-6920HQ). All cores can use up to 24 MB L3 cache. Compared to the similar Core i9-13900HK, the 13900H supports no open multiplicator for overclocking, but on the other hand the full set of vPro management features.

Performance

The average 13900H in our database is in the same league as the Core i5-13500HX, Core i7-13705H, Core i9-12900HK, Core i9-13905H and also the Ryzen 9 7940HS, as far as multi-thread benchmark scores are concerned.

Thanks to its decent cooling solution and a long-term CPU power limit of 115 W, the Stealth 17 Studio A13VH-014 is among the fastest laptops built around the 13900H that we know of. It can be about 50% faster in CPU-bound workloads than the slowest system featuring the same chip in our database, as of August 2023.

Features

The integrated memory controller supports various memory types up to DDR5-5200 (up from 4800 MHz for the 12th gen). The Thread Director (in hardware) can support the operating system to decide which thread to use on the performance or efficient cores for the best performance. For AI tasks, the CPU also integrates GNA 3.0 and DL Boost (via AVX2). Quick Sync in version 8 is the same as in the Rocket Lake CPUs and supports MPEG-2, AVC, VC-1 decode, JPEG, VP8 decode, VP9, HEVC, and AV1 decode in hardware. The CPU now supports PCIe 5.0 x8 for a GPU and two PCIe 4.0 x4 for SSDs.

The integrated graphics card is based on the Xe-architecture and offers 96 EUs (Execution Units) .

The CPU is rated at 45 W base power (115 W PL2) but most laptops will use a PL1 of around 60 Watt. The SoC is manufactured in a 10nm process at Intel, which is known as Intel 7 (improved over the 12th Gen).

Microsoft SQ1

► remove from comparison Qualcomm SQ1

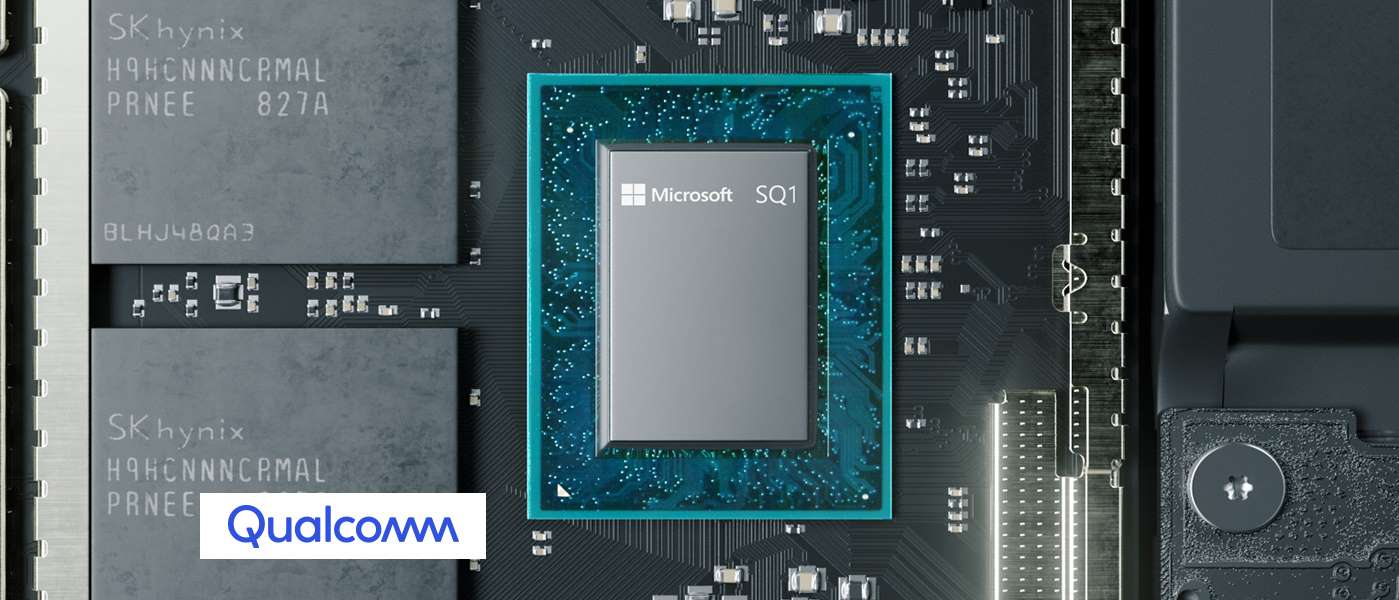
The Microsoft SQ1 is a ARM based SoC for Windows tablets (Surface Pro X). It is based on the Snapdragon 8cx but with higher clocked CPU and GPU cores. The CPU cores clock with up to 3 GHz. The 4 Kryo 495 Gold cores are based on the ARM Cortex-A76 architecture (for performance) and clocked at up to 3 GHz (2.84 GHz  for the 8cx) under load (no single core Turbo). The 4 Kryo 495 Silver cores are small ARM Cortex-A55 cores for power efficiency and clocked at 1.9 GHz (unverified) under load. The integrated X24 LTE modem supports up to 2 Gbps download speeds. Furthermore, the SoC integrates ac-Wifi and a dual-channel 32-bit 1866 MHz LPDDR4x memory controller.

The processor performance should be similar to a Intel Core i5 8th gen U-series (e.g. i5-8250U) according to Qualcomm. However, this is only the case for native ARM64 compiled Windows apps which are not that many (in mid 2019). 32 bit applications and games for AMD/Intel run in a rather slow emulation and 65 bit apps wont start at all.

The integrated Adreno 685 graphics card is a higher clocked version of the Adreno 680 in the Snapdragon 8cx. Microsoft claims 2 TFlops theoretical performance compared to the 1.8 for the Adreno 680 (+11%).

The chip is very power efficient as its produced at TSMC in the modern 7 process. Therefore, laptops using the Snapdragon 8cx can be passively cooled (no fan) and should not throttle under constant load.

ModelQualcomm Snapdragon 8cx Gen 2 5GIntel Core i9-13900HMicrosoft SQ1
SeriesQualcomm SnapdragonIntel Raptor Lake-HQualcomm Snapdragon
CodenameCortex-A76 / A55 (Kryo 495)Raptor Lake-HCortex-A76 / A55 (Kryo 495)
Series: Snapdragon Cortex-A76 / A55 (Kryo 495)
Qualcomm Snapdragon 8cx Gen 2 5G « 3.15 GHz8 / 8 cores2 MB L3 Cortex-A76 / A55 (Kryo 495)
Microsoft SQ13 GHz8 / 8 cores2 MB L3 Cortex-A76 / A55 (Kryo 495)
Qualcomm Snapdragon 8cx2.84 GHz8 / 8 cores2 MB L3 Cortex-A76 / A55 (Kryo 495)
Intel Core i9-13900HK1.9 - 5.4 GHz14 / 20 cores24 MB L3
Intel Core i9-13905H1.9 - 5.4 GHz14 / 20 cores24 MB L3
Intel Core i9-13900H « 1.9 - 5.4 GHz14 / 20 cores24 MB L3
Intel Core i7-13800H1.8 - 5.2 GHz14 / 20 cores24 MB L3
Intel Core i7-13705H1.8 - 5 GHz14 / 20 cores24 MB L3
Intel Core i7-13700H1.8 - 5 GHz14 / 20 cores24 MB L3
Intel Core i7-13620H1.8 - 4.9 GHz10 / 16 cores24 MB L3
Intel Core i5-13600H2.1 - 4.8 GHz12 / 16 cores18 MB L3
Intel Core i5-13505H1.9 - 4.7 GHz12 / 16 cores18 MB L3
Intel Core i5-13500H1.9 - 4.7 GHz12 / 16 cores18 MB L3
Intel Core i5-13420H1.5 - 4.6 GHz8 / 12 cores12 MB L3
Qualcomm Snapdragon 8cx Gen 2 5G3.15 GHz8 / 8 cores2 MB L3 Cortex-A76 / A55 (Kryo 495)
Microsoft SQ1 « 3 GHz8 / 8 cores2 MB L3 Cortex-A76 / A55 (Kryo 495)
Qualcomm Snapdragon 8cx2.84 GHz8 / 8 cores2 MB L3 Cortex-A76 / A55 (Kryo 495)
Clock3150 MHz1900 - 5400 MHz3000 MHz
L3 Cache2 MB24 MB2 MB
Cores / Threads8 / 814 / 208 / 8
TDP7 Watt45 Watt
Technology7 nm10 nm7 nm
FeaturesX24 LTE Modem, Adreno 680 GPUDDR4-3200/LPDDR4x-4266/DDR5-5200/LPDDR5-6400/LPDDR5x-6400 RAM, PCIe 5, Thr. Dir., DL B., GNA, vPro Ent., RPE, MMX, SSE, SSE2, SSE3, SSSE3, SSE4.1, SSE4.2, AES, AVX, AVX2, FMA3, SHAX24 LTE Modem, Adreno 685 GPU
iGPUQualcomm Adreno 680Intel Iris Xe Graphics G7 96EUs ( - 1500 MHz)Qualcomm Adreno 685
ArchitectureARMx86ARM
Announced
Manufacturerwww.qualcomm.comark.intel.comwww.microsoft.com
L1 Cache1.2 MB
L2 Cache11.5 MB
max. Temp.100 °C
SocketBGA1744

Benchmarks

Performance Rating - CB R15 + R20 + 7-Zip + X265 + Blender + 3DM11 CPU - i9-13900H
46.3 pt (64%)
Cinebench 2024 - Cinebench 2024 CPU Single Core
min: 101     avg: 102.5     median: 102.5 (71%)     max: 104 Points
Cinebench 2024 - Cinebench 2024 CPU Multi Core
min: 703     avg: 761     median: 760.5 (14%)     max: 818 Points
Cinebench R23 - Cinebench R23 Multi Core
min: 13015     avg: 16992     median: 17706 (16%)     max: 20385 Points
Cinebench R23 - Cinebench R23 Single Core
min: 1297     avg: 1894     median: 1966 (84%)     max: 2054 Points
Cinebench R20 - Cinebench R20 CPU (Single Core)
min: 428     avg: 723     median: 754 (84%)     max: 792 Points
Cinebench R20 - Cinebench R20 CPU (Multi Core)
min: 4960     avg: 6599     median: 6864.5 (17%)     max: 7716 Points
Cinebench R15 - Cinebench R15 CPU Multi 64 Bit
min: 2061     avg: 2685     median: 2706 (17%)     max: 3100 Points
Cinebench R15 - Cinebench R15 CPU Single 64 Bit
min: 211     avg: 269.8     median: 280 (84%)     max: 297 Points
Cinebench R11.5 - Cinebench R11.5 CPU Multi 64 Bit
min: 27.48     avg: 28.6     median: 28.6 (37%)     max: 29.65 Points
Cinebench R11.5 - Cinebench R11.5 CPU Single 64 Bit
min: 2.98     avg: 3     median: 3 (74%)     max: 3 Points
Cinebench R10 - Cinebench R10 Rend. Single (32bit)
min: 9550     avg: 9590     median: 9590 (58%)     max: 9630 Points
6%
1 SQ1 +
537 Points (3%)
Cinebench R10 - Cinebench R10 Rend. Multi (32bit)
min: 53438     avg: 54921     median: 54920.5 (40%)     max: 56403 Points
8%
1 SQ1 +
4276 Points (3%)
Cinebench R10 - Cinebench R10 Rend. Multi (64bit)
min: 79014     avg: 79435     median: 79435 (55%)     max: 79856 Points
Cinebench R10 - Cinebench R10 Rend. Single (64bit)
min: 13752     avg: 13786     median: 13786 (17%)     max: 13820 Points
wPrime 2.10 - wPrime 2.0 1024m *
min: 179.496     avg: 296.1     median: 296.1 (4%)     max: 412.775 s
98%
1 SQ1 +
429.3 s (5%)
wPrime 2.10 - wPrime 2.0 32m *
min: 3.141     avg: 3.3     median: 3.3 (1%)     max: 3.518 s
98%
1 SQ1 +
14.2 s (3%)
WinRAR - WinRAR 4.0
min: 6800     avg: 8052     median: 8051.5 (13%)     max: 9303 Points
7-Zip 18.03 - 7-Zip 18.03 Multli Thread 4 runs
min: 45045     avg: 66867     median: 70217.5 (40%)     max: 79032 MIPS
7-Zip 18.03 - 7-Zip 18.03 Single Thread 4 runs
min: 3665     avg: 6064     median: 6277.5 (75%)     max: 6600 MIPS
X264 HD Benchmark 4.0 - x264 Pass 2
min: 113.95     avg: 126.3     median: 126.3 (44%)     max: 138.55 fps
X264 HD Benchmark 4.0 - x264 Pass 1
min: 284     avg: 292.3     median: 292.3 (67%)     max: 300.5 fps
HWBOT x265 Benchmark v2.2 - HWBOT x265 4k Preset
min: 14.1     avg: 18.7     median: 19 (33%)     max: 22.3 fps
TrueCrypt - TrueCrypt Serpent
min: 1.2     avg: 1.3     median: 1.3 (0%)     max: 1.4 GB/s
TrueCrypt - TrueCrypt Twofish
min: 2.4     avg: 2.5     median: 2.5 (42%)     max: 2.5 GB/s
TrueCrypt - TrueCrypt AES
min: 13.2     avg: 14     median: 14 (36%)     max: 14.8 GB/s
Blender - Blender 3.3 Classroom CPU *
min: 279     avg: 348.7     median: 336 (4%)     max: 467 Seconds
Blender - Blender 2.79 BMW27 CPU *
min: 166     avg: 203     median: 193 (1%)     max: 268 Seconds
R Benchmark 2.5 - R Benchmark 2.5 *
min: 0.4052     avg: 0.4     median: 0.4 (9%)     max: 0.723 sec
3DMark 06 - CPU - 3DMark 06 - CPU
min: 13869     avg: 14799     median: 14893 (32%)     max: 15501 Points
Super Pi mod 1.5 XS 1M - Super Pi mod 1.5 XS 1M *
min: 6.156     avg: 6.8     median: 6.8 (1%)     max: 7.445 s
97%
1 SQ1 +
21.2 s (5%)
Super Pi mod 1.5 XS 2M - Super Pi mod 1.5 XS 2M *
min: 13.784     avg: 15     median: 15 (1%)     max: 16.234 s
99%
1 SQ1 +
46.7 s (2%)
Super Pi Mod 1.5 XS 32M - Super Pi mod 1.5 XS 32M *
min: 350.453     avg: 383.8     median: 383.8 (2%)     max: 417.103 s
97%
1 SQ1 +
1095 s (5%)
3DMark Vantage - 3DM Vant. Perf. CPU no Physx
min: 55574     avg: 65893     median: 67507 (59%)     max: 75108 Points
3DMark 11 - 3DM11 Performance Physics
1975 Points (5%)
min: 15540     avg: 21972     median: 22680.5 (61%)     max: 25420 Points
163%
SQ1 +
3210 Points (9%)
3DMark - 3DMark Ice Storm Physics
min: 83732     avg: 95381     median: 93901 (76%)     max: 103874 Points
3DMark - 3DMark Ice Storm Extreme Physics
min: 85594     avg: 91514     median: 93285 (76%)     max: 93890 Points
3DMark - 3DMark Ice Storm Unlimited Physics
min: 89952     avg: 94996     median: 96373 (81%)     max: 98040 Points
3DMark - 3DMark Cloud Gate Physics
min: 12004     avg: 17896     median: 18588.5 (47%)     max: 22184 Points
3DMark - 3DMark Fire Strike Standard Physics
min: 17733     avg: 26770     median: 27939 (50%)     max: 32664 Points
3DMark - 3DMark Time Spy CPU
min: 7863     avg: 11616     median: 11827.5 (50%)     max: 13726 Points
Geekbench 6.2 - Geekbench 6.2 Single-Core
min: 2437     avg: 2658     median: 2653.5 (71%)     max: 2807 Points
Geekbench 6.2 - Geekbench 6.2 Multi-Core
min: 11118     avg: 12850     median: 12644 (50%)     max: 14404 Points
Geekbench 5.5 - Geekbench 5.1 - 5.4 64 Bit Single-Core
min: 793     avg: 797     median: 797 (34%)     max: 801 Points
min: 1140     avg: 1903     median: 1960 (83%)     max: 2043 Points
93%
SQ1 +
739 Points (31%)
Geekbench 5.5 - Geekbench 5.1 - 5.4 64 Bit Multi-Core
min: 3088     avg: 3116     median: 3115.5 (6%)     max: 3143 Points
min: 9094     avg: 12693     median: 13014 (23%)     max: 15410 Points
92%
SQ1 +
2875 Points (5%)
Geekbench 5.0 - Geekbench 5.0 64 Bit Single-Core
min: 1654     avg: 1819     median: 1847 (8%)     max: 1958 Points
39%
1 SQ1 +
728 Points (3%)
Geekbench 5.0 - Geekbench 5.0 64 Bit Multi-Core
min: 11168     avg: 12512     median: 12681 (40%)     max: 14172 Points
22%
1 SQ1 +
2785 Points (9%)
Geekbench 4.4 - Geekbench 4.1 - 4.4 64 Bit Single-Core
2355 Points (24%)
min: 7253     avg: 8025     median: 8266 (83%)     max: 8498 Points
35%
SQ1 +
830 Points (8%)
Geekbench 4.4 - Geekbench 4.1 - 4.4 64 Bit Multi-Core
7502 Points (8%)
min: 41851     avg: 47697     median: 46327 (51%)     max: 54848 Points
35%
SQ1 +
2597 Points (3%)
Mozilla Kraken 1.1 - Kraken 1.1 Total Score *
1284 ms (2%)
min: 456     avg: 505     median: 478 (1%)     max: 828 ms
100%
SQ1 +
1408 ms (2%)
Octane V2 - Octane V2 Total Score
32979 Points (29%)
min: 85435     avg: 97010     median: 100627 (88%)     max: 102947 Points
94%
SQ1 +
31099 Points (27%)
WebXPRT 4 - WebXPRT 4 Score
min: 133.5     avg: 275.6     median: 284 (82%)     max: 348 Points
WebXPRT 3 - WebXPRT 3 Score
132 Points (28%)
min: 171.4     avg: 303.2     median: 317 (66%)     max: 340 Points
88%
SQ1 +
116 Points (24%)
CrossMark - CrossMark Overall
min: 1104     avg: 1872     median: 1915 (73%)     max: 2146 Points
Power Consumption - Prime95 Power Consumption - external Monitor *
17 Watt (3%)
min: 38.1     avg: 100.5     median: 102.4 (18%)     max: 154 Watt
Power Consumption - Cinebench R15 Multi Power Consumption - external Monitor *
min: 66.1     avg: 125.6     median: 115.9 (21%)     max: 196.9 Watt
Power Consumption - Idle Power Consumption - external Monitor *
min: 2.9     avg: 14     median: 15.6 (10%)     max: 28.1 Watt
Power Consumption - Idle Power Consumption 150cd 1min *
5.6 Watt (6%)
min: 4.85     avg: 13.3     median: 12.3 (14%)     max: 24 Watt
Power Consumption - Cinebench R15 Multi Power Efficiency - external Monitor
min: 13.6     avg: 27.9     median: 21.8 (16%)     max: 97.6 Points per Watt

Average Benchmarks Qualcomm Snapdragon 8cx Gen 2 5G → 100% n=8

Average Benchmarks Intel Core i9-13900H → 428% n=8

Average Benchmarks Microsoft SQ1 → 87% n=8

- Range of benchmark values for this graphics card
- Average benchmark values for this graphics card
* Smaller numbers mean a higher performance
1 This benchmark is not used for the average calculation

v1.28
log 03. 22:29:30

#0 checking url part for id 13120 +0s ... 0s

#1 checking url part for id 14717 +0s ... 0s

#2 checking url part for id 11516 +0s ... 0s

#3 redirected to Ajax server, took 1720038570 +0s ... 0s

#4 did not recreate cache, as it is less than 5 days old! Created at Mon, 01 Jul 2024 05:15:43 +0200 +0s ... 0s

#5 composed specs +0.008s ... 0.009s

#6 did output specs +0s ... 0.009s

#7 getting avg benchmarks for device 13120 +0.001s ... 0.009s

#8 got single benchmarks 13120 +0.004s ... 0.013s

#9 getting avg benchmarks for device 14717 +0.004s ... 0.018s

#10 got single benchmarks 14717 +0.033s ... 0.051s

#11 getting avg benchmarks for device 11516 +0.001s ... 0.052s

#12 got single benchmarks 11516 +0.003s ... 0.055s

#13 got avg benchmarks for devices +0s ... 0.055s

#14 min, max, avg, median took s +0.048s ... 0.104s

#15 return log +0s ... 0.104s

Please share our article, every link counts!
> Expert Reviews and News on Laptops, Smartphones and Tech Innovations > Benchmarks / Tech > Processor Comparison - Head 2 Head
Redaktion, 2017-09- 8 (Update: 2023-07- 1)