Notebookcheck Logo

Qualcomm Snapdragon 8cx Gen 2 5G vs Apple M2 vs Microsoft SQ1

Qualcomm Snapdragon 8cx Gen 2 5G

► remove from comparison Qualcomm SD 8cx Gen 2 5G

The Qualcomm Snapdragon 8cx Gen 2 5G Compute Platform (or SD8cx Gen2, SC8180XP) is a ARM based SoC for Windows laptops. It integrates a similar CPU part as the Snapdragon 855 (same cores but without the Prime Core feature) and is manufactured in 7nm at Samsung. The 4 Kryo 495 Gold cores are based on the ARM Cortex-A76 architecture (for performance) and clocked at 3.15 GHz under load. The 4 Kryo 495 Silver cores are small ARM Cortex-A55 cores for power efficiency and clocked at 1.8 GHz under load (most likely).

Compared to the predecessor, the Snapdragon 8cx, the Gen 2 offers higher clock speeds and an integrated 5G modem (X55 with Sub-6 GHz and mmWave support). Wi-Fi was also bumped up to Wi-Fi 6

The processor performance should be similar to a Intel Core i5 8th gen U-series (e.g. i5-8250U) according to Qualcomm. However, this is only the case for native ARM64 compiled Windows apps which are not that many (in mid 2019). 32 bit applications and games for AMD/Intel run in a rather slow emulation and 64 bit apps wont start at all (but an emulator should come in Windows in 2021).

The integrated Adreno 680 graphics card could also be a bit higher clocked.

The chip is very power efficient as its produced at TSMC in the modern 7 process. Therefore, laptops using the Snapdragon 8cx can be passively cooled (no fan) and should not throttle under constant load.

Apple M2

► remove from comparison Apple M2

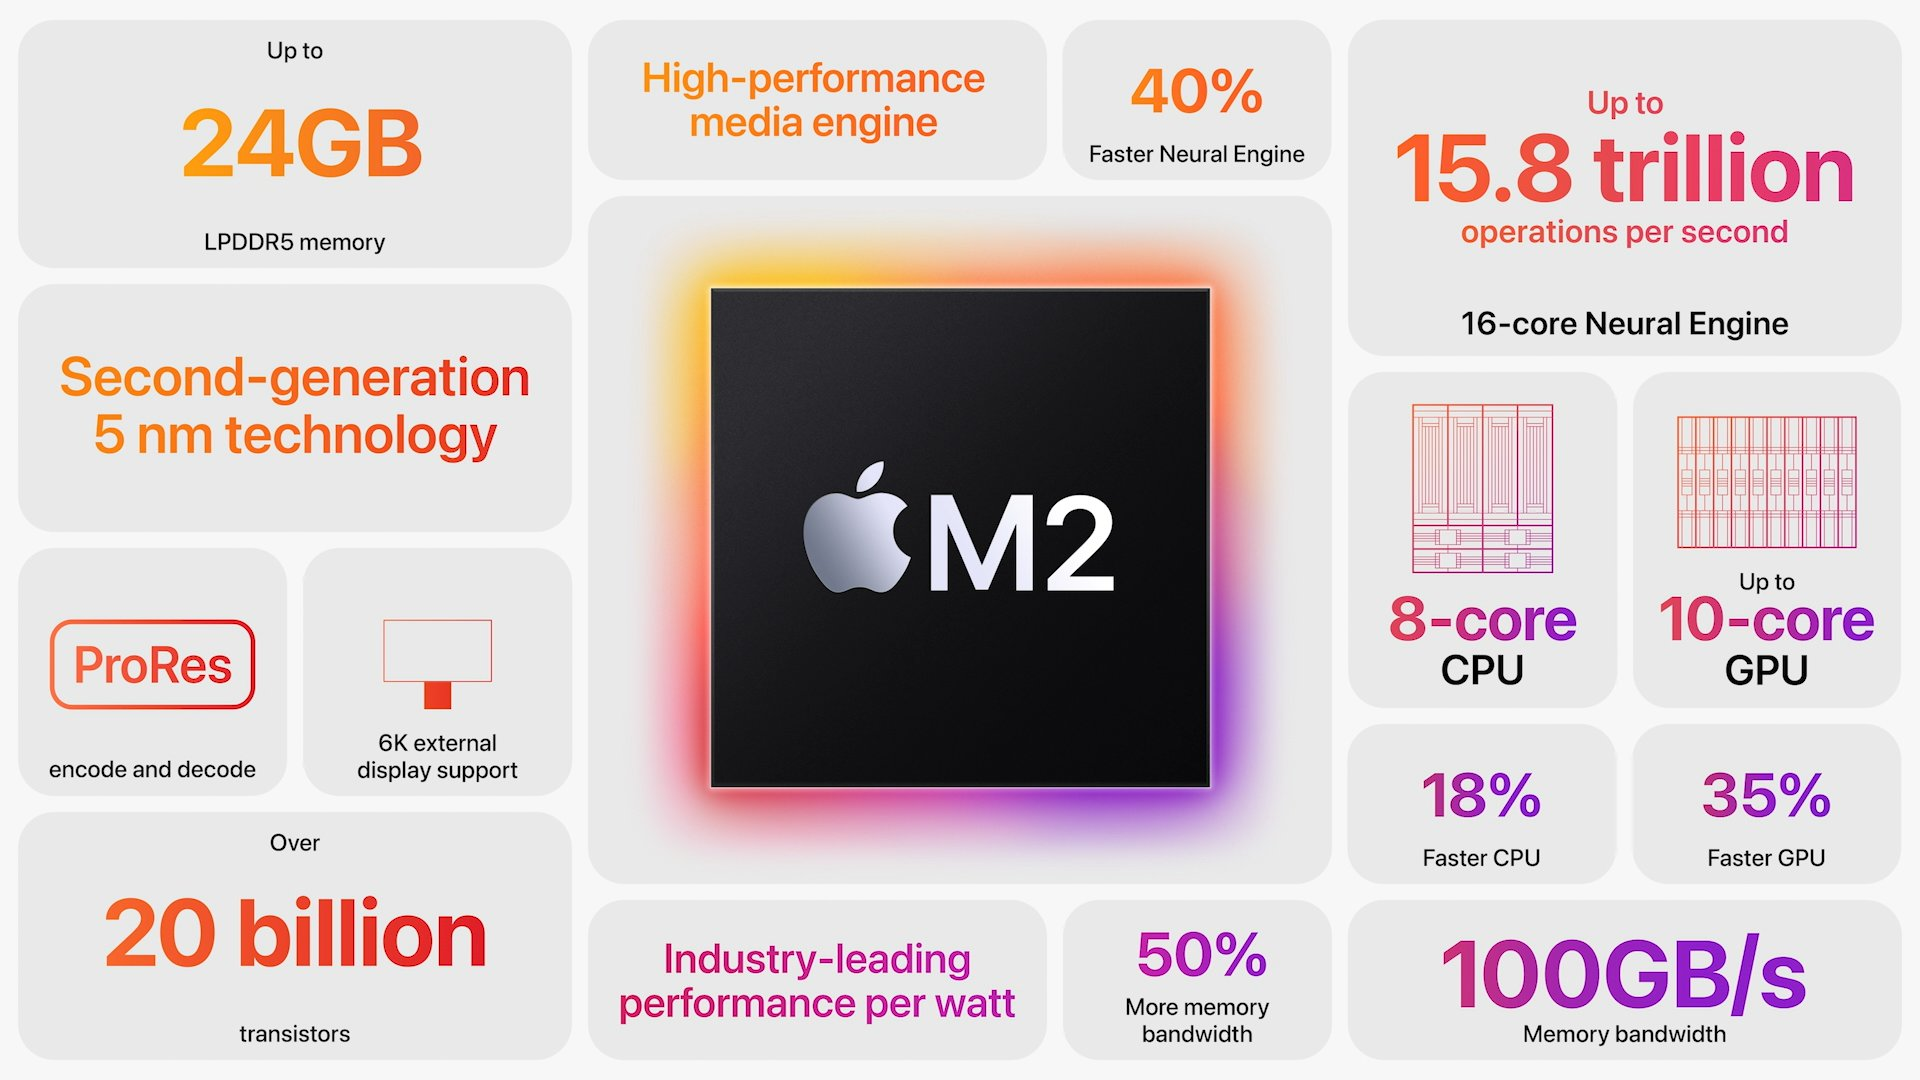
The Apple M2 is a System on a Chip (SoC) from Apple that is found in the late 2022 MacBook Air and, MacBook Pro 13. It offers 8 cores divided in four performance cores and four power-efficiency cores. The big cores offer 192 KB instruction cache, 128 KB data cache, and 16 MB shared L2 cache (up from 12 MB). The four efficiency cores are a lot smaller and offer only 128 KB instruction cache, 64 KB data cache, and 4 MB shared cache. The efficiency cores (E cluster) clock with  up to 2,4 GHz, the performance cores (P cluster) with up to 3,5 GHz and therefore higher than the M1 cores. The architecture should be similar to the A15 (iPhone 13) with Avalanche and Blizzard cores.

The chip features a unified memory architecture for the CPU and GPU cores and supports up to 24 GB LPDDR5-6400 for a bandwidth of up to 100GB/s.

According to Apple, the M2 offers a 18% higher CPU performance at the same power consumption level compared to the Apple M1. In our tests, the MacBook Pro 13 with active cooling was able to reach the 18% in Geekbench Multi. In other benchmarks we measured 12 to 15% gains compared to the M1. Therefore, the performance is now near the M1 Pro with 8 cores. The passively cooled MacBook Air may however suffer from throttling in longer load scenarios.

The integrated graphics card in the M2 offers 8 or 10 cores and a peak performance of 3.6 TFLOPs.

Furthermore, the SoC integrates a fast 16 core neural engine with a peak performance of 16 TOPS (for AI hardware acceleration), a secure enclave (e.g., for encryption), Thunderbolt / USB 4 controller, an ISP, and media de- and encoders.

The Apple M2 includes 20 billion transistors (up from the 16 billion of the M1) and is manufactured in the second generation 5nm process at TSMC (most likely N5P). The power consumption is rated at 20W what we also measured under CPU load.

Microsoft SQ1

► remove from comparison Qualcomm SQ1

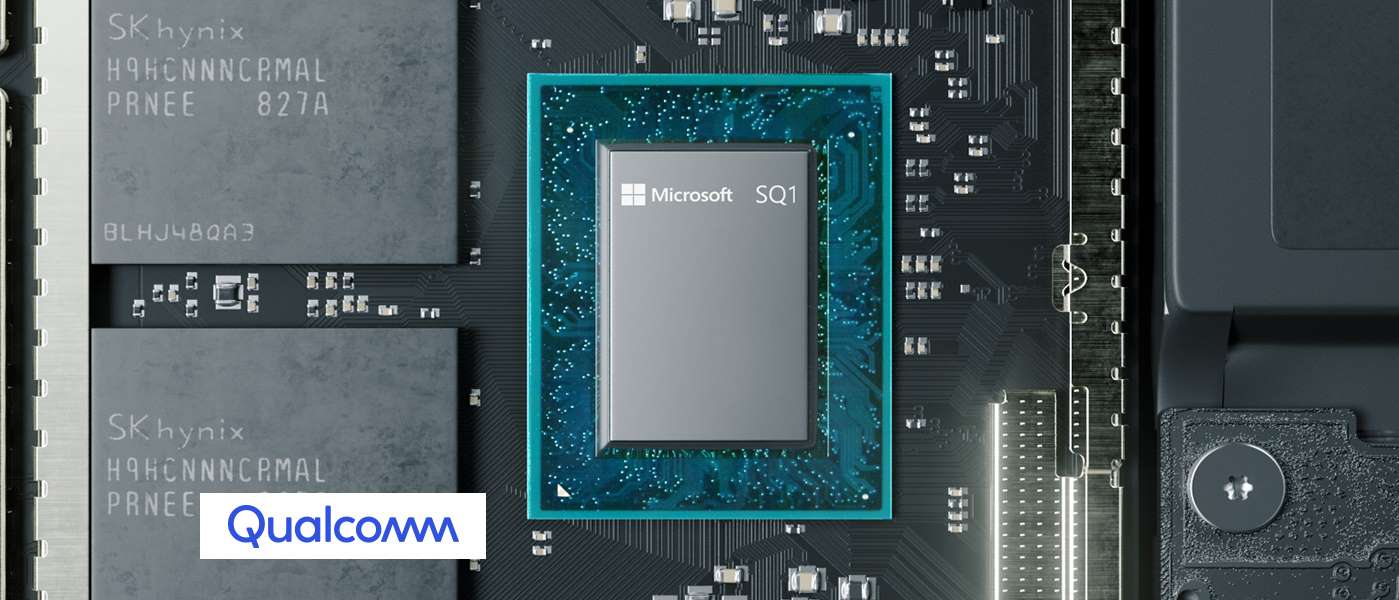
The Microsoft SQ1 is a ARM based SoC for Windows tablets (Surface Pro X). It is based on the Snapdragon 8cx but with higher clocked CPU and GPU cores. The CPU cores clock with up to 3 GHz. The 4 Kryo 495 Gold cores are based on the ARM Cortex-A76 architecture (for performance) and clocked at up to 3 GHz (2.84 GHz  for the 8cx) under load (no single core Turbo). The 4 Kryo 495 Silver cores are small ARM Cortex-A55 cores for power efficiency and clocked at 1.9 GHz (unverified) under load. The integrated X24 LTE modem supports up to 2 Gbps download speeds. Furthermore, the SoC integrates ac-Wifi and a dual-channel 32-bit 1866 MHz LPDDR4x memory controller.

The processor performance should be similar to a Intel Core i5 8th gen U-series (e.g. i5-8250U) according to Qualcomm. However, this is only the case for native ARM64 compiled Windows apps which are not that many (in mid 2019). 32 bit applications and games for AMD/Intel run in a rather slow emulation and 65 bit apps wont start at all.

The integrated Adreno 685 graphics card is a higher clocked version of the Adreno 680 in the Snapdragon 8cx. Microsoft claims 2 TFlops theoretical performance compared to the 1.8 for the Adreno 680 (+11%).

The chip is very power efficient as its produced at TSMC in the modern 7 process. Therefore, laptops using the Snapdragon 8cx can be passively cooled (no fan) and should not throttle under constant load.

ModelQualcomm Snapdragon 8cx Gen 2 5GApple M2Microsoft SQ1
SeriesQualcomm SnapdragonApple Apple M2Qualcomm Snapdragon
CodenameCortex-A76 / A55 (Kryo 495)Cortex-A76 / A55 (Kryo 495)
Series: Snapdragon Cortex-A76 / A55 (Kryo 495)
Qualcomm Snapdragon 8cx Gen 2 5G « 3.15 GHz8 / 8 cores2 MB L3 Cortex-A76 / A55 (Kryo 495)
Microsoft SQ13 GHz8 / 8 cores2 MB L3 Cortex-A76 / A55 (Kryo 495)
Qualcomm Snapdragon 8cx2.84 GHz8 / 8 cores2 MB L3 Cortex-A76 / A55 (Kryo 495)
Apple M2 Max2.42 - 3.7 GHz12 / 12 cores48 MB L3
Apple M2 Pro2.42 - 3.5 GHz12 / 12 cores24 MB L3
Apple M2 Pro 10-Core2.42 - 3.7 GHz10 / 10 cores24 MB L3
Apple M2 « 2.42 - 3.48 GHz8 / 8 cores8 MB L3
Qualcomm Snapdragon 8cx Gen 2 5G3.15 GHz8 / 8 cores2 MB L3 Cortex-A76 / A55 (Kryo 495)
Microsoft SQ1 « 3 GHz8 / 8 cores2 MB L3 Cortex-A76 / A55 (Kryo 495)
Qualcomm Snapdragon 8cx2.84 GHz8 / 8 cores2 MB L3 Cortex-A76 / A55 (Kryo 495)
Clock3150 MHz2424 - 3480 MHz3000 MHz
L3 Cache2 MB8 MB2 MB
Cores / Threads8 / 88 / 88 / 8
TDP7 Watt20 Watt
Technology7 nm5 nm7 nm
FeaturesX24 LTE Modem, Adreno 680 GPUARMv8 Instruction SetX24 LTE Modem, Adreno 685 GPU
iGPUQualcomm Adreno 680Apple M2 10-Core GPU ( - 1398 MHz)Qualcomm Adreno 685
ArchitectureARMARMARM
Announced
Manufacturerwww.qualcomm.comwww.apple.comwww.microsoft.com
L1 Cache2 MB
L2 Cache20 MB
Transistors20000 Million

Benchmarks

Cinebench 2024 - Cinebench 2024 CPU Single Core
100%
1 M2 +
121 Points (84%)
Cinebench 2024 - Cinebench 2024 CPU Multi Core
100%
1 M2 +
513 Points (10%)
Cinebench R23 - Cinebench R23 Multi Core
100%
1 M2 +
min: 8517     avg: 8654     median: 8667 (8%)     max: 8772 Points
Cinebench R23 - Cinebench R23 Single Core
100%
1 M2 +
min: 1580     avg: 1595     median: 1585 (67%)     max: 1638 Points
Cinebench R20 - Cinebench R20 CPU (Single Core)
100%
1 M2 +
min: 216     avg: 370.8     median: 381 (42%)     max: 446 Points
Cinebench R20 - Cinebench R20 CPU (Multi Core)
100%
1 M2 +
min: 2231     avg: 2325     median: 2324 (6%)     max: 2416 Points
Cinebench R15 - Cinebench R15 CPU Multi 64 Bit
100%
1 M2 +
min: 1209.9     avg: 1222     median: 1215 (8%)     max: 1243 Points
Cinebench R15 - Cinebench R15 CPU Single 64 Bit
100%
1 M2 +
min: 222     avg: 223.8     median: 223 (67%)     max: 229 Points
Cinebench R10 - Cinebench R10 Rend. Single (32bit)
100%
1 SQ1 +
537 Points (3%)
Cinebench R10 - Cinebench R10 Rend. Multi (32bit)
100%
1 SQ1 +
4276 Points (3%)
wPrime 2.10 - wPrime 2.0 1024m *
100%
1 SQ1 +
429.3 s (5%)
wPrime 2.10 - wPrime 2.0 32m *
100%
1 SQ1 +
14.2 s (3%)
Blender - Blender 3.3 Classroom CPU *
100%
1 M2 +
min: 540     avg: 620     median: 619.5 (8%)     max: 702 Seconds
Blender - Blender 2.79 BMW27 CPU *
100%
1 M2 +
min: 549     avg: 614     median: 597 (4%)     max: 713 Seconds
Super Pi mod 1.5 XS 1M - Super Pi mod 1.5 XS 1M *
100%
1 SQ1 +
21.2 s (5%)
Super Pi mod 1.5 XS 2M - Super Pi mod 1.5 XS 2M *
100%
1 SQ1 +
46.7 s (2%)
Super Pi Mod 1.5 XS 32M - Super Pi mod 1.5 XS 32M *
100%
1 SQ1 +
1095 s (5%)
3DMark 11 - 3DM11 Performance Physics
1975 Points (5%)
163%
1 SQ1 +
3210 Points (9%)
Geekbench 6.2 - Geekbench 6.2 Single-Core
100%
1 M2 +
min: 2587     avg: 2609     median: 2599 (70%)     max: 2650 Points
Geekbench 6.2 - Geekbench 6.2 Multi-Core
100%
1 M2 +
min: 10034     avg: 10083     median: 10089 (40%)     max: 10120 Points
Geekbench 5.5 - Geekbench 5.1 - 5.4 64 Bit Single-Core
min: 793     avg: 797     median: 797 (34%)     max: 801 Points
240%
M2 +
min: 1887     avg: 1914     median: 1915.5 (81%)     max: 1953 Points
93%
SQ1 +
739 Points (31%)
Geekbench 5.5 - Geekbench 5.1 - 5.4 64 Bit Multi-Core
min: 3088     avg: 3116     median: 3115.5 (6%)     max: 3143 Points
287%
M2 +
min: 8491     avg: 8812     median: 8956 (16%)     max: 8994 Points
92%
SQ1 +
2875 Points (5%)
Geekbench 5.0 - Geekbench 5.0 64 Bit Single-Core
100%
1 SQ1 +
728 Points (3%)
Geekbench 5.0 - Geekbench 5.0 64 Bit Multi-Core
100%
1 SQ1 +
2785 Points (9%)
Geekbench 4.4 - Geekbench 4.1 - 4.4 64 Bit Single-Core
2355 Points (24%)
35%
1 SQ1 +
830 Points (8%)
Geekbench 4.4 - Geekbench 4.1 - 4.4 64 Bit Multi-Core
7502 Points (8%)
35%
1 SQ1 +
2597 Points (3%)
Mozilla Kraken 1.1 - Kraken 1.1 Total Score *
1284 ms (2%)
101%
M2 +
min: 440     avg: 450.1     median: 449.2 (1%)     max: 466.8 ms
100%
SQ1 +
1408 ms (2%)
Octane V2 - Octane V2 Total Score
32979 Points (29%)
227%
M2 +
min: 72484     avg: 75019     median: 74878 (66%)     max: 78736 Points
94%
SQ1 +
31099 Points (27%)
WebXPRT 4 - WebXPRT 4 Score
100%
1 M2 +
min: 223     avg: 237.8     median: 235 (68%)     max: 256 Points
WebXPRT 3 - WebXPRT 3 Score
132 Points (28%)
285%
M2 +
min: 342     avg: 366.5     median: 376 (78%)     max: 387 Points
88%
SQ1 +
116 Points (24%)
Antutu v9 - AnTuTu v9 Total Score
100%
1 M2 +
min: 1257990     avg: 1337360     median: 1337360 (81%)     max: 1416730 Points
Antutu v9 - AnTuTu v9 CPU
100%
1 M2 +
min: 294643     avg: 298254     median: 298254 (82%)     max: 301865 Points
CrossMark - CrossMark Overall
100%
1 M2 +
min: 1437     avg: 1515     median: 1507 (58%)     max: 1585 Points
Power Consumption - Prime95 Power Consumption - external Monitor *
17 Watt (3%)
Power Consumption - Cinebench R15 Multi Power Consumption - external Monitor *
100%
1 M2 +
29 Watt (5%)
Power Consumption - Geekbench 5.5 Power Consumption 150cd *
100%
1 M2 +
min: 6.86     avg: 8.3     median: 8.4 (4%)     max: 9.71 Watt
Power Consumption - Idle Power Consumption - external Monitor *
100%
1 M2 +
min: 2.03     avg: 2.6     median: 2.4 (2%)     max: 3.98 Watt
Power Consumption - Idle Power Consumption 150cd 1min *
5.6 Watt (6%)
102%
1 M2 +
min: 1.631     avg: 3.5     median: 3.6 (4%)     max: 5.32 Watt
Power Consumption - Cinebench R15 Multi Power Efficiency - external Monitor
100%
1 M2 +
42.4 Points per Watt (32%)

Average Benchmarks Qualcomm Snapdragon 8cx Gen 2 5G → 100% n=5

Average Benchmarks Apple M2 → 228% n=5

Average Benchmarks Microsoft SQ1 → 93% n=5

- Range of benchmark values for this graphics card
- Average benchmark values for this graphics card
* Smaller numbers mean a higher performance
1 This benchmark is not used for the average calculation

v1.28
log 04. 01:09:30

#0 checking url part for id 13120 +0s ... 0s

#1 checking url part for id 14521 +0s ... 0s

#2 checking url part for id 11516 +0s ... 0s

#3 redirected to Ajax server, took 1720048170 +0s ... 0s

#4 did not recreate cache, as it is less than 5 days old! Created at Mon, 01 Jul 2024 05:15:43 +0200 +0s ... 0s

#5 composed specs +0.008s ... 0.008s

#6 did output specs +0s ... 0.008s

#7 getting avg benchmarks for device 13120 +0.001s ... 0.008s

#8 got single benchmarks 13120 +0.004s ... 0.013s

#9 getting avg benchmarks for device 14521 +0.001s ... 0.013s

#10 got single benchmarks 14521 +0.008s ... 0.021s

#11 getting avg benchmarks for device 11516 +0.001s ... 0.022s

#12 got single benchmarks 11516 +0.003s ... 0.025s

#13 got avg benchmarks for devices +0s ... 0.025s

#14 min, max, avg, median took s +0.021s ... 0.046s

#15 return log +0s ... 0.046s

Please share our article, every link counts!
> Expert Reviews and News on Laptops, Smartphones and Tech Innovations > Benchmarks / Tech > Processor Comparison - Head 2 Head
Redaktion, 2017-09- 8 (Update: 2023-07- 1)