Notebookcheck Logo

Qualcomm Snapdragon 8 Gen 2 for Galaxy vs Apple M1 Max vs Apple M1

Qualcomm Snapdragon 8 Gen 2 for Galaxy

► remove from comparison Qualcomm SD 8 Gen 2 for Galaxy

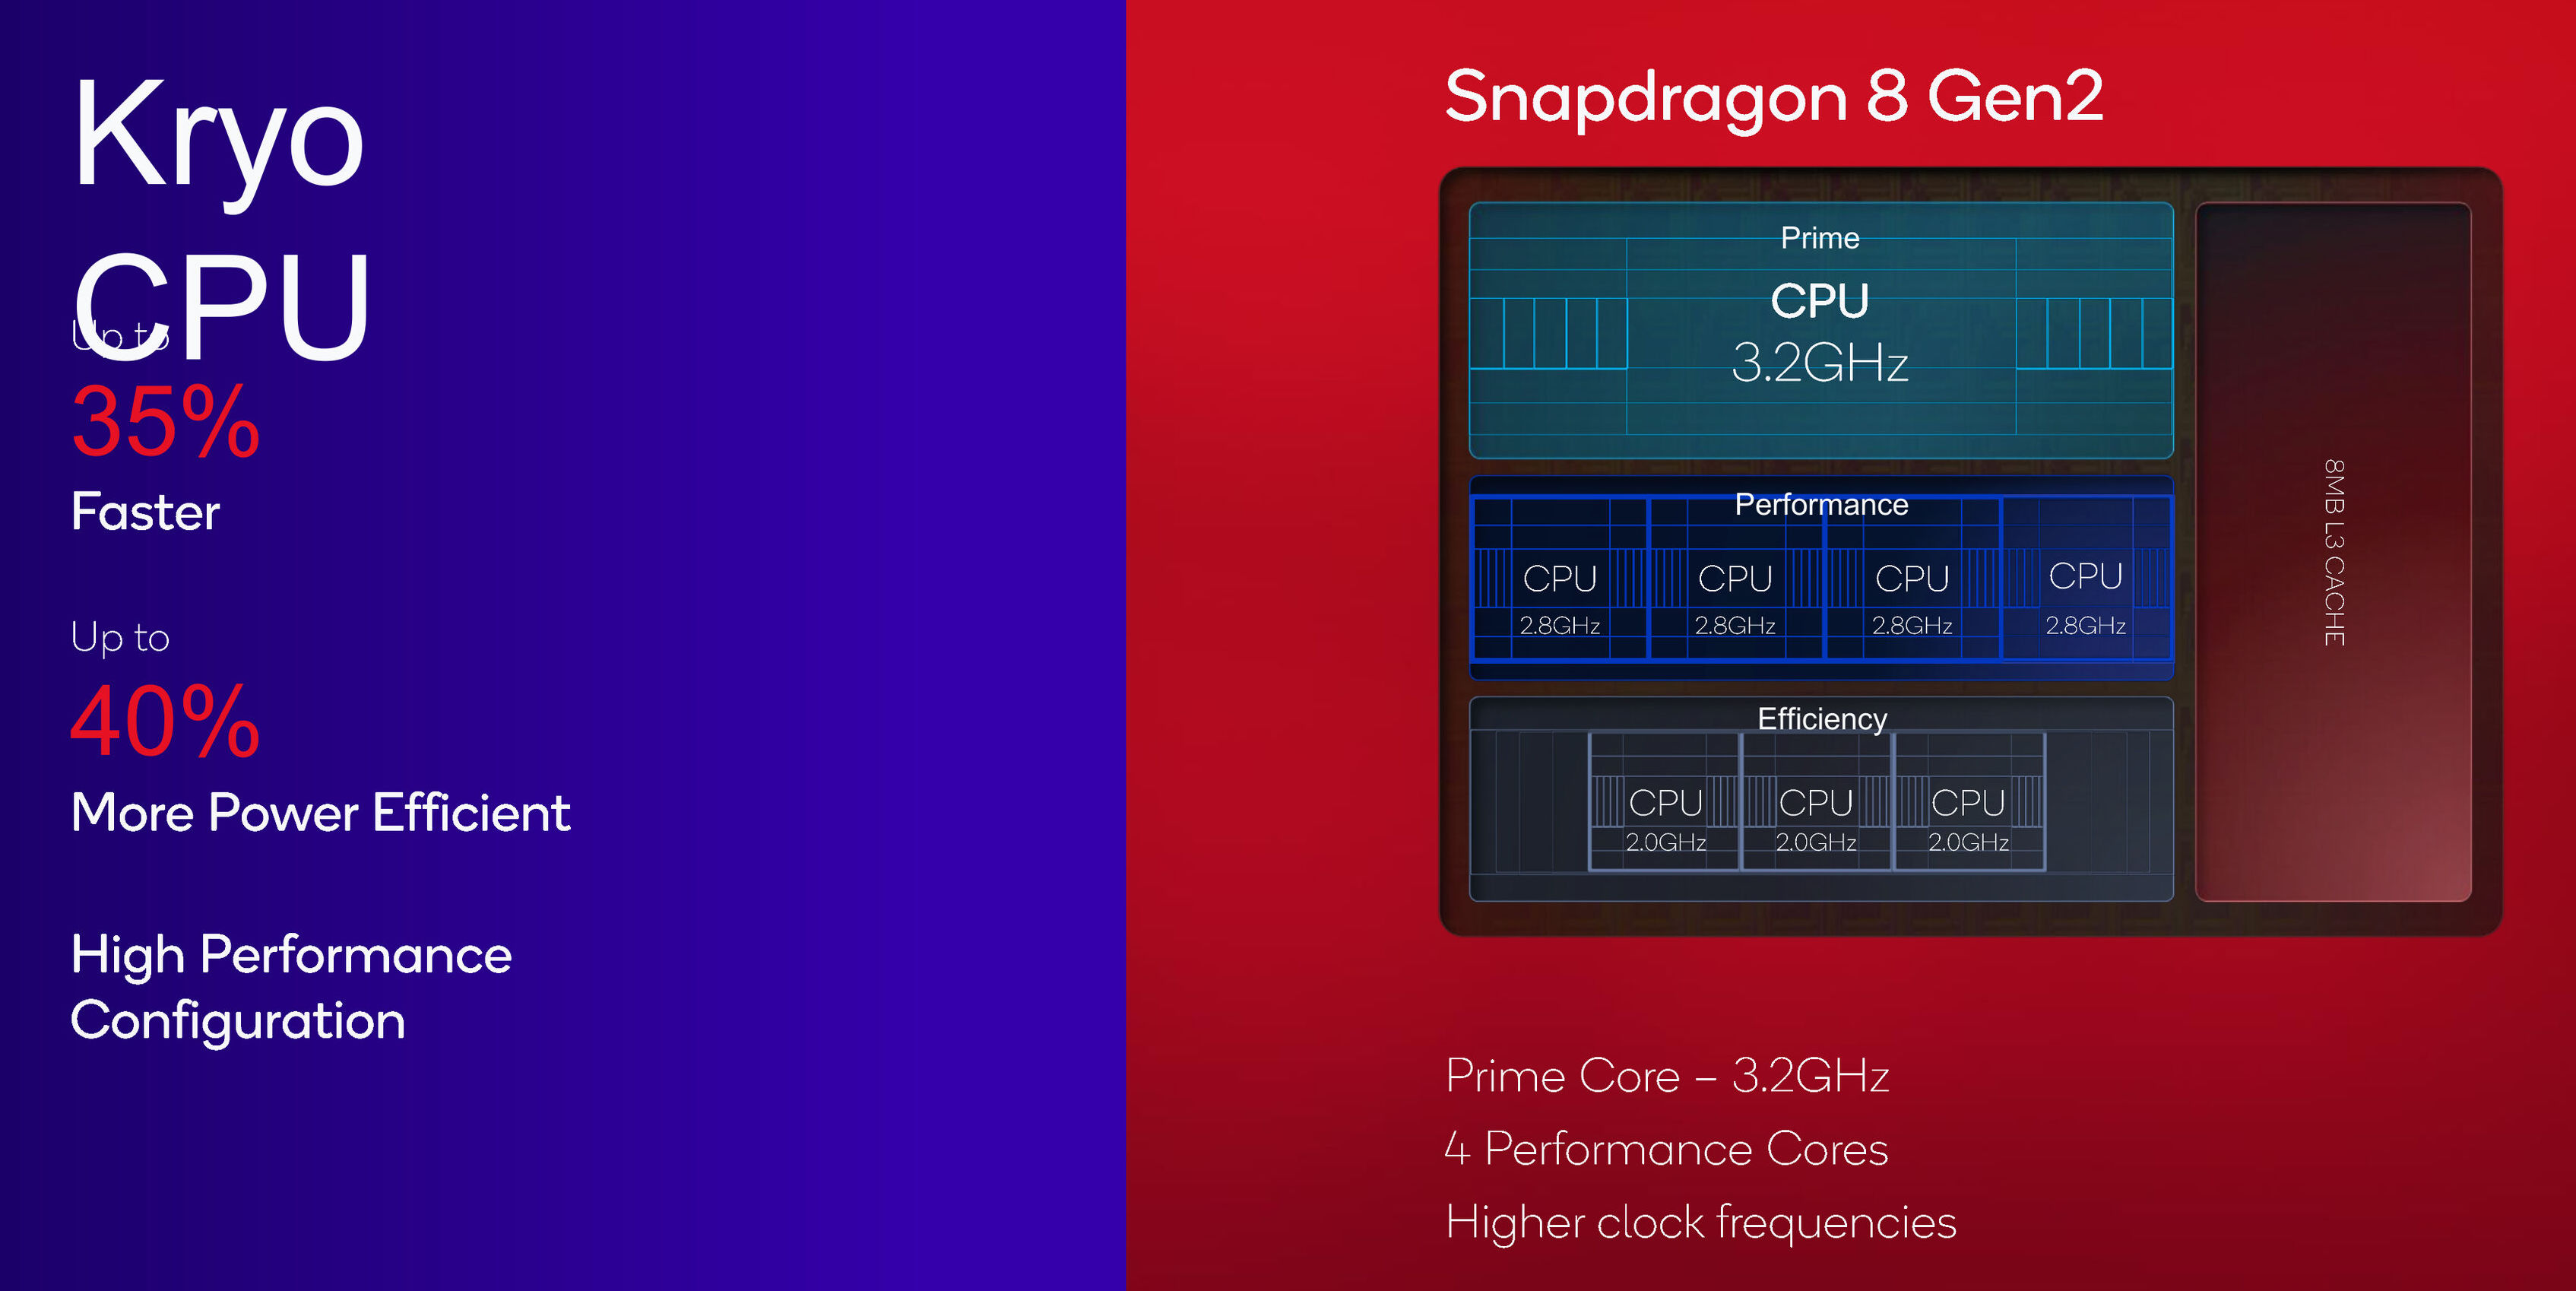
The Qualcomm Snapdragon 8 Gen 2 for Galaxy Mobile Platform is a high-end SoC for smartphones that was introduced in late 2022 and manufactured in 4 nm at TSMC (N4P). It integrates four different CPU clusters. A fast and big prime core based on the ARM Cortex-X3 architecture and clocked at up to 3.36 GHz for 64 bit applications. Two more ARM Cortex-A715 based performance cores clocked at up to 2.8 GHz (also only for 64 bit apps). Two more Cortex-A710 performance cores at up to 2.8 GHz that can also be used for older apps and three efficiency cores (ARM Cortex-A510 with up to 2 GHz). All cores can use the shared 8 MB level 3 cache. Compared to the normal SD 8 Gen 2, the "for Galaxy" version offers a 160 MHz higher clocked prime core.

Thanks to the new architecture and high clock rates, the SD 8 Gen 2 is the fastest mobile CPU for Android based devices and is only topped by current Apple SoCs like the Apple A16 (see benchmarks below).

The chip also integrates a Hexagon accelerator for AI workloads (tensor, scalar and vector). Qualcomm states that its one of the first chips with INT4 support and up to 4.35x performance compared to the previous generation. 

The 18-Bit-Spectra ISP is able to process photos with up to 200 MP and work with videos up to 8k30 (including 10-bit, HDR10+, HLG and Dolby Vision).

A big improvement of the Snapdragon 8 G2 is the integrated Adreno 740 GPU, that now supports Hardware Raytracing and tops even the iGPU in the Apple A16.

The integrated AI Engine can offer up to 4x faster AI performance thanks to the bigger Tensor engine. The 18-Bit-Spectra-ISP also saw some big improvements and is now called Snapdragon Sight.

The integrated Adreno 730 offers a 30% graphics boost compared to the previous Adreno 660.

The integrated Snapdragon X70 5G modem is also new as is the FastConnect 7800 modem with Wi-Fi 7 and Bluetooth 5.3 support.

Apple M1 Max

► remove from comparison Apple M1 Max

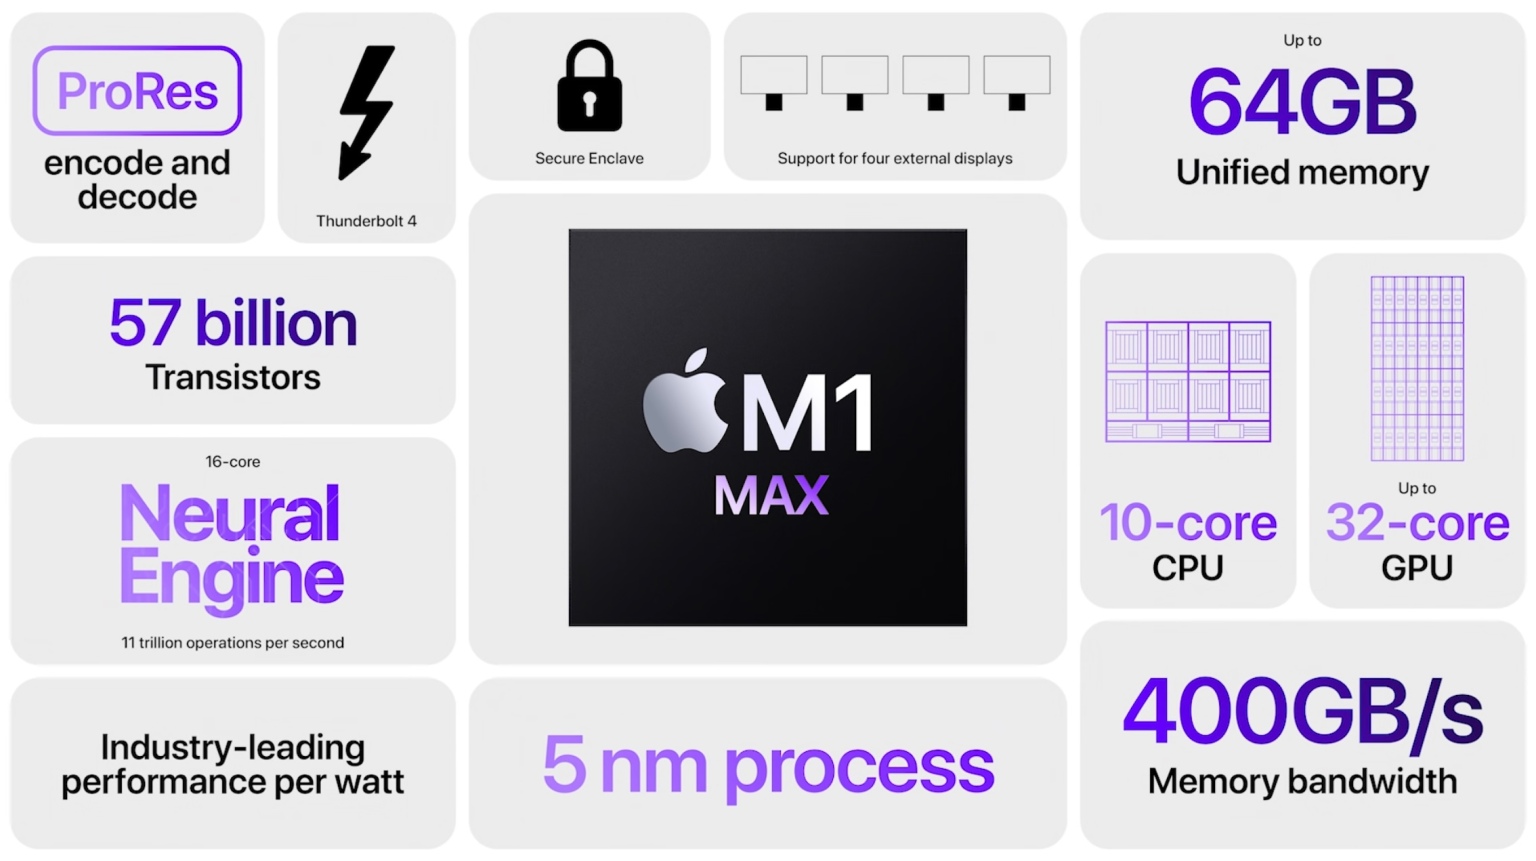
The Apple M1 Max is a System on a Chip (SoC) from Apple that is found in the late 2021 MacBook Pro 14 and 16-inch models. It offers all 10 cores available in the chip divided in eight performance cores (P-cores with 600 - 3220 MHz) and two power-efficiency cores (E-cores with 600 - 2064 MHz). There is no Turbo Boost for single cores or short burst periods. The cores are similar to the cores in the Apple M1.

The big cores (codename Firestorm) offer 192 KB instruction cache, 128 KB data cache, and 24 MB shared L2 cache (up from 12 MB in the M1). The four efficiency cores (codename Icestorm) are a lot smaller and offer only 128 KB instruction cache, 64 KB data cache, and 4 MB shared cache. CPU and GPU can both use the 48 MB SLC (System Level Cache). The efficiency cores (E cluster) clock with 600 - 2064 MHz, the performance cores (P cluster) with 600 - 3228 MHz.

The unified memory (32 or 64 GB LPDDR5-6400) next to the chip is connected by a 512 bit memory controller (200 GB/s bandwidth) and can be used by the GPU and CPU. This is the main difference to the M1 Pro and the CPU performance is quite similar.

The biggest difference to the M1 Pro is the bigger integrated GPU with 24 or 32 cores (up from 16).

Furthermore, the SoC integrates a fast 16 core neural engine, a secure enclave (e.g., for encryption), a unified memory architecture, Thunderbolt 4 controller, an ISP, and media de- and encoders (including two ProRes engines).

The M1 Pro is manufactured in 5 nm at TSMC and integrates 57 billion transistors. The peak power consumption of the chip was advertised around 30W for CPU intensive tasks. 

Apple M1

► remove from comparison Apple M1

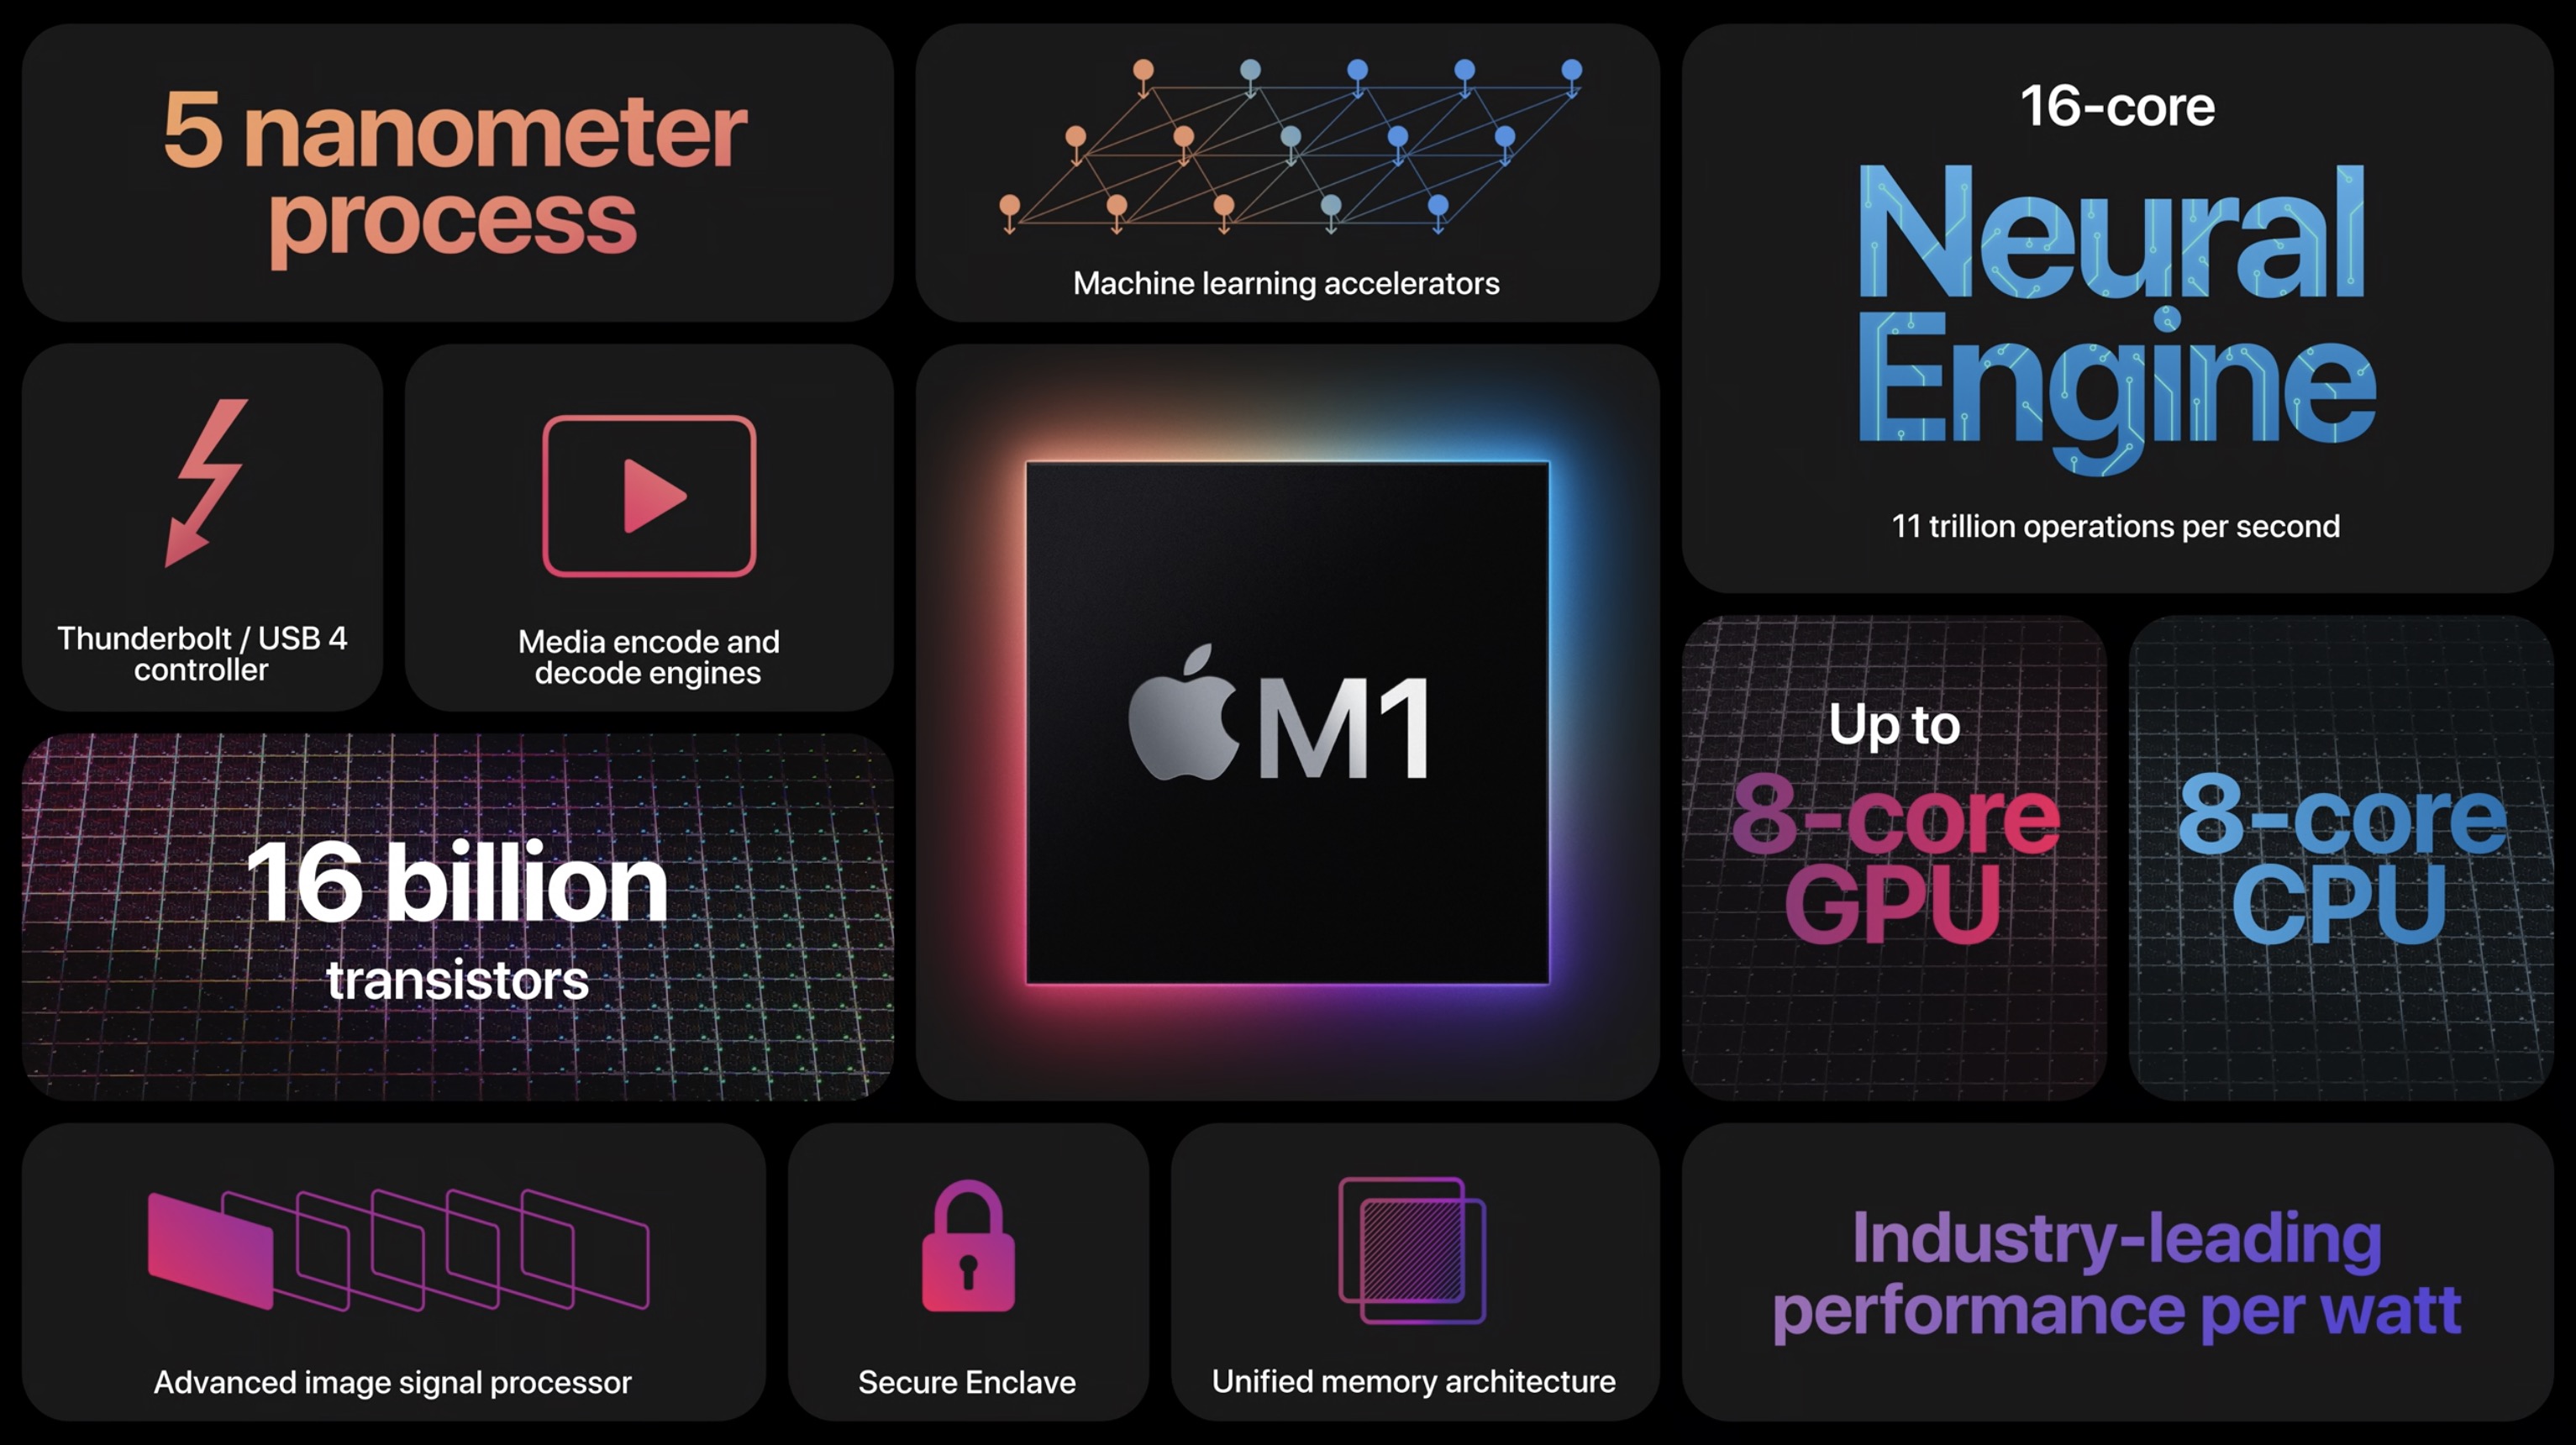
The Apple M1 is a System on a Chip (SoC) from Apple that is found in the late 2020 MacBook Air, MacBook Pro 13, and Mac Mini. It offers 8 cores divided in four performance cores and four power-efficiency cores. The big cores offer 192 KB instruction cache, 128 KB data cache, and 12 MB shared L2 cache. According to Apple the performance of these cores should be better than anything on the market (in late 2020). The four efficiency cores are a lot smaller and offer only 128 KB instruction cache, 64 KB data cache, and 4 MB shared cache. The efficiency cores (E cluster) clock with 600 - 2064 MHz, the performance cores (P cluster) with 600 - 3204 MHz.

The M1 is available in two TDP variants, a passive cooled 10 Watt variant for the MacBook Air and an active cooled faster variant for the MacBook Pro 13 and Mac Mini. Those should offer a better-sustained performance according to Apple.

The integrated graphics card in the M1 offers 8 cores (7 cores in the entry MacBook Air) and a peak performance of 2.6 teraflops. Apple claims that it is faster than any other iGPU at the time of announcement.

Furthermore, the SoC integrates a fast 16 core neural engine with a peak performance of 11 TOPS (for AI hardware acceleration), a secure enclave (e.g., for encryption), a unified memory architecture, Thunderbolt / USB 4 controller, an ISP, and media de- and encoders.

The Apple M1 includes 16 billion transistors (up from the 10 billion of the A12Z Bionic and therefore double the amount of a Tiger Lake-U chip like the i7-1185G7) and is manufactured in 5nm at TSMC.

ModelQualcomm Snapdragon 8 Gen 2 for GalaxyApple M1 MaxApple M1
SeriesQualcomm SnapdragonApple Apple M-SeriesApple Apple M-Series
CodenameCortex-X3 / A715 / A710 / A510 (Kryo)
Series: Apple M-Series
Qualcomm Snapdragon 8 Gen 2 for Galaxy « 2 - 3.36 GHz8 / 8 cores8 MB L3
Qualcomm Snapdragon 8 Gen 22 - 3.2 GHz8 / 8 cores8 MB L3
Apple M1 Max « 2.06 - 3.22 GHz10 / 10 cores48 MB L3
Apple M1 Pro2.06 - 3.22 GHz10 / 10 cores24 MB L3
Apple M1 Pro 8-Core2.06 - 3.22 GHz8 / 8 cores16 MB L3
Apple M12.06 - 3.22 GHz8 / 8 cores8 MB L3
Apple M1 Max2.06 - 3.22 GHz10 / 10 cores48 MB L3
Apple M1 Pro2.06 - 3.22 GHz10 / 10 cores24 MB L3
Apple M1 Pro 8-Core2.06 - 3.22 GHz8 / 8 cores16 MB L3
Apple M1 « 2.06 - 3.22 GHz8 / 8 cores8 MB L3
Clock2000 - 3360 MHz2060 - 3220 MHz2064 - 3220 MHz
L3 Cache8 MB48 MB8 MB
Cores / Threads8 / 8
1 x 3.4 GHz ARM Cortex-X3
2 x 2.8 GHz ARM Cortex-A715
2 x 2.8 GHz ARM Cortex-A710
3 x 2.0 GHz ARM Cortex-A510
10 / 108 / 8
Technology4 nm5 nm5 nm
FeaturesAdreno GPU, Spectra ISP, Hexagon, X70 5G Modem, FastConnect 7800 Wi-Fi 7, LPDDR5x 4200 MHz Memory ControllerARMv8 Instruction SetARMv8 Instruction Set
iGPUQualcomm Adreno 740Apple M1 Max 32-Core GPUApple M1 8-Core GPU
ArchitectureARM v9ARMARM
Announced
Manufacturerwww.qualcomm.com
L1 Cache2.9 MB2 MB
L2 Cache28 MB16 MB
Transistors57000 Million16000 Million

Benchmarks

Cinebench 2024 - Cinebench 2024 CPU Single Core
100%
1 M1 +
110 Points (76%)
Cinebench 2024 - Cinebench 2024 CPU Multi Core
100%
1 M1 +
444 Points (8%)
Cinebench R23 - Cinebench R23 Multi Core
100%
1 M1 Max +
min: 12385     avg: 12389     median: 12386 (12%)     max: 12396 Points
63%
1 M1 +
min: 7409     avg: 7728     median: 7800.5 (7%)     max: 7830 Points
Cinebench R23 - Cinebench R23 Single Core
100%
1 M1 Max +
min: 1530     avg: 1533     median: 1533 (65%)     max: 1536 Points
99%
1 M1 +
min: 1496     avg: 1512     median: 1514.5 (64%)     max: 1520 Points
Cinebench R20 - Cinebench R20 CPU (Single Core)
100%
1 M1 Max +
min: 390     avg: 393.3     median: 395 (44%)     max: 395 Points
102%
1 M1 +
min: 401     avg: 403     median: 402.5 (45%)     max: 406 Points
Cinebench R20 - Cinebench R20 CPU (Multi Core)
100%
1 M1 Max +
min: 2735     avg: 2746     median: 2750 (7%)     max: 2753 Points
76%
1 M1 +
min: 1863     avg: 2040     median: 2093.5 (5%)     max: 2109 Points
Cinebench R15 - Cinebench R15 CPU Multi 64 Bit
100%
1 M1 Max +
min: 1689     avg: 1691     median: 1691 (11%)     max: 1693 Points
63%
1 M1 +
min: 1020     avg: 1063     median: 1072 (7%)     max: 1087 Points
Cinebench R15 - Cinebench R15 CPU Single 64 Bit
100%
1 M1 Max +
min: 197     avg: 202.3     median: 200 (60%)     max: 210 Points
104%
1 M1 +
min: 206     avg: 207.3     median: 208 (63%)     max: 208 Points
7-Zip 18.03 - 7-Zip 18.03 Multli Thread 4 runs
100%
1 M1 +
34614 MIPS (20%)
7-Zip 18.03 - 7-Zip 18.03 Single Thread 4 runs
100%
1 M1 +
5441 MIPS (65%)
Blender - Blender 3.3 Classroom CPU *
100%
1 M1 +
964 Seconds (12%)
Blender - Blender 2.79 BMW27 CPU *
100%
1 M1 Max +
min: 187     avg: 188.7     median: 189 (1%)     max: 190 Seconds
97%
1 M1 +
min: 412     avg: 561     median: 561 (4%)     max: 710 Seconds
R Benchmark 2.5 - R Benchmark 2.5 *
100%
1 M1 +
0.7 sec (16%)
47%
1 M1 +
2711 Points (32%)
52%
1 M1 +
min: 1956     avg: 3137     median: 3136.5 (36%)     max: 4317 Points
115%
1 M1 +
2363 Points (64%)
158%
1 M1 +
8622 Points (34%)
min: 1764     avg: 1780     median: 1782 (75%)     max: 1795 Points
min: 12563     avg: 12656     median: 12697 (23%)     max: 12708 Points
Geekbench 4.4 - Geekbench 4.1 - 4.4 64 Bit Single-Core
min: 8370     avg: 8391     median: 8380 (84%)     max: 8424 Points
Geekbench 4.4 - Geekbench 4.1 - 4.4 64 Bit Multi-Core
min: 21038     avg: 21162     median: 21209 (23%)     max: 21238 Points
Geekbench 4.0 - Geekbench 4.0 64 Bit Single-Core
min: 6882     avg: 6950     median: 6949.5 (95%)     max: 7017 Points
Geekbench 4.0 - Geekbench 4.0 64 Bit Multi-Core
min: 19260     avg: 19271     median: 19270.5 (47%)     max: 19281 Points
Geekbench 3 - Geekbench 3 64 Bit Multi-Core
19117 Points (30%)
Geekbench 3 - Geekbench 3 64 Bit Single-Core
6624 Points (99%)
Mozilla Kraken 1.1 - Kraken 1.1 Total Score *
min: 634.3     avg: 795     median: 696.2 (1%)     max: 1532.5 ms
min: 404.3     avg: 459.2     median: 482.3 (1%)     max: 491.1 ms
100%
M1 +
min: 418     avg: 473.8     median: 483 (1%)     max: 516 ms
Sunspider - Sunspider 1.0 Total Score *
100%
1 M1 +
min: 65.2     avg: 75.9     median: 76.4 (1%)     max: 86.1 ms
Octane V2 - Octane V2 Total Score
min: 49582     avg: 59058     median: 60115 (53%)     max: 64715 Points
min: 66938     avg: 68647     median: 68029 (60%)     max: 70973 Points
104%
M1 +
min: 62055     avg: 63340     median: 62589.5 (55%)     max: 66974 Points
115%
1 M1 +
189 Points (54%)
WebXPRT 3 - WebXPRT 3 Score
min: 183     avg: 219     median: 231 (48%)     max: 243 Points
min: 350     avg: 358.7     median: 360 (75%)     max: 366 Points
121%
M1 +
min: 216     avg: 266.3     median: 280.5 (58%)     max: 304 Points
AnTuTu v8 - AnTuTu v8 UX
100%
1 M1 +
min: 104389     avg: 105297     median: 105297 (88%)     max: 106205 Points
AnTuTu v8 - AnTuTu v8 MEM
100%
1 M1 +
min: 110874     avg: 111266     median: 111266 (90%)     max: 111658 Points
AnTuTu v8 - AnTuTu v8 GPU
100%
1 M1 +
min: 533978     avg: 539206     median: 539206 (99%)     max: 544434 Points
AnTuTu v8 - AnTuTu v8 CPU
100%
1 M1 +
min: 267169     avg: 271808     median: 271808 (98%)     max: 276446 Points
AnTuTu v8 - AnTuTu v8 Total Score
100%
1 M1 +
min: 1017190     avg: 1027580     median: 1027580 (99%)     max: 1037960 Points
95%
1 M1 +
min: 1040910     avg: 1113810     median: 1113810 (67%)     max: 1186710 Points
98%
1 M1 +
min: 244643     avg: 254253     median: 254252 (70%)     max: 263862 Points
PCMark for Android - PCM f. Android Storage 2.0 random write internal
85.7 MB/s (63%)
PCMark for Android - PCM f. Android Storage 2.0 seq write internal
2081 MB/s (64%)
PCMark for Android - PCM f. Android Storage 2.0 random read internal
50.9 MB/s (62%)
PCMark for Android - PCM f. Android Storage 2.0 seq read internal
2371 MB/s (66%)
PCMark for Android - PCM f. Android Storage 2.0 score
min: 35786     avg: 42805     median: 41063 (65%)     max: 48832 Points
min: 1586     avg: 1607     median: 1615 (62%)     max: 1621 Points
104%
M1 +
min: 1266     avg: 1301     median: 1283 (49%)     max: 1355 Points
Power Consumption - Prime95 Power Consumption - external Monitor *
100%
1 M1 Max +
50.8 Watt (9%)
Power Consumption - Cinebench R15 Multi Power Consumption - external Monitor *
100%
1 M1 Max +
53 Watt (10%)
105%
1 M1 +
27.2 Watt (5%)
99%
1 M1 +
min: 8.23     avg: 8.7     median: 8.5 (4%)     max: 9.49 Watt
Power Consumption - Idle Power Consumption - external Monitor *
100%
1 M1 Max +
11.6 Watt (8%)
106%
1 M1 +
3 Watt (2%)
97%
1 M1 +
min: 2.29     avg: 2.9     median: 3.1 (3%)     max: 3.22 Watt
Power Consumption - Cinebench R15 Multi Power Efficiency - external Monitor
100%
1 M1 Max +
31.9 Points per Watt (24%)
118%
1 M1 +
37.5 Points per Watt (28%)

Average Benchmarks Qualcomm Snapdragon 8 Gen 2 for Galaxy → 100% n=6

Average Benchmarks Apple M1 Max → 145% n=6

Average Benchmarks Apple M1 → 115% n=6

- Range of benchmark values for this graphics card
- Average benchmark values for this graphics card
* Smaller numbers mean a higher performance
1 This benchmark is not used for the average calculation

v1.28
log 02. 05:24:00

#0 checking url part for id 14990 +0s ... 0s

#1 checking url part for id 13843 +0s ... 0s

#2 checking url part for id 12937 +0s ... 0s

#3 redirected to Ajax server, took 1719890640 +0s ... 0s

#4 did not recreate cache, as it is less than 5 days old! Created at Mon, 01 Jul 2024 05:15:43 +0200 +0s ... 0s

#5 composed specs +0.005s ... 0.006s

#6 did output specs +0s ... 0.006s

#7 getting avg benchmarks for device 14990 +0.001s ... 0.006s

#8 got single benchmarks 14990 +0.009s ... 0.015s

#9 getting avg benchmarks for device 13843 +0.001s ... 0.016s

#10 got single benchmarks 13843 +0.004s ... 0.02s

#11 getting avg benchmarks for device 12937 +0s ... 0.02s

#12 got single benchmarks 12937 +0.001s ... 0.021s

#13 got avg benchmarks for devices +0s ... 0.021s

#14 min, max, avg, median took s +0.027s ... 0.048s

#15 return log +0s ... 0.048s

Please share our article, every link counts!
> Expert Reviews and News on Laptops, Smartphones and Tech Innovations > Benchmarks / Tech > Processor Comparison - Head 2 Head
Redaktion, 2017-09- 8 (Update: 2023-07- 1)